

sercdp0172
sercdp0172
sercdp0172

Create successful ePaper yourself
Turn your PDF publications into a flip-book with our unique Google optimized e-Paper software.
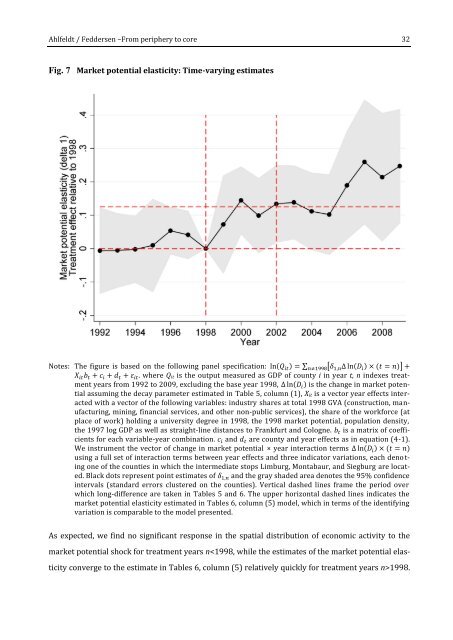
Ahlfeldt / Feddersen –From periphery to core 32Fig. 7 Market potential elasticity: Time-varying estimatesNotes: The figure is based on the following panel specification: ln(Q it ) = ∑ n≠1998 [δ 1,n ∆ ln(D i ) × (t = n)] +X it b t + c i + d t + ε it . where Q it is the output measured as GDP of county i in year t, n indexes treatmentyears from 1992 to 2009, excluding the base year 1998, ∆ ln(D i ) is the change in market potentialassuming the decay parameter estimated in Table 5, column (1), X it is a vector year effects interactedwith a vector of the following variables: industry shares at total 1998 GVA (construction, manufacturing,mining, financial services, and other non-public services), the share of the workforce (atplace of work) holding a university degree in 1998, the 1998 market potential, population density,the 1997 log GDP as well as straight-line distances to Frankfurt and Cologne. b t is a matrix of coefficientsfor each variable-year combination. c i and d t are county and year effects as in equation (4-1).We instrument the vector of change in market potential × year interaction terms ∆ ln(D i ) × (t = n)using a full set of interaction terms between year effects and three indicator variations, each deno t-ing one of the counties in which the intermediate stops Limburg, Montabaur, and Siegburg are located.Black dots represent point estimates of δ 1,n and the gray shaded area denotes the 95% confidenceintervals (standard errors clustered on the counties). Vertical dashed lines frame the period overwhich long-difference are taken in Tables 5 and 6. The upper horizontal dashed lines indicates themarket potential elasticity estimated in Tables 6, column (5) model, which in terms of the identifyingvariation is comparable to the model presented.As expected, we find no significant response in the spatial distribution of economic activity to themarket potential shock for treatment years n1998.