Job Opportunities and Unemployment - Department of Labour
Job Opportunities and Unemployment - Department of Labour
Job Opportunities and Unemployment - Department of Labour
Create successful ePaper yourself
Turn your PDF publications into a flip-book with our unique Google optimized e-Paper software.
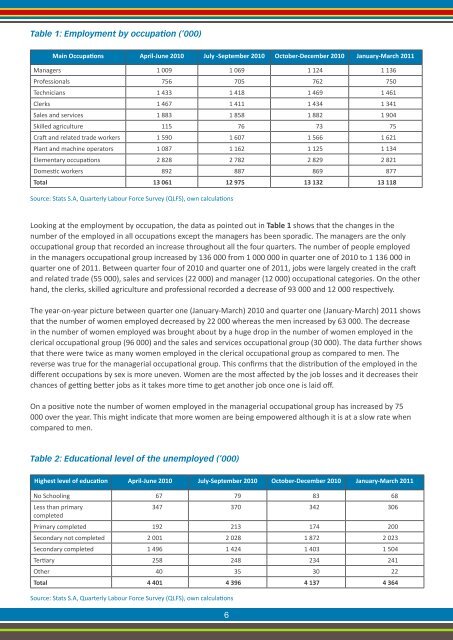
Table 1: Employment by occupation (‘000)Main Occupations April-June 2010 July -September 2010 October-December 2010 January-March 2011Managers 1 009 1 069 1 124 1 136Pr<strong>of</strong>essionals 756 705 762 750Technicians 1 433 1 418 1 469 1 461Clerks 1 467 1 411 1 434 1 341Sales <strong>and</strong> services 1 883 1 858 1 882 1 904Skilled agriculture 115 76 73 75Craft <strong>and</strong> related trade workers 1 590 1 607 1 566 1 621Plant <strong>and</strong> machine operators 1 087 1 162 1 125 1 134Elementary occupations 2 828 2 782 2 829 2 821Domestic workers 892 887 869 877Total 13 061 12 975 13 132 13 118Source: Stats S.A, Quarterly <strong>Labour</strong> Force Survey (QLFS), own calculationsLooking at the employment by occupation, the data as pointed out in Table 1 shows that the changes in thenumber <strong>of</strong> the employed in all occupations except the managers has been sporadic. The managers are the onlyoccupational group that recorded an increase throughout all the four quarters. The number <strong>of</strong> people employedin the managers occupational group increased by 136 000 from 1 000 000 in quarter one <strong>of</strong> 2010 to 1 136 000 inquarter one <strong>of</strong> 2011. Between quarter four <strong>of</strong> 2010 <strong>and</strong> quarter one <strong>of</strong> 2011, jobs were largely created in the craft<strong>and</strong> related trade (55 000), sales <strong>and</strong> services (22 000) <strong>and</strong> manager (12 000) occupational categories. On the otherh<strong>and</strong>, the clerks, skilled agriculture <strong>and</strong> pr<strong>of</strong>essional recorded a decrease <strong>of</strong> 93 000 <strong>and</strong> 12 000 respectively.The year-on-year picture between quarter one (January-March) 2010 <strong>and</strong> quarter one (January-March) 2011 showsthat the number <strong>of</strong> women employed decreased by 22 000 whereas the men increased by 63 000. The decreasein the number <strong>of</strong> women employed was brought about by a huge drop in the number <strong>of</strong> women employed in theclerical occupational group (96 000) <strong>and</strong> the sales <strong>and</strong> services occupational group (30 000). The data further showsthat there were twice as many women employed in the clerical occupational group as compared to men. Thereverse was true for the managerial occupational group. This confirms that the distribution <strong>of</strong> the employed in thedifferent occupations by sex is more uneven. Women are the most affected by the job losses <strong>and</strong> it decreases theirchances <strong>of</strong> getting better jobs as it takes more time to get another job once one is laid <strong>of</strong>f.On a positive note the number <strong>of</strong> women employed in the managerial occupational group has increased by 75000 over the year. This might indicate that more women are being empowered although it is at a slow rate whencompared to men.Table 2: Educational level <strong>of</strong> the unemployed (‘000)Highest level <strong>of</strong> education April-June 2010 July-September 2010 October-December 2010 January-March 2011No Schooling 67 79 83 68Less than primary347 370 342 306completedPrimary completed 192 213 174 200Secondary not completed 2 001 2 028 1 872 2 023Secondary completed 1 496 1 424 1 403 1 504Tertiary 258 248 234 241Other 40 35 30 22Total 4 401 4 396 4 137 4 364Source: Stats S.A, Quarterly <strong>Labour</strong> Force Survey (QLFS), own calculations6


