Job Opportunities and Unemployment - Department of Labour
Job Opportunities and Unemployment - Department of Labour
Job Opportunities and Unemployment - Department of Labour

Create successful ePaper yourself
Turn your PDF publications into a flip-book with our unique Google optimized e-Paper software.
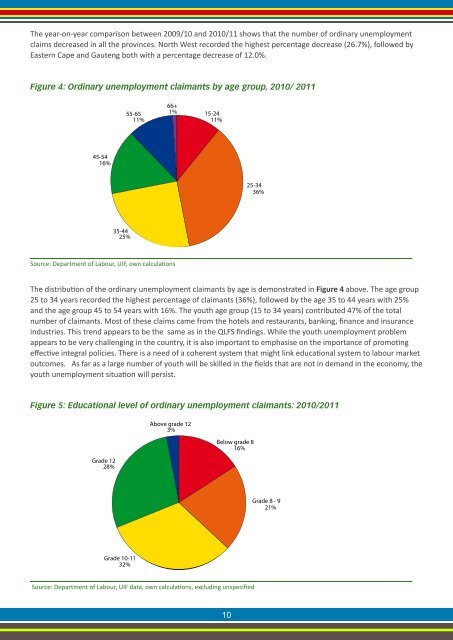
The year-on-year comparison between 2009/10 <strong>and</strong> 2010/11 shows that the number <strong>of</strong> ordinary unemploymentclaims decreased in all the provinces. North West recorded the highest percentage decrease (26.7%), followed byEastern Cape <strong>and</strong> Gauteng both with a percentage decrease <strong>of</strong> 12.0%.Figure 4: Ordinary unemployment claimants by age group, 2010/ 201155-6511%66+1%15-2411%45-5416%25-3436%35-4425%Source: <strong>Department</strong> <strong>of</strong> <strong>Labour</strong>, UIF, own calculationsThe distribution <strong>of</strong> the ordinary unemployment claimants by age is demonstrated in Figure 4 above. The age group25 to 34 years recorded the highest percentage <strong>of</strong> claimants (36%), followed by the age 35 to 44 years with 25%<strong>and</strong> the age group 45 to 54 years with 16%. The youth age group (15 to 34 years) contributed 47% <strong>of</strong> the totalnumber <strong>of</strong> claimants. Most <strong>of</strong> these claims came from the hotels <strong>and</strong> restaurants, banking, finance <strong>and</strong> insuranceindustries. This trend appears to be the same as in the QLFS findings. While the youth unemployment problemappears to be very challenging in the country, it is also important to emphasise on the importance <strong>of</strong> promotingeffective integral policies. There is a need <strong>of</strong> a coherent system that might link educational system to labour marketoutcomes. As far as a large number <strong>of</strong> youth will be skilled in the fields that are not in dem<strong>and</strong> in the economy, theyouth unemployment situation will persist.Figure 5: Educational level <strong>of</strong> ordinary unemployment claimants: 2010/2011Above grade 123%Below grade 816%Grade 1228%Grade 8 - 921%Grade 10-1132%Source: <strong>Department</strong> <strong>of</strong> <strong>Labour</strong>, UIF data, own calculations, excluding unspecified10