Coastal Upwelling - Monterey Bay California
Coastal Upwelling - Monterey Bay California
Coastal Upwelling - Monterey Bay California

You also want an ePaper? Increase the reach of your titles
YUMPU automatically turns print PDFs into web optimized ePapers that Google loves.
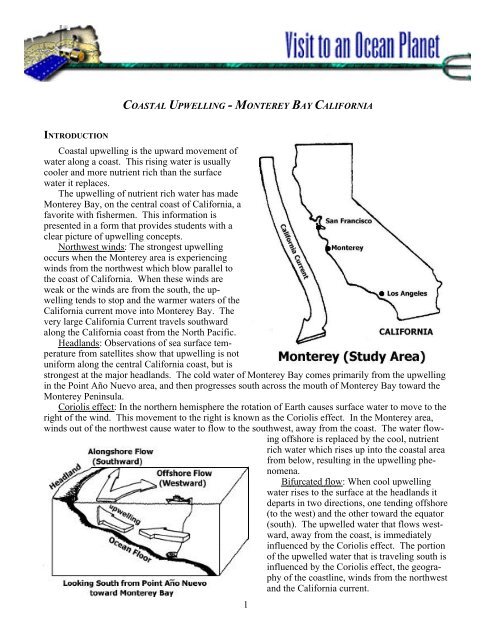
COASTAL UPWELLING - MONTEREY BAY CALIFORNIAINTRODUCTION<strong>Coastal</strong> upwelling is the upward movement ofwater along a coast. This rising water is usuallycooler and more nutrient rich than the surfacewater it replaces.The upwelling of nutrient rich water has made<strong>Monterey</strong> <strong>Bay</strong>, on the central coast of <strong>California</strong>, afavorite with fishermen. This information ispresented in a form that provides students with aclear picture of upwelling concepts.Northwest winds: The strongest upwellingoccurs when the <strong>Monterey</strong> area is experiencingwinds from the northwest which blow parallel tothe coast of <strong>California</strong>. When these winds areweak or the winds are from the south, the upwellingtends to stop and the warmer waters of the<strong>California</strong> current move into <strong>Monterey</strong> <strong>Bay</strong>. Thevery large <strong>California</strong> Current travels southwardalong the <strong>California</strong> coast from the North Pacific.Headlands: Observations of sea surface temperaturefrom satellites show that upwelling is notuniform along the central <strong>California</strong> coast, but isstrongest at the major headlands. The cold water of <strong>Monterey</strong> <strong>Bay</strong> comes primarily from the upwellingin the Point Año Nuevo area, and then progresses south across the mouth of <strong>Monterey</strong> <strong>Bay</strong> toward the<strong>Monterey</strong> Peninsula.Coriolis effect: In the northern hemisphere the rotation of Earth causes surface water to move to theright of the wind. This movement to the right is known as the Coriolis effect. In the <strong>Monterey</strong> area,winds out of the northwest cause water to flow to the southwest, away from the coast. The water flowingoffshore is replaced by the cool, nutrientrich water which rises up into the coastal areafrom below, resulting in the upwelling phenomena.Bifurcated flow: When cool upwellingwater rises to the surface at the headlands itdeparts in two directions, one tending offshore(to the west) and the other toward the equator(south). The upwelled water that flows westward,away from the coast, is immediatelyinfluenced by the Coriolis effect. The portionof the upwelled water that is traveling south isinfluenced by the Coriolis effect, the geographyof the coastline, winds from the northwestand the <strong>California</strong> current.1
The upwelling water can be tracked by measuring its cool temperature, high nutrient content, highsalinity and high density. The nutrients brought to the surface encourage the high plankton productivityof the <strong>Monterey</strong> <strong>Bay</strong> area which is why it is an excellent fishing locality.PART I. MAPPINGChange the numerical sea surface temperature satellite data into a color image for ease of interpretation.Use the map of sea surface temperatures of the <strong>Monterey</strong> <strong>Bay</strong> area and a set of colored pencils toproduce a more visually understood sequence of colors. Color in the areas of sea surface temperatureusing a different color for each temperature. Move through the “ROY G. BIV” (Red, Orange, Yellow,Green, Blue, Indigo, Violet) color sequence, with red being the warmest water. Start with the coldestwater (lowest number) using violet. Place a key to the colors you have chosen and their matchingtemperatures in the margin. It may be easier if you first outline an area with a specific temperature andthen fill it in with color.2
PART II. GRAPHINGPlot both sea surface temperature and wind speed with time. Using the sea surface temperatures atGranite Canyon near <strong>Monterey</strong> and the wind speed and direction information from buoy 46042 in<strong>Monterey</strong> <strong>Bay</strong>, plot the following data on the graph provided.Graphing Notes:1. Notice that the scales for plotting temperature and wind speed are on opposite sides of the graph.2. Wind direction is the direction the wind is blowing from.3. Be especially careful when plotting the southerly winds.4. Negative numbers on the table indicate winds from the south.5. Use ink when plotting temperature and pencil when plotting wind speed.6. Use different marks for your plots of temperature (X) and wind speed (O). Then connect eachset of marks (all the X’s in ink and all of the O’s in pencil) to make two lines on the graph.PART III. AN ANALYSIS OF UPWELLING USING YOUR MAP AND GRAPH.Answer these questions using your map of the sea surface temperatures of the <strong>Monterey</strong> <strong>Bay</strong> areaand your graph of water temperature and winds.1. Referring to your graph:a. Describe the wind direction and speed during the periods of coldest water (maximum upwelling).b. Describe the wind direction and speed during the periods of warmest water (minimumupwelling).2. Referring to your map:a. Describe the location and shape of the area of cold surface water (9 o - 11 o ) off of Point AñoNuevo.b. Explain why some of the cold upwelled water moves westward.c. Explain why some of the cold upwelled water moves south across the bay toward <strong>Monterey</strong>.3. Why do you think the cold upwelled water is concentrated at the Point Año Nuevo and Point Surlocations?4. Why is the Santa Cruz beach area so much warmer than the rest of the bay?5. Besides following water temperature, what other measurable items could you use to follow thetwo paths of the upwelling water?6. Get together with two other students (__________ & ___________) and have each personexplain upwelling to the two others. After all three of you have explained the idea twice, take acouple of minutes and write an explanation for upwelling that a 10 year old could read andunderstand.7. FishingSardines. John Steinbeck wrote about the sardine canneries in <strong>Monterey</strong> in his book CanneryRow. The book describes the fishermen that netted these small plankton-eating fish by thehundreds of tons yearly until they were almost fished out. If they were still plentiful, how wouldwind direction influence your choice of days to take your boat and crew out sardine fishing?(Take into account the growth rate of plankton.)3
Sea Surface Temperature & WindDate (1989) Sea Surface WindTemperature (°C) Direction Speed (m/sec)1413.51312.51211.511Water 10.5 Temp (°C)109.5May 23 10 N 325 10 N 827 9 N 1029 9 N 831 9 N 4June 2 10 S -14 12 S -46 13 S -38 12 N 710 11 N 512 10 N 814 10 N 716 10 N 718 9 N 920 9 N 1122 11 N 424 12 S -426 13 S -628 13 - 030 14 S -1July 2 13 N 64 11 N 96 9 N 108 9 N 10923-May 29-May 4-Jun 10-Jun 16-Jun 22-Jun 28-Jun 4-JulDays of Study4N14121086420-2-4-6SWind (m/sec
Squid are netted as they swarm in southern <strong>Monterey</strong> <strong>Bay</strong> to reproduce. Fishermen turn onbright lights to attract and net them from midnight to six a.m. The squid prefer the water that iswarmer than average. Based on your data which nights in June 1989 would you have picked togo squid fishing?8. Tour boat operatora. Suppose you were offering bay tours to the public and wanted your patrons to see the large,plankton-eating basking sharks that visit <strong>Monterey</strong> <strong>Bay</strong>. What area would be optimal for spottingthese sharks close to Moss Landing?Lat. _____°__ & Long._____°__ Why?b. During the summer, there is often a small pod (group) of plankton-eating blue whales south of<strong>Monterey</strong>. What area would be optimal for whale watching trips departing from <strong>Monterey</strong>?Lat. _____°__ & Long. _____°__ Why?9. MBARIThe <strong>Monterey</strong> <strong>Bay</strong> Aquarium Research Institute (MBARI) has a new remotely operated vehicle(ROV) that can go down into the <strong>Monterey</strong> Submarine Canyon to a depth of 4,000 meters.During most of the trip down to the bottom the video shows “marine snow” (tiny particles ofdecaying organisms, feces, and plankton) gently drifting to the bottom. Some of this materialwill be recycled by upwelling. If you sent MBARI’s ROV down at 37.0° N, 122.5° W, duringwhich days in June 1989 would you have expected maximum marine snow? Why? Rememberto consider what the marine snow is composed of, that it drifts down slowly and the growth rateof plankton.10. Power Plant at Moss Landinga. There is a large gas burning electrical power plant at Moss Landing that releases warm water,used for cooling its turbines, into <strong>Monterey</strong> <strong>Bay</strong>. Does this warm water show up on the satellitemap? Why?b. Would you expect to find this warm water near the surface or on the bottom? Why?Steve Clark, <strong>Monterey</strong> Academy of Oceanographic Science (MAOS)This activity is based on information that was compiled and evaluated by Leslie Rosenfeld and hercolleagues from <strong>Monterey</strong> <strong>Bay</strong> Aquarium Research Institute (MBARI) in Moss Landing, CA.Reference:Bifurcated flow from an upwelling center: a cold water source for <strong>Monterey</strong> <strong>Bay</strong>, Rosenfeld et al.,Continental Shelf Research Vol. 14, No. 9.Reviewed By:High School Classroom Teachers: John Whisler, Dale Kerrigan & Tom Dooner,Oceanographers: Tom Murphree (Naval Postgraduate School), Judith Connor (MBARI) & LeslieRosenfeld (Naval Postgraduate School).SOURCE<strong>Monterey</strong> Academy of Oceanographic Science.5