YS05S16 DC-DC Converter Data Sheet - Power-One
YS05S16 DC-DC Converter Data Sheet - Power-One
YS05S16 DC-DC Converter Data Sheet - Power-One

You also want an ePaper? Increase the reach of your titles
YUMPU automatically turns print PDFs into web optimized ePapers that Google loves.
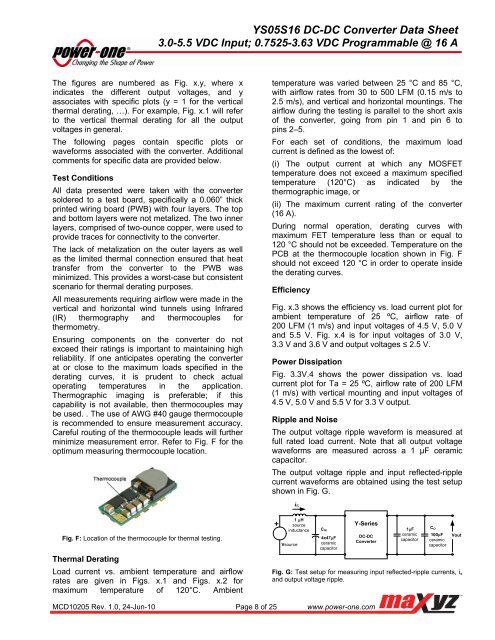
<strong>YS05S16</strong> <strong>DC</strong>-<strong>DC</strong> <strong>Converter</strong> <strong>Data</strong> <strong>Sheet</strong>3.0-5.5 V<strong>DC</strong> Input; 0.7525-3.63 V<strong>DC</strong> Programmable @ 16 AThe figures are numbered as Fig. x.y, where xindicates the different output voltages, and yassociates with specific plots (y = 1 for the verticalthermal derating, …). For example, Fig. x.1 will referto the vertical thermal derating for all the outputvoltages in general.The following pages contain specific plots orwaveforms associated with the converter. Additionalcomments for specific data are provided below.Test ConditionsAll data presented were taken with the convertersoldered to a test board, specifically a 0.060” thickprinted wiring board (PWB) with four layers. The topand bottom layers were not metalized. The two innerlayers, comprised of two-ounce copper, were used toprovide traces for connectivity to the converter.The lack of metalization on the outer layers as wellas the limited thermal connection ensured that heattransfer from the converter to the PWB wasminimized. This provides a worst-case but consistentscenario for thermal derating purposes.All measurements requiring airflow were made in thevertical and horizontal wind tunnels using Infrared(IR) thermography and thermocouples forthermometry.Ensuring components on the converter do notexceed their ratings is important to maintaining highreliability. If one anticipates operating the converterat or close to the maximum loads specified in thederating curves, it is prudent to check actualoperating temperatures in the application.Thermographic imaging is preferable; if thiscapability is not available, then thermocouples maybe used. . The use of AWG #40 gauge thermocoupleis recommended to ensure measurement accuracy.Careful routing of the thermocouple leads will furtherminimize measurement error. Refer to Fig. F for theoptimum measuring thermocouple location.temperature was varied between 25 °C and 85 °C,with airflow rates from 30 to 500 LFM (0.15 m/s to2.5 m/s), and vertical and horizontal mountings. Theairflow during the testing is parallel to the short axisof the converter, going from pin 1 and pin 6 topins 2–5.For each set of conditions, the maximum loadcurrent is defined as the lowest of:(i) The output current at which any MOSFETtemperature does not exceed a maximum specifiedtemperature (120°C) as indicated by thethermographic image, or(ii) The maximum current rating of the converter(16 A).During normal operation, derating curves withmaximum FET temperature less than or equal to120 °C should not be exceeded. Temperature on thePCB at the thermocouple location shown in Fig. Fshould not exceed 120 °C in order to operate insidethe derating curves.EfficiencyFig. x.3 shows the efficiency vs. load current plot forambient temperature of 25 ºC, airflow rate of200 LFM (1 m/s) and input voltages of 4.5 V, 5.0 Vand 5.5 V. Fig. x.4 is for input voltages of 3.0 V,3.3 V and 3.6 V and output voltages ≤ 2.5 V.<strong>Power</strong> DissipationFig. 3.3V.4 shows the power dissipation vs. loadcurrent plot for Ta = 25 ºC, airflow rate of 200 LFM(1 m/s) with vertical mounting and input voltages of4.5 V, 5.0 V and 5.5 V for 3.3 V output.Ripple and NoiseThe output voltage ripple waveform is measured atfull rated load current. Note that all output voltagewaveforms are measured across a 1 μF ceramiccapacitor.The output voltage ripple and input reflected-ripplecurrent waveforms are obtained using the test setupshown in Fig. G.i SFig. F: Location of the thermocouple for thermal testing.Thermal DeratingLoad current vs. ambient temperature and airflowrates are given in Figs. x.1 and Figs. x.2 formaximum temperature of 120°C. Ambient1 HsourceinductanceVsourceCIN4x47FceramiccapacitorY-Series<strong>DC</strong>-<strong>DC</strong><strong>Converter</strong>1FceramiccapacitorCO100FceramiccapacitorVoutFig. G: Test setup for measuring input reflected-ripple currents, i sand output voltage ripple.MCD10205 Rev. 1.0, 24-Jun-10 Page 8 of 25 www.power-one.com