- Page 1 and 2: Fightingthe Diseasesof PovertyEdite
- Page 4 and 5: Fighting the Diseases of PovertyEdi
- Page 6: ContentsIntroductionPhilip Stevens1
- Page 9 and 10: viiiFighting the Diseases of Povert
- Page 12 and 13: IntroductionBy Philip StevensIn man
- Page 14 and 15: IntroductionxiiiThis period saw an
- Page 16 and 17: IntroductionxvSimilarly, lowering t
- Page 18 and 19: Introductionxviiincomes (Kenny, 200
- Page 20 and 21: Introductionxixrising overall level
- Page 22 and 23: IntroductionxxiCorruption in health
- Page 24 and 25: IntroductionxxiiiRights, Innovation
- Page 26 and 27: Introductionxxv“Anecdotal evidenc
- Page 28 and 29: Introductionxxviionly account for 0
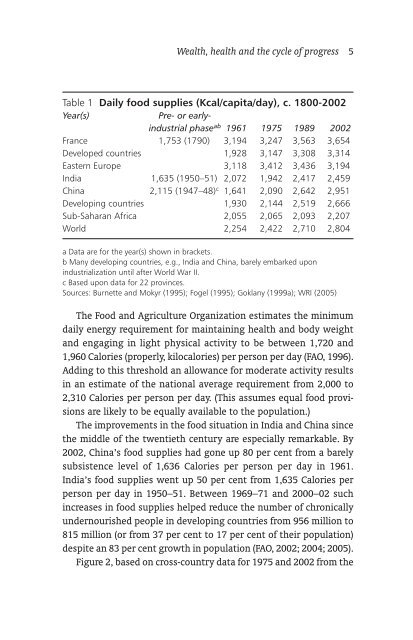
- Page 30 and 31: 1 Wealth, health and thecycle of pr
- Page 32 and 33: Wealth, health and the cycle of pro
- Page 36 and 37: Wealth, health and the cycle of pro
- Page 38 and 39: Wealth, health and the cycle of pro
- Page 40 and 41: Wealth, health and the cycle of pro
- Page 42 and 43: Wealth, health and the cycle of pro
- Page 44 and 45: Wealth, health and the cycle of pro
- Page 46 and 47: Wealth, health and the cycle of pro
- Page 48 and 49: Wealth, health and the cycle of pro
- Page 50 and 51: Wealth, health and the cycle of pro
- Page 52 and 53: Wealth, health and the cycle of pro
- Page 54 and 55: Wealth, health and the cycle of pro
- Page 56 and 57: IndiaWealth, health and the cycle o
- Page 58 and 59: Wealth, health and the cycle of pro
- Page 60 and 61: Wealth, health and the cycle of pro
- Page 62 and 63: Wealth, health and the cycle of pro
- Page 64 and 65: Wealth, health and the cycle of pro
- Page 66 and 67: South Africa’s healthcare under t
- Page 68 and 69: South Africa’s healthcare under t
- Page 70 and 71: South Africa’s healthcare under t
- Page 72 and 73: South Africa’s healthcare under t
- Page 74 and 75: South Africa’s healthcare under t
- Page 76 and 77: South Africa’s healthcare under t
- Page 78 and 79: South Africa’s healthcare under t
- Page 80 and 81: South Africa’s healthcare under t
- Page 82 and 83: South Africa’s healthcare under t
- Page 84 and 85:
South Africa’s healthcare under t
- Page 86 and 87:
South Africa’s healthcare under t
- Page 88 and 89:
South Africa’s healthcare under t
- Page 90 and 91:
South Africa’s healthcare under t
- Page 92 and 93:
3 Corruption in publichealthMaureen
- Page 94 and 95:
Corruption in public health 65Healt
- Page 96 and 97:
Corruption in public health 67where
- Page 98 and 99:
Corruption in public health 69◆
- Page 100 and 101:
Corruption in public health 71healt
- Page 102 and 103:
Corruption in public health 73Figur
- Page 104 and 105:
Corruption in public health 75Table
- Page 106 and 107:
Corruption in public health 77Table
- Page 108 and 109:
Corruption in public health 79level
- Page 110 and 111:
Corruption in public health 81Figur
- Page 112 and 113:
Corruption in public health 83Figur
- Page 114 and 115:
Corruption in public health 85physi
- Page 116 and 117:
Corruption in public health 87Focus
- Page 118 and 119:
Corruption in public health 89by un
- Page 120 and 121:
Corruption in public health 91local
- Page 122 and 123:
Corruption in public health 93suppl
- Page 124 and 125:
Corruption in public health 95The l
- Page 126 and 127:
Corruption in public health 97physi
- Page 128 and 129:
Corruption in public health 99Figur
- Page 130 and 131:
Corruption in public health 101Figu
- Page 132 and 133:
Corruption in public health 103serv
- Page 134 and 135:
Corruption in public health 105abou
- Page 136 and 137:
Corruption in public health 107prob
- Page 138 and 139:
Corruption in public health 109ment
- Page 140 and 141:
Corruption in public health 111some
- Page 142 and 143:
Corruption in public health 113grou
- Page 144 and 145:
Corruption in public health 1152001
- Page 146 and 147:
Corruption in public health 117The
- Page 148 and 149:
Corruption in public health 119and
- Page 150 and 151:
Corruption in public health 121expe
- Page 152 and 153:
Corruption in public health 123inco
- Page 154 and 155:
Corruption in public health 125Ghan
- Page 156 and 157:
Diseases of poverty and the 10/90 g
- Page 158 and 159:
Diseases of poverty and the 10/90 g
- Page 160 and 161:
Diseases of poverty and the 10/90 g
- Page 162 and 163:
Diseases of poverty and the 10/90 g
- Page 164 and 165:
Diseases of poverty and the 10/90 g
- Page 166 and 167:
Diseases of poverty and the 10/90 g
- Page 168 and 169:
Diseases of poverty and the 10/90 g
- Page 170 and 171:
5 Increasing access tomedicinesProf
- Page 172 and 173:
Increasing access to medicines 143b
- Page 174 and 175:
Increasing access to medicines 145w
- Page 176 and 177:
Increasing access to medicines 147T
- Page 178 and 179:
Increasing access to medicines 149T
- Page 180 and 181:
Increasing access to medicines 151b
- Page 182 and 183:
Increasing access to medicines 153W
- Page 184 and 185:
Increasing access to medicines 1552
- Page 186 and 187:
Increasing access to medicines 157h
- Page 188 and 189:
Increasing access to medicines 159c
- Page 190 and 191:
Increasing access to medicines 161b
- Page 192 and 193:
Increasing access to medicines 163a
- Page 194 and 195:
Increasing access to medicines 165f
- Page 196 and 197:
Increasing access to medicines 167s
- Page 198 and 199:
Increasing access to medicines 169w
- Page 200 and 201:
Increasing access to medicines 171l
- Page 202 and 203:
Increasing access to medicines 173c
- Page 204 and 205:
Increasing access to medicines 175E
- Page 206 and 207:
Increasing access to medicines 177t
- Page 208 and 209:
Increasing access to medicines 179F
- Page 210 and 211:
Increasing access to medicines 181F
- Page 212:
Increasing access to medicines 183F
- Page 215 and 216:
186 Fighting the Diseases of Povert
- Page 217 and 218:
188 Fighting the Diseases of Povert
- Page 219 and 220:
190 Fighting the Diseases of Povert
- Page 221 and 222:
192 Fighting the Diseases of Povert
- Page 223 and 224:
194 Fighting the Diseases of Povert
- Page 225 and 226:
196 Fighting the Diseases of Povert
- Page 227 and 228:
198 Fighting the Diseases of Povert
- Page 229 and 230:
200 Fighting the Diseases of Povert
- Page 231 and 232:
202 Fighting the Diseases of Povert
- Page 233 and 234:
204 Fighting the Diseases of Povert
- Page 235 and 236:
206 Fighting the Diseases of Povert
- Page 237 and 238:
208 Fighting the Diseases of Povert
- Page 239 and 240:
210 Fighting the Diseases of Povert
- Page 241 and 242:
212 Fighting the Diseases of Povert
- Page 243 and 244:
8 The value of vaccinationDavid E.
- Page 245 and 246:
216 Fighting the Diseases of Povert
- Page 247 and 248:
218 Fighting the Diseases of Povert
- Page 249 and 250:
220 Fighting the Diseases of Povert
- Page 251 and 252:
222 Fighting the Diseases of Povert
- Page 253 and 254:
224 Fighting the Diseases of Povert
- Page 255 and 256:
226 Fighting the Diseases of Povert
- Page 257 and 258:
228 Fighting the Diseases of Povert
- Page 259 and 260:
230 Fighting the Diseases of Povert
- Page 261 and 262:
232 Fighting the Diseases of Povert
- Page 263 and 264:
234 Fighting the Diseases of Povert
- Page 265 and 266:
236 Fighting the Diseases of Povert
- Page 267 and 268:
238 Fighting the Diseases of Povert
- Page 269 and 270:
240 Fighting the Diseases of Povert
- Page 271 and 272:
242 Fighting the Diseases of Povert
- Page 273 and 274:
244 Fighting the Diseases of Povert
- Page 275 and 276:
246 Fighting the Diseases of Povert
- Page 277 and 278:
248 Fighting the Diseases of Povert
- Page 279 and 280:
250 Fighting the Diseases of Povert
- Page 281 and 282:
252 Fighting the Diseases of Povert
- Page 283 and 284:
254 Fighting the Diseases of Povert
- Page 285 and 286:
256 Fighting the Diseases of Povert
- Page 287 and 288:
258 Fighting the Diseases of Povert
- Page 289 and 290:
260 Fighting the Diseases of Povert
- Page 291 and 292:
262 Fighting the Diseases of Povert
- Page 293 and 294:
264 Fighting the Diseases of Povert
- Page 295 and 296:
266 Fighting the Diseases of Povert
- Page 297 and 298:
268 Fighting the Diseases of Povert
- Page 299 and 300:
270 Fighting the Diseases of Povert
- Page 301 and 302:
272 Fighting the Diseases of Povert
- Page 303 and 304:
274 Fighting the Diseases of Povert
- Page 305 and 306:
SourcesIntroductionAdelman, C., Nor
- Page 307 and 308:
278 Fighting the Diseases of Povert
- Page 309 and 310:
280 Fighting the Diseases of Povert
- Page 311 and 312:
282 Fighting the Diseases of Povert
- Page 313 and 314:
284 Fighting the Diseases of Povert
- Page 315 and 316:
286 Fighting the Diseases of Povert
- Page 317 and 318:
288 Fighting the Diseases of Povert
- Page 319 and 320:
290 Fighting the Diseases of Povert
- Page 321 and 322:
292 Fighting the Diseases of Povert
- Page 323 and 324:
294 Fighting the Diseases of Povert
- Page 325 and 326:
296 Fighting the Diseases of Povert
- Page 327 and 328:
298 Fighting the Diseases of Povert
- Page 329 and 330:
healthcare industry. He writes and
- Page 331:
Fighting theDiseases of PovertyHow