The ABCS Program for the Analysis of Echo Sounder Returns for ...
The ABCS Program for the Analysis of Echo Sounder Returns for ...
The ABCS Program for the Analysis of Echo Sounder Returns for ...
You also want an ePaper? Increase the reach of your titles
YUMPU automatically turns print PDFs into web optimized ePapers that Google loves.
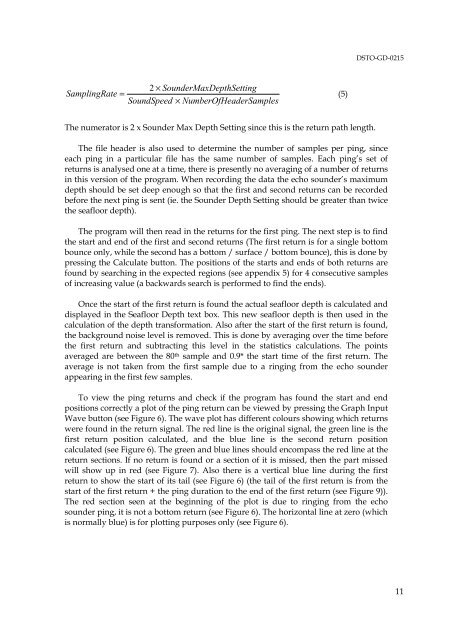
DSTO-GD-0215SamplingRate =2 × <strong>Sounder</strong>MaxDepthSettingSoundSpeed × NumberOfHeaderSamples(5)<strong>The</strong> numerator is 2 x <strong>Sounder</strong> Max Depth Setting since this is <strong>the</strong> return path length.<strong>The</strong> file header is also used to determine <strong>the</strong> number <strong>of</strong> samples per ping, sinceeach ping in a particular file has <strong>the</strong> same number <strong>of</strong> samples. Each ping’s set <strong>of</strong>returns is analysed one at a time, <strong>the</strong>re is presently no averaging <strong>of</strong> a number <strong>of</strong> returnsin this version <strong>of</strong> <strong>the</strong> program. When recording <strong>the</strong> data <strong>the</strong> echo sounder’s maximumdepth should be set deep enough so that <strong>the</strong> first and second returns can be recordedbe<strong>for</strong>e <strong>the</strong> next ping is sent (ie. <strong>the</strong> <strong>Sounder</strong> Depth Setting should be greater than twice<strong>the</strong> seafloor depth).<strong>The</strong> program will <strong>the</strong>n read in <strong>the</strong> returns <strong>for</strong> <strong>the</strong> first ping. <strong>The</strong> next step is to find<strong>the</strong> start and end <strong>of</strong> <strong>the</strong> first and second returns (<strong>The</strong> first return is <strong>for</strong> a single bottombounce only, while <strong>the</strong> second has a bottom / surface / bottom bounce), this is done bypressing <strong>the</strong> Calculate button. <strong>The</strong> positions <strong>of</strong> <strong>the</strong> starts and ends <strong>of</strong> both returns arefound by searching in <strong>the</strong> expected regions (see appendix 5) <strong>for</strong> 4 consecutive samples<strong>of</strong> increasing value (a backwards search is per<strong>for</strong>med to find <strong>the</strong> ends).Once <strong>the</strong> start <strong>of</strong> <strong>the</strong> first return is found <strong>the</strong> actual seafloor depth is calculated anddisplayed in <strong>the</strong> Seafloor Depth text box. This new seafloor depth is <strong>the</strong>n used in <strong>the</strong>calculation <strong>of</strong> <strong>the</strong> depth trans<strong>for</strong>mation. Also after <strong>the</strong> start <strong>of</strong> <strong>the</strong> first return is found,<strong>the</strong> background noise level is removed. This is done by averaging over <strong>the</strong> time be<strong>for</strong>e<strong>the</strong> first return and subtracting this level in <strong>the</strong> statistics calculations. <strong>The</strong> pointsaveraged are between <strong>the</strong> 80 th sample and 0.9* <strong>the</strong> start time <strong>of</strong> <strong>the</strong> first return. <strong>The</strong>average is not taken from <strong>the</strong> first sample due to a ringing from <strong>the</strong> echo sounderappearing in <strong>the</strong> first few samples.To view <strong>the</strong> ping returns and check if <strong>the</strong> program has found <strong>the</strong> start and endpositions correctly a plot <strong>of</strong> <strong>the</strong> ping return can be viewed by pressing <strong>the</strong> Graph InputWave button (see Figure 6). <strong>The</strong> wave plot has different colours showing which returnswere found in <strong>the</strong> return signal. <strong>The</strong> red line is <strong>the</strong> original signal, <strong>the</strong> green line is <strong>the</strong>first return position calculated, and <strong>the</strong> blue line is <strong>the</strong> second return positioncalculated (see Figure 6). <strong>The</strong> green and blue lines should encompass <strong>the</strong> red line at <strong>the</strong>return sections. If no return is found or a section <strong>of</strong> it is missed, <strong>the</strong>n <strong>the</strong> part missedwill show up in red (see Figure 7). Also <strong>the</strong>re is a vertical blue line during <strong>the</strong> firstreturn to show <strong>the</strong> start <strong>of</strong> its tail (see Figure 6) (<strong>the</strong> tail <strong>of</strong> <strong>the</strong> first return is from <strong>the</strong>start <strong>of</strong> <strong>the</strong> first return + <strong>the</strong> ping duration to <strong>the</strong> end <strong>of</strong> <strong>the</strong> first return (see Figure 9)).<strong>The</strong> red section seen at <strong>the</strong> beginning <strong>of</strong> <strong>the</strong> plot is due to ringing from <strong>the</strong> echosounder ping, it is not a bottom return (see Figure 6). <strong>The</strong> horizontal line at zero (whichis normally blue) is <strong>for</strong> plotting purposes only (see Figure 6).11


