Interventional 4-D C-Arm CT Perfusion Imaging Using Interleaved ...
Interventional 4-D C-Arm CT Perfusion Imaging Using Interleaved ...
Interventional 4-D C-Arm CT Perfusion Imaging Using Interleaved ...

Create successful ePaper yourself
Turn your PDF publications into a flip-book with our unique Google optimized e-Paper software.
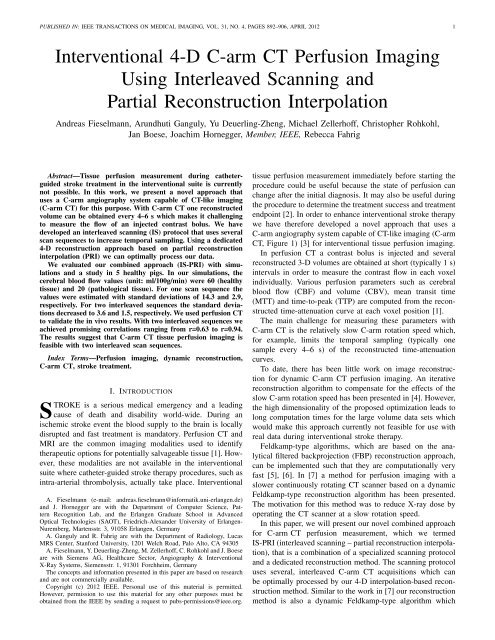
PUBLISHED IN: IEEE TRANSA<strong>CT</strong>IONS ON MEDICAL IMAGING, VOL. 31, NO. 4, PAGES 892–906, APRIL 2012 1<strong>Interventional</strong> 4-D C-arm <strong>CT</strong> <strong>Perfusion</strong> <strong>Imaging</strong><strong>Using</strong> <strong>Interleaved</strong> Scanning andPartial Reconstruction InterpolationAndreas Fieselmann, Arundhuti Ganguly, Yu Deuerling-Zheng, Michael Zellerhoff, Christopher Rohkohl,Jan Boese, Joachim Hornegger, Member, IEEE, Rebecca FahrigAbstract—Tissue perfusion measurement during catheterguidedstroke treatment in the interventional suite is currentlynot possible. In this work, we present a novel approach thatuses a C-arm angiography system capable of <strong>CT</strong>-like imaging(C-arm <strong>CT</strong>) for this purpose. With C-arm <strong>CT</strong> one reconstructedvolume can be obtained every 4–6 s which makes it challengingto measure the flow of an injected contrast bolus. We havedeveloped an interleaved scanning (IS) protocol that uses severalscan sequences to increase temporal sampling. <strong>Using</strong> a dedicated4-D reconstruction approach based on partial reconstructioninterpolation (PRI) we can optimally process our data.We evaluated our combined approach (IS-PRI) with simulationsand a study in 5 healthy pigs. In our simulations, thecerebral blood flow values (unit: ml/100g/min) were 60 (healthytissue) and 20 (pathological tissue). For one scan sequence thevalues were estimated with standard deviations of 14.3 and 2.9,respectively. For two interleaved sequences the standard deviationsdecreased to 3.6 and 1.5, respectively. We used perfusion <strong>CT</strong>to validate the in vivo results. With two interleaved sequences weachieved promising correlations ranging from r=0.63 to r=0.94.The results suggest that C-arm <strong>CT</strong> tissue perfusion imaging isfeasible with two interleaved scan sequences.Index Terms—<strong>Perfusion</strong> imaging, dynamic reconstruction,C-arm <strong>CT</strong>, stroke treatment.I. INTRODU<strong>CT</strong>IONSTROKE is a serious medical emergency and a leadingcause of death and disability world-wide. During anischemic stroke event the blood supply to the brain is locallydisrupted and fast treatment is mandatory. <strong>Perfusion</strong> <strong>CT</strong> andMRI are the common imaging modalities used to identifytherapeutic options for potentially salvageable tissue [1]. However,these modalities are not available in the interventionalsuite where catheter-guided stroke therapy procedures, such asintra-arterial thrombolysis, actually take place. <strong>Interventional</strong>A. Fieselmann (e-mail: andreas.fieselmann@informatik.uni-erlangen.de)and J. Hornegger are with the Department of Computer Science, PatternRecognition Lab, and the Erlangen Graduate School in AdvancedOptical Technologies (SAOT), Friedrich-Alexander University of Erlangen-Nuremberg, Martensstr. 3, 91058 Erlangen, GermanyA. Ganguly and R. Fahrig are with the Department of Radiology, LucasMRS Center, Stanford University, 1201 Welch Road, Palo Alto, CA 94305A. Fieselmann, Y. Deuerling-Zheng, M. Zellerhoff, C. Rohkohl and J. Boeseare with Siemens AG, Healthcare Sector, Angiography & <strong>Interventional</strong>X-Ray Systems, Siemensstr. 1, 91301 Forchheim, GermanyThe concepts and information presented in this paper are based on researchand are not commercially available.Copyright (c) 2012 IEEE. Personal use of this material is permitted.However, permission to use this material for any other purposes must beobtained from the IEEE by sending a request to pubs-permissions@ieee.org.tissue perfusion measurement immediately before starting theprocedure could be useful because the state of perfusion canchange after the initial diagnosis. It may also be useful duringthe procedure to determine the treatment success and treatmentendpoint [2]. In order to enhance interventional stroke therapywe have therefore developed a novel approach that uses aC-arm angiography system capable of <strong>CT</strong>-like imaging (C-arm<strong>CT</strong>, Figure 1) [3] for interventional tissue perfusion imaging.In perfusion <strong>CT</strong> a contrast bolus is injected and severalreconstructed 3-D volumes are obtained at short (typically 1 s)intervals in order to measure the contrast flow in each voxelindividually. Various perfusion parameters such as cerebralblood flow (CBF) and volume (CBV), mean transit time(MTT) and time-to-peak (TTP) are computed from the reconstructedtime-attenuation curve at each voxel position [1].The main challenge for measuring these parameters withC-arm <strong>CT</strong> is the relatively slow C-arm rotation speed which,for example, limits the temporal sampling (typically onesample every 4–6 s) of the reconstructed time-attenuationcurves.To date, there has been little work on image reconstructionfor dynamic C-arm <strong>CT</strong> perfusion imaging. An iterativereconstruction algorithm to compensate for the effects of theslow C-arm rotation speed has been presented in [4]. However,the high dimensionality of the proposed optimization leads tolong computation times for the large volume data sets whichwould make this approach currently not feasible for use withreal data during interventional stroke therapy.Feldkamp-type algorithms, which are based on the analyticalfiltered backprojection (FBP) reconstruction approach,can be implemented such that they are computationally veryfast [5], [6]. In [7] a method for perfusion imaging with aslower continuously rotating <strong>CT</strong> scanner based on a dynamicFeldkamp-type reconstruction algorithm has been presented.The motivation for this method was to reduce X-ray dose byoperating the <strong>CT</strong> scanner at a slow rotation speed.In this paper, we will present our novel combined approachfor C-arm <strong>CT</strong> perfusion measurement, which we termedIS-PRI (interleaved scanning – partial reconstruction interpolation),that is a combination of a specialized scanning protocoland a dedicated reconstruction method. The scanning protocoluses several, interleaved C-arm <strong>CT</strong> acquisitions which canbe optimally processed by our 4-D interpolation-based reconstructionmethod. Similar to the work in [7] our reconstructionmethod is also a dynamic Feldkamp-type algorithm which
PUBLISHED IN: IEEE TRANSA<strong>CT</strong>IONS ON MEDICAL IMAGING, VOL. 31, NO. 4, PAGES 892–906, APRIL 2012 2makes it computationally fast.This paper is an extension of previous work [8]. Comparedto [8], we described our methods in more detail, performednew numerical simulations and validated our methods moreextensively using in vivo data. Results based on our methodswere also recently presented in [9] with a focus on theirclinically relevant aspects. The focus of this paper is now toprovide a detailed technical description and investigation ofthese methods.Our paper is organized as follows: In Section II, we willexplain the technical challenges in C-arm <strong>CT</strong> perfusion imagingand give a detailed description of our methods. We willinvestigate these methods using simulated data in Section IIIand validate its feasibility with real data using an in vivo studyin a healthy pig model in Section IV. Potential future developmentsbased on new C-arm <strong>CT</strong> systems or reconstructionapproaches are outlined in Section V. In Section VI, we willgive a summary and conclusion.Fig. 1. C-arm angiography system (Artis zee ceiling-mounted system,Siemens AG, Healthcare Sector, Forchheim, Germany) capable of <strong>CT</strong>-likeimaging in the interventional suite.II. SPECIALIZED SCANNING PROTOCOL ANDRECONSTRU<strong>CT</strong>ION METHODIn this section, we will first explain the technical challengesthat have been identified in order to implement <strong>CT</strong>perfusion-likeimaging with a C-arm <strong>CT</strong>. Then, two approacheswill be presented, a specialized scanning protocoland an interpolation-based 4-D reconstruction method, whichare the technical solutions that we have developed.A. Challenges in C-arm-<strong>CT</strong>-Based <strong>Perfusion</strong> <strong>Imaging</strong>1) Low Temporal Sampling: We will start with a descriptionof 4-D imaging with a C-arm <strong>CT</strong>. In order to obtainN rot reconstructed 3-D volumes the C-arm has to be rotatedN rot times, each time through approximately 200 ◦ , in a bidirectionalmanner. Note, current C-arm <strong>CT</strong> systems are notcapable of continuous, uni-directional C-arm rotations. Duringeach rotation 2-D projection data is acquired. The time periodfor one rotation (typically 3–5 s) will be denoted T rot . Ashort waiting time T w (typically 1 s) is required between tworotations. The middle plot in Figure 2(a) shows the viewangleλ(t) ∈ [0, Λ] of such a multi-rotational scan sequenceplotted against time t. A multi-rotational scan sequence is usedin cardiac C-arm <strong>CT</strong> with retrospective electrocardiogram(ECG)-gating, for example [10].In perfusion <strong>CT</strong> the sample period is typically 1 s but itmay be increased to up to 3 s and similar diagnostic quality ofthe computed perfusion parameter maps may still be provided[11], [12]. However, in perfusion imaging with a C-arm <strong>CT</strong>the temporal sample period, given by T rot +T w , obtained withsuch a 4-D scan protocol, is typically longer than 3 s and maynot be sufficient for adequate sampling of the reconstructedtime-attenuation curve. In particular, arterial time-attenuationcurves, which are used for normalization of the perfusionvalues [13], have relatively fast contrast dynamics and maybe undersampled [12].2) Inconsistent Projection Data: The acquired projectiondata is inconsistent due to the (intentional) time-varying contrastconcentration in the region of interest during one C-armrotation. We will describe two kinds of FBP reconstructionartifacts that can occur. In order to explain these artifactswe will consider one single point object with time-varyingattenuation values that we approximate by a discrete voxel.Note, due to the linearity of the FBP our explanations canbe easily generalized to an arbitrary number of voxels withtime-varying attenuation values.First, the reconstructed time-attenuation curve measuredat this voxel position is not a sampled version of the truetime-attenuation curve. In fact, the relatively long acquisitionprocess leads to a low-pass filtering of the true curve. Byinvestigation of the FBP algorithm it can be shown that thisprocess can be approximated by a convolution of the true curvewith a rectangular function of temporal width T rot before it issampled [7]. Due to the low-pass filtering the peak value ofa reconstructed time-attenuation curve will be underestimatedeven if the sample time point, i.e. the central time of the C-armrotation, coincides with the time of the peak value of the curve.Second, streak artifact in the reconstructed 3-D volumescan appear around the voxel with time-varying attenuationvalues. A detailed description of this kind of artifact is givenin [14]. An example from a numerical simulation is shown inFigure 8(a). The magnitude of this kind of artifact dependson the slope of the time-attenuation curve during the C-armrotation. Therefore, this artifact will be most prominent aroundarterial vessels in which the attenuation values change rapidlyand thus have a high slope.B. <strong>Interleaved</strong> Scanning (IS)In order to improve the low temporal sampling (see SectionII-A1) we propose an interleaved scanning protocol withN seq different multi-rotational sequences. Each of the N seqmulti-rotational sequences consists of N rot C-arm rotations,each of which provides a full set of projection data. In total
PUBLISHED IN: IEEE TRANSA<strong>CT</strong>IONS ON MEDICAL IMAGING, VOL. 31, NO. 4, PAGES 892–906, APRIL 2012 3(a) One scan sequence (N seq = 1) (b) Two interleaved scan sequences (N seq = 2)Fig. 2. The left figure shows the case with one scanning sequence whereas the right figure shows the principle of interleaved scanning where two scansequences have different delay times τ 1 and τ 2 relative to the time of injection. Top row: The timing of the injections, the scan sequences, and the additionalbaseline scan (BS; only relevant for interleaved scanning) is shown on an absolute time scale. Middle row: During each scan sequence the X-ray source ofthe C-arm <strong>CT</strong> system rotates in a bi-directional manner; the scan sequences are shown on a relative time scale after the time of injection. Bottom row: Onevolume is reconstructed from the data of each rotation and for each voxel a time series can be measured.(a) One scan sequence (N seq = 1) (b) Two interleaved scan sequences (N seq = 2)Fig. 3. Partial reconstruction interpolation with M = 4 angular interpolation intervals to create a reconstructed volume at t = t est. In the right figure thedata from two interleaved scans is actually combined to yield better interpolation results.
PUBLISHED IN: IEEE TRANSA<strong>CT</strong>IONS ON MEDICAL IMAGING, VOL. 31, NO. 4, PAGES 892–906, APRIL 2012 5is a bi-linear interpolation of the pre-processed (e.g., rampfiltered)projection p l,k (u,v).Illustrations for these partial backprojections are shown inFigure 3(a). An important property of the PFBP operator is thata normal reconstruction of the value µ rec (x,k) at x during thek-th C-arm rotation, here assuming a time-independent object,is given by the sum of all partial filtered backprojections, i.e.µ rec (x,k) =M−1∑j=0PFBP (j+1)L−1jL(x){P k } , (6)where L = N views /M and M is the number of angularinterpolation intervals. In general, the number L of viewanglesper partial backprojection could also be non-uniformand angular windowing functions could be applied. Note, ourpartial reconstruction interpolation approach is generic and canalso be based on reconstruction algorithms other than the FDKalgorithm as long as these algorithms fulfill the condition in(6).We can now apply the interpolation to the partial backprojectionsin order to reconstruct a value ˜µ rec (x,t est ) correspondingto the time point t est :˜µ rec (x,t est ) =M−1∑j=0N∑rot−1k=0PFBP (j+1)L−1jL(x){P k }× ϕ (j+0.5)L,k(test −t (j+0.5)L,k). (7)Next we will describe the use of this approach with datafrom an interleaved scanning protocol, i.e. N rot ≥ 2. In orderto optimize the accuracy of the interpolation we will combinethe data from different multi-rotational sequences. Mathematically,we change the summation endpoint of the inner sum in(7) from N rot − 1 to N rot × N seq − 1 and interpret k as anindex that can refer to C-arm rotations from different multirotationalsequences. This combined interleaved scanning (IS)and partial reconstruction interpolation (PRI) approach is alsoillustrated in Figure 3(b). The combination of both methods(IS-PRI) increases the temporal sampling density and can yieldbetter approximations for consistent projection data sets.In the IS-PRI approach we assume the change of contrastconcentration in an projection interval of length L to benegligible and the contrast-induced temporal enhancementfunction to be sufficiently smooth between two data timepoints in order to obtain accurate interpolation results.As already mentioned in Section II-B, the Hounsfield valuesof the reconstructed n-th (n = 0,...,N seq −1) scan sequenceare influenced by residual contrast from the preceding n bolusinjections. Therefore, the data of each scan sequence (n ≥ 1)having N rot C-arm rotations is pre-processed in order toremove the attenuation values due to the residual contrast.Before each scan sequence (n ≥ 1) a new baseline scan isacquired (Figure 2(b)(top)) and reconstructed to provide Mpartial backprojection baseline images. Then this baseline datais subtracted, individually for each of the M intervals, fromthe partial backprojection data of the following N rot rotations.Finally the baseline acquired at the start of the 0-th scansequence is again added to this partial backprojection dataindividually for each of the M intervals.TABLE ISCAN PARAMETERS FOR THE NUMERICAL SIMULATIONS AND THE IN VIVOSTUDY.parameter set 1 parameter set 2(simulations) (in vivo study)view-angle increment 0.5 ◦ 1 ◦number of views per rotation 401 191angular range per rotation (Λ) 200 ◦ 190 ◦time per rotation (T rot) 4.30 s 4.30 stime between rotations (T w) 1.25 s 1.25 snumber of rotations (N rot) 9 6total scanning time 48.7 s 32.05 ssource-to-isocenter distance 800 mm 785 mmsource-to-detector distance 1200 mm 1198 mmdetector pixel size 0.6×0.6 mm 2 0.616×0.616 mm 2number of detector pixels 800×1 616×480(no binning) (after 4×4 binning)total detector size 480×0.6 mm 2 ≈ 380×296 mm 2This procedure adds N seq −1 additional baseline scans, i.e.one for each interleaved sequence, to the overall number ofscans. The additional baseline scans could actually be part ofthe multi-rotational sequence or acquired separately before thatsequence. The latter may be prefered if the number of scans ina multi-rotional sequence is limited by hardware constraints,for example, in order to avoid temporal truncation of the timeattenuationcurves.D. Interpolation of Non-Uniformly Sampled DataDue to the alternating directions of C-arm rotations theprojection data is sampled using non-uniform time intervals.This has to be considered when choosing suitable interpolationfunctions ϕ l,k in (7). There are various interpolation methodsfor non-uniformly sampled data and we will provide anoverview of 5 different methods.Nearest neighbor (NN) and linear (LIN) interpolation arerobust against noisy data and they preserve the monotonicityof the data that is being interpolated. I.e. the interpolatedvalues between two adjacent sample points are either strictlyincreasing or strictly decreasing. Cubic spline (CS) interpolationgenerates smooth curves which can be non-monotonicbut it can lead to unintended overshoots or undershoots wheninterpolating noisy data [17]. Another class of interpolationmethods are piecewise cubic Hermite interpolating polynomials(HIP) [18]. They also preserve the monotonicity of thedata but they generate smoother curves when compared tolinear interpolation. Radial basis function (RBF) interpolationcomputes an interpolated value by using a distance-dependentweighting of the known sample values [19]. For example, in[10] a Gaussian function has been used as weighting function.III. NUMERICAL SIMULATIONSNumerical simulations were performed to investigate theproperties of the acquisition and reconstruction scheme describedin Section II.
PUBLISHED IN: IEEE TRANSA<strong>CT</strong>IONS ON MEDICAL IMAGING, VOL. 31, NO. 4, PAGES 892–906, APRIL 2012 6arterial enhancement [µ w]0.500.250.02∆µ (t) art∆µ tis,h(t)∆µ (t) tis,p00 5 10 15 20 25 30t [s]0 5 10 15 20 25 30 0 0.01tissue enhancement [µ w]η = 1 but, as will be explained in more detail later, we variedthese values to obtain several different curves.The maximum dynamic enhancement A above the staticbaseline value was chosen differently for each set in orderto model different injection methods. In the first set an intravenousbolus injection into the antecubital vein with A =0.3µ w (µ w = 0.18cm −1 is the X-ray attenuation of water)was assumed which is typical for diagnostic <strong>CT</strong> perfusionimaging [21]. In the second set A = 0.5µ w was chosen inorder to model an injection at the aortic arch as it was carriedout in the in vivo studies, see Section IV for details.In each set the time-attenuation curves ∆µ tis (t) in tissuewere computed using the indicator-dilution theory [13], [20],∫ t∆µ tis (t) = ρ CBF ∆µ art (τ)r(t−τ)dτ (9)0{1, for t < T0r(t) = ( )exp −(t−T0)(10)MTT−T 0, for t ≥ T 0 ,with ρ = 1.04g/ml. We set T 0 = 0.632×MTT as suggestedin [22]. According to the central volume theorem [13] MTTcan be computed asMTT = CBV/CBF . (11)Fig. 4. Top: Synthetic time-attenuation curves, here without noise, correspondingto a large artery (∆µ art(t), left scale), to healthy, normallyperfusedtissue (∆µ tis,h (t), right scale) and to pathological, hypoperfusedtissue (∆µ tis,p (t), right scale) assuming a contrast injection at the aortic arch.The plots show the dynamic enhancement (above the static baseline value)relative to the attenuation µ w of water. Note, the arterial peak enhancementis more than 25 times higher than the peak enhancement in tissue. Bottom:Locations of the artery and the tissue regions in the dynamic head phantom.A. Phantom DescriptionWe generated two sets of time-attenuation curves representingtwo different contrast injection methods (intra-venous/ aortic arch injection). An intra-venous injection is commonlyused in diagnostic perfusion <strong>CT</strong> imaging. An injectionat the aortic arch is feasible in interventional C-arm <strong>CT</strong>perfusion imaging since patients will be undergoing arterialcatheterization for their endovascular therapy [9]. Advantagesof the aortic arch injection method are further discussed inSection III-E.Each set contained three different time-attenuation curvesto model the flow of contrast agent through a large artery,a region of normally-perfused tissue and a region of hypoperfusedtissue. In each set the arterial enhancement ∆µ art (t)was modeled using the following gamma-variate function [14],[20]:∆µ art (t) =A(αβ exp(−1)) α τα exp(−τ/β)H(τ) . (8)Here, H(τ) is the unit step function, and α = 3.0 and β = 1.5are shape parameters that were also suggested in [20]. Thedimensionless quantity τ = (t−t 0 )/η depends on the bolusarrival time t 0 and the time scaling factor η which are bothmeasured in s. The factor η controls the full width at halfmaximum of the curve. The initial values were t 0 = 0 andWe chose CBF = 60ml/100g/min and CBV = 4ml/100gto generate a time-attenuation curve ∆µ tis,h (t) for healthy,normally-perfused tissue and chose CBF = 20ml/100g/minand CBV = 4ml/100g to generate a time-attenuation curve∆µ tis,p (t) for pathological, hypoperfused tissue. A plot of allthree time-attenuation curves for the case of the aortic archinjection is shown in Figure 4. Note, the peak enhancement intissue depends linearly on the arterial peak enhancement A —see (8) and (9) — and for the simulated intra-venous injectionit is about 0.011µ w (healthy tissue) and 0.006µ w (pathologicaltissue) which are typical values for the peak enhancementin gray matter in diagnostic perfusion <strong>CT</strong> imaging [21].For each set of time-attenuation curves a dynamic Shepp-Logan-type head phantom µ pha (x,t) was created that contained3 circular regions of interest (ROI) with varying attenuationvalues, see Figure 4. The first ROI (radius 1 mm) modeledan artery with attenuation values µ w +∆µ art (t). The secondand third ROIs (radius 2 mm each) modeled tissue regionswith attenuation values µ w +∆µ tis,h (t) and µ w +∆µ tis,p (t),respectively.The constant attenuation values of the elliptical skull (outerradii 62 mm and 92 mm) and the brain tissue were 2µ wand µ w , respectively. We have chosen the constant attenuationvalues of the two inner ellipses to be 0.95µ w . In order toimprove the reproducibility of our results, a more detaileddescription of this phantom along with relevant source codeis available online [23].B. InvestigationsThe following procedures were applied to each phantomconfiguration (intra-venous / aortic arch injection) individually.We simulated C-arm <strong>CT</strong> scanning of the 2-D phantom with alinear detector array using the scan parameters from set 1 in
PUBLISHED IN: IEEE TRANSA<strong>CT</strong>IONS ON MEDICAL IMAGING, VOL. 31, NO. 4, PAGES 892–906, APRIL 2012 7CBF [ml/100g/min]8075706560555045N seqCBV [ml/100g]5.554.543.53N seqMTT [s]6.565.554.543.532.5N seq40NN LIN HIP CS RBF2.5NN LIN HIP CS RBF2NN LIN HIP CS RBF(a) CBF, healthy tissue (GT: 60 ml/100g/min)(b) CBV, healthy tissue (GT: 4 ml/100g)(c) MTT, healthy tissue (GT: 4 s)3230N seq5.55N seq1312N seqCBF [ml/100g/min]28262422CBV [ml/100g]4.543.5MTT [s]111098203718NN LIN HIP CS RBF(d) CBF, pathological tissue (GT: 20 ml/100g/min)2.5NN LIN HIP CS RBF(e) CBV, pathological tissue (GT: 4 ml/100g)6NN LIN HIP CS RBF(f) MTT, pathological tissue (GT: 12 s)TTP [s]9.598.587.576.565.5N seqNN LIN HIP CS RBF(g) TTP, healthy tissue (GT: 6.9 s)TTP [s]13.5N seq1312.51211.51110.5109.59NN LIN HIP CS RBF(h) TTP, pathological tissue (GT: 10.8 s)Fig. 5. Simulation with noisy, synthetic data corresponding to (a–c, g) healthy and (d–f, h) pathological tissue. The graphs show mean and standard deviationof different measures with known ground truth (GT, dashed line) for different interpolation methods (abbreviations explained in Section II-D) and numbersN seq ∈ {1,2,3,4} of interleaved sequences. The different colors of the bars correspond to values from N seq = 1 (dark) to N seq = 4 (bright). Note, theCBF, MTT, and TTP plots have different scalings of the ordinate for the cases of healthy and pathological tissue.Table I. Poisson-distributed noise was added to the projectionvalues of µ pha (x,t) assuming an emitted X-ray flux density of2.1×10 6 photons per mm 2 at the source-to-detector distanceas in [4].Different numbers N seq ∈ {1,2,3,4} of scan sequences anddifferent numbers M = {1,2,3,4,5,6,12,18} of angular interpolationintervals were used. We applied the 5 interpolationfunctions from Section II-D and set the interpolation time stepto 0.5 s. These 160 different combinations of IS-PRI parameterswere used to simulate scanning of the phantom µ pha (x,t).For each instance the scanning was repeated 10 times eachtime having a different noise realization and different valuesfor t 0 and η. These values were uniformly distributed in theintervals t 0 ∈ [0, (T rot + T w )[ and η ∈ [0.85, 1.15], respectively.This was done in order to take into account variationsdue to different, relative shifts between start of the scanningand the bolus arrival and also variations due to different shapesof the curves. The thickness of the reconstructed slices was9.6 mm which is a typical value for neuro perfusion <strong>CT</strong> data.The reconstruction of thick slices was realized by averaging16 noisy projections, i.e. the slice thickness divided by thedetector pixel size, for each view-angle. The in-plane voxelspacing was 0.2 mm.In order to analyze the reconstructed data we have focusedon the following two aspects. First, we investigated the accuracyof measured perfusion values (CBF, CBV, MTT, TTP) forthe healthy and pathological tissue. Second, we investigatedthe reconstruction artifacts due to inconsistent data around thesimulated artery, cf. Section II-A2.The perfusion parameters CBF, CBV and MTT were computedusing a standard deconvolution-based perfusion analysisbased on the truncated SVD algorithm with a fixed threshold
PUBLISHED IN: IEEE TRANSA<strong>CT</strong>IONS ON MEDICAL IMAGING, VOL. 31, NO. 4, PAGES 892–906, APRIL 2012 8(a) M = 1 (b) M = 3 (c) M = 6 (d) M = 18(e) M = 1 (f) M = 3 (g) M = 6 (h) M = 18Fig. 8. Reconstruction of a simulated arterial vessel with time-varyingattenuation values from (a–d) noisy and (e–h) noise-free input data usingN seq = 3 interleaved sequences. M is the number of angular interpolationintervals. The windowing is from –10 HU (black) to +10 HU (white).value of 20% of the maximum singular value as described in[13]. In this algorithm the arterial time curve µ art (t) and thetissue time curve µ tis are deconvolved and the peak value andthe integral of this deconvolved function give the CBF and theCBV, respectively, whereas MTT is the ratio of both, cf. (11).TTP was determined directly from the tissue time curves.We quantified the reconstruction artifact around the arteryby measuring the average absolute deviation from the groundtruth value in an annular region around the artery. Thefollowing expression defines the pixel positions x i (i =0,...,N i −1) that lie within this annular region:r 2 art ≤ x 2 i +y 2 i ≤ (3r art ) 2 . (12)We set the outer radius to 3r art after initial evaluation ofdifferent radii in order to have the majority of the artifactwithin the annulus ring. The measure χ art of the meanreconstruction artifact for a given time point t est is definedasχ art (t est ) = 1 N∑i−1N ii=0|˜µ rec (x i ,t est )−µ pha (x i ,t est )| . (13)C. Results: Simulated Aortic Arch InjectionFigure 5 shows the mean and standard deviation of thecomputed perfusion parameters CBF, CBV, MTT, and TTPfrom reconstructions with a constant number M = 6 of angularinterpolation intervals and different interpolation methods.Results with different numbers M will be discussed later.According to the central volume theorem, see (11), only twoof the three parameters CBF, CBV and MTT are independent;however, we present the results of all of these parameters fora more comprehensive evaluation.Generally, the standard deviation of the computed parametervalues, which is a measure for the variability, decreases whenthe number N seq of interleaved sequences increases. Especiallythe standard deviation of CBF, MTT, and TTP (healthytissue) decreases significantly when N seq is increased from 1to 2. For example, with linear interpolation the standard deviationof CBF in healthy tissue decreases from 14.3 ml/100g/minto 3.6 ml/100g/min when two interleaved sequences instead ofone sequence are used. For pathological tissue these values are2.9 ml/100g/min and 1.5 ml/100g/min.The mean TTP values get closer to the ground truth valuefor increasing N seq and the mean CBF and mean CBV valuestend to get overestimated, especially for pathological tissue.The mean MTT values show different trends for increasingN seq for the cases of healthy (they are closer to the groundtruth) and pathological tissue (they tend to get underestimated).Figure 6 shows the CBF, CBV, MTT, and TTP of thesimulated pathological tissue as a function of different numberM of interpolation intervals when using linear interpolation.For N seq ∈ {3,4} the mean of the estimations of CBV, MTT,and TTP varies with increasing M values while the CBFestimation is nearly unaffected by differentM values. It can beobserved that the results with M ∈ {12,18} are similar to theresults with M = 6. Generally, the estimation of the perfusionparameters does not improve significantly when increasing Mfor neither the pathological tissue (Figure 6) nor for the healthytissue (data omitted for brevity).Results for the reconstruction artifact around the simulatedartery are shown in Figure 7. Figure 7(c) shows χ art (t) fordifferent time points t when using the linear interpolationmethod. If N seq > 1 then the value of χ art (t) decreasesfor M = 6 when compared to M = 1. For comparisonof different interpolation methods, in Figure 7(a)–(b) themean and standard deviation is plotted for a reconstructiontime point during the arterial outflow phase (t est = 9s, seeFigure 4). The value of χ art (9s) from a reconstruction withoutany simulated contrast flow is indicated with a dashed line, thisvalue is purely due to the noise in the projection images andthus also the reconstructed images, cf. definition of χ art in(13).As a visual example Figure 8 shows reconstructions ofthe simulated arterial vessel at the time point t est = 9s fordifferent numbers M, here with an in-plane voxel spacing of0.1 mm. Additionally, also the results obtained from noise-freeinput data are presented in this figure.D. Results: Simulated Intra-venous InjectionThe results based on the simulated intra-venous injectionshow similar trends — when changing N seq , for example — asthe results corresponding to the simulated aortic arch injection(Section III-C). However, when comparing the two injectionmethods the intra-venous injection provides worse results thanthe aortic arch injection.For brevity we only show the results of the intra-venousinjection for one relevant case. With linear interpolation thestandard deviation of CBF in healthy tissue decreases from15.0 ml/100g/min to 12.1 ml/100g/min when two interleavedsequences instead of one sequence are used. For pathologicaltissue these values are 3.7 ml/100g/min and 3.1 ml/100g/min.E. DiscussionThe results indicate that when using an aortic arch injectionthe perfusion parameters can be estimated more reliably whencompared to an intra-venous injection. This can be attributed
PUBLISHED IN: IEEE TRANSA<strong>CT</strong>IONS ON MEDICAL IMAGING, VOL. 31, NO. 4, PAGES 892–906, APRIL 2012 93230M5.55MCBF [ml/100g/min]28262422CBV [ml/100g]4.543.520318N seq=1 N seq=2 N seq=3 N seq=42.5N seq=1 N seq=2 N seq=3 N seq=4(a) cerebral blood flow (GT: 20 ml/100g/min)(b) cerebral blood volume (GT: 12 ml/100g)MTT [s]131211109MTTP [s]13.51312.51211.511M8710.5109.56N seq=1 N seq=2 N seq=3 N seq=49N seq=1 N seq=2 N seq=3 N seq=4(c) mean transit time (GT: 12 s)(d) time-to-peak (GT: 10.8 s)Fig. 6. Simulation with noisy, synthetic data: Mean and standard deviation of estimated CBF, CBV, MTT, and TTP with known ground truth (GT, dashedline) depending on different number N seq of interleaved sequences and different numbers M ∈ {1,2,3,4,5,6,12,18} of angular interpolation intervals (thebars are ordered in increasing numbers of M) investigated using pathological tissue and applying linear interpolation as interpolation method.to the higher peak enhancement in the artery and the tissueregions and thus an improved contrast-to-noise ratio of thereconstructed C-arm <strong>CT</strong> volumes.There are also further advantages of the aortic arch injectionmethod. The interleaved scanning with multiple contrast bolusinjections is based on the assumption that similar contrast flowpatterns can be generated in the patient’s brain for each bolusinjection. With contrast bolus injections at the aortic arch thebolus travel time to the brain is very short which can improvethe reproducibility of the contrast flow pattern.Furthermore, the fraction of contrast that actually reachesthe brain is increased compared to an intra-venous contrastbolus injection. Thus, the necessary total amount of contrastcan be reduced. However, a potential disadvantage of theaortic arch injection may be unsymmetrical filling of thearteries with contrast. A symmetrical filling is necessary forcomparison of perfusion between the cerebral hemispheres.With an optimized catheter position a symmetrical filling maybe achieved but further evaluations are necessary [24].When using interleaved scanning for perfusion C-arm <strong>CT</strong>imaging the aortic arch injection method has distinct advantagesand we have also used this method in our in vivo studies.In our following discussion we therefore focus on the resultsobtained with the aortic arch injection method.The results show that perfusion parameters can be measuredwith less variability, i.e. lower standard deviation, whenseveral (N seq > 1) interleaved sequences are used. A fewexceptions exist that could be explained due to the specificsampling pattern, see (1), and the shape of the syntheticcurves which could be optimal for specific values of N seq .The mean value estimation of the perfusion parameters isnot generally improved with an increased number N seq ofinterleaved sequences.In brain perfusion imaging the relative comparison of perfusionvalues in the healthy and diseased hemispheres is moresignificant than absolute perfusion values [1]. Therefore, thevariability of the measurements is a more important aspectthan the mean values.The relatively higher overestimation of the CBF mean valuesfor the pathological tissue when compared to the healthytissue can be attributed to the properties of the perfusionimage analysis algorithm. We applied the truncated SVDalgorithm that is frequently used for this purpose and is alsoimplemented in different perfusion analysis software packages[25]. However, this algorithm is known to underestimatehigher CBF values [20], [26] which explains the decreasein overestimation for the higher CBF values seen in healthytissue. The additional CBF value offset (for pathological tissueit is typically 4 ml/100g/min) can be attributed to the imageacquisition and reconstruction scheme. The arterial input functionis characterized by fast contrast agent dynamics and it maybe underestimated. Since it is used to normalized the perfusiondata the CBF values are overestimated [13].A reliable differentiation of pathological and healthy tissueis possible based on the results of the computed perfusionvalues (Figure 5). When using N seq = 2 and linear interpo-
PUBLISHED IN: IEEE TRANSA<strong>CT</strong>IONS ON MEDICAL IMAGING, VOL. 31, NO. 4, PAGES 892–906, APRIL 2012 10χ art(9 s) [µ w]0.0120.0100.0080.0060.004N seqχ art(9 s) [µ w]0.0120.0100.0080.0060.004N seqχ art(t) [µ w]0.0100.0090.0080.0070.0060.005M=1, N =1 seqM=1, N =2 seqM=1, N =3 seqM=6, N seq=1M=6, N =2 seqM=6, N seq=30.0020NN LIN HIP CS RBF(a) M = 1, N seq = 3, fixed time: t = 9s0.0020NN LIN HIP CS RBF(b) M = 6, N seq = 3, fixed time: t = 9s0.0040.0030 2 4 6 8 10 12 14t [s](c) χ art(t) as a function of time, LIN interpolationFig. 7. Simulation with noisy, synthetic data: (a–b) Mean and standard deviation of the reconstruction artifact χ art(t) around the simulated arterial vessel attime point t = 9s for different numbers N seq ∈ {1,2,3,4} of interleaved sequences (the bars are ordered in increasing numbers of N seq) and interpolationmethods (abbreviations explained in Section II-D). µ w is the X-ray attenuation of water. (c) Plot of χ art(t) computed with linear interpolation (LIN) as afunction of time. The dashed lines indicate the value for the component of χ art that is purely due to noise. Optimal results should be close to the value ofthis dashed line.lation, for example, the computed CBF range — here definedas mean value ± 1.96 times the standard deviation — is 53.5–67.7 ml/100g/min for healthy and 21.7–27.6 ml/100g/min forpathological tissue.For N seq ≥ 2 the performance of the different interpolationmethods is comparable. Linear and nearest neighborinterpolation may be favored in practice because they can beimplemented such that they are computationally very fast. Ofthese two methods, linear interpolation shows slightly betterresults (e.g., lower variability of CBF, CBV, MTT, and TTPmeasurements for N seq = 2). With two interleaved sequencesthe variability for the measured perfusion parameters mayalready be low enough for application in brain perfusionimaging.For N seq > 1, the variability of the parameters CBF, CBV,and MTT does not decrease for increasing M. This effect canbe explained by the deconvolution-based perfusion analysis.If M = 1 then the reconstructed time curves have beenlow-pass filtered before sampling and interpolation. The lowpassfiltering can be approximated by a convolution with arectangular function of temporal width T rot , see Section II-A2.Note, both the arterial and the tissue curves are low-passfiltered with a similar filter kernel. Mathematically, the deconvolutionoperation of two functions is invariant to a precedingconvolution of each function with the same filter kernel.We note that other measures of the tissue time curves whichdo not depend on the normalization with the arterial timecurve, such as peak value, can improve for increasing M ashas been shown in [8]. However, the investigation of clinicallyrelevant parameters such as CBF is more significant.The major advantage of using M > 1 can be seen inFigures 7 and 8. When using the PRI approach it is possible toapproximate a consistent data set of projection values and toreduce the reconstruction artifacts due to data inconsistencies.It can be seen that for t = 9s, for example, the artifactis reduced almost completely if N seq ≥ 2. This can beexplained by the linear slope of the arterial time-attenuationcurve at this time point which enables accurate estimation ofthe unknown data by means of linear interpolation. Choosinghigher numbers M of angular interpolation intervals thanM = 6 does not significantly improve the results, althoughsmall changes can be seen in the noise-free data of Figure 8.Therefore, we suggest setting M to 6 in order to reduce thecomputational complexity.IV. IN VIVO STUDYIn order to show the clinical feasibility of our novel IS-PRIapproach and to validate it under realistic conditions we haveconducted an in vivo brain perfusion study with 5 healthy pigswhere we used perfusion <strong>CT</strong> as reference for the validation.A. Material and MethodsThe following procedure was performed under institutionalreview board approval for each of the 5 perfusion-normal pigs(mean weight 54±4.7kg). The pig was sedated and placed ona respirator. A 5-French diffusion catheter (Vanguard, MedradInc, Idianola, PA, USA) was placed at the root of the aorticarch under fluoroscopic guidance. During the study we injectediodinated contrast agent (Omnipaque, 350 mg iodine/ml, Nycomed,Princeton, NJ, USA) diluted with an equal amountof saline using a programmable dual head power injector(Accutron HP-D, Medtron AG, Saarbrücken, Germany). <strong>Using</strong>this injector, delay times could be programmed with 0.1 sprecision. We injected each bolus at a rate of 6 ml/s for 8 s,resulting in 24 ml of pure contrast agent per injection.We acquired N seq = 6 interleaved sequences with a clinicalC-arm <strong>CT</strong> system (Axiom Artis dTA with syngo Dyna<strong>CT</strong>,Siemens AG, Healthcare Sector, Forchheim, Germany) usingthe C-arm <strong>CT</strong> scan parameters from set 2 of Table I. Retrospectively,we created 3 additional subsets of sequences withN seq = 1 (1 st sequence of the superset), N seq = 2 (1 st and4 th sequence of the superset) and N seq = 3 (1 st , 3 rd and5 th sequence of the superset). The size of each reconstructedvolume was 256 × 256 × 256 isotropic voxels with a voxelside length of 0.5 mm and the interpolation sampling intervalwas 1 s. Based on our experience from the simulations we setthe number M of interpolation intervals to 6 and we used thelinear interpolation method.
PUBLISHED IN: IEEE TRANSA<strong>CT</strong>IONS ON MEDICAL IMAGING, VOL. 31, NO. 4, PAGES 892–906, APRIL 2012 11For validation we acquired a perfusion <strong>CT</strong> (first 2 animals:Somatom Sensation 64, Siemens AG, Healthcare Sector,Erlangen, Germany; last 3 animals: LightSpeed 16, GEHealthcare, Milwaukee, WI, USA) for each of the 5 animalswith the same injection parameters as for the C-arm <strong>CT</strong>scans. Baseline images were acquired and subtracted from thefollowing images to measure the enhancement due to contrastflow. The measured enhancement is used for the data analysisand it is actually independent of residual contrast that mayoriginate from the previous perfusion C-arm <strong>CT</strong> exam. Thedata from the perfusion <strong>CT</strong> exam was reconstructed with apixel size of 0.39 × 0.39 mm 2 , a slice thickness of 9.6–10.0 mm and a temporal sampling interval of 0.5–1.0 s. Forthe C-arm <strong>CT</strong> data we created reconstructions with similarslice thicknesses by applying a moving average filter (kernelsize 9.5–10.0 mm) perpendicular to the orientation of thereconstructed slices.After reconstruction of the 4-D C-arm <strong>CT</strong> data set weevaluated qualitatively the time-attenuation curves in an arterialand a venous vessel and in a tissue region. We carriedout a quantitative evaluation using the computed perfusionparameter maps.For this evaluation we first registered the 3-D C-arm <strong>CT</strong>perfusion maps onto the 2-D perfusion maps (2-3 slices peranimal) obtained with <strong>CT</strong>. We have used a rectangular gridwith a line spacing of 10 pixels to subdivide the whole brainarea into square ROIs. For each ROI the mean perfusion values(CBF, CBV, MTT) were computed using our in-house softwarebased on the truncated SVD algorithm [13].The linear correlation r between the perfusion <strong>CT</strong> mapand the (registered) perfusion C-arm <strong>CT</strong> map was determinedby using the data from all ROIs. In order to decrease theinfluence of large vessels we additionally applied a vascularpixel elimination (VPE) similar to the method described in[27]. If the mean CBV value from perfusion <strong>CT</strong> in a certainsquare ROI was above the threshold value of 8 ml/100g (thisvalue was suggested in [27] for human data and we assumed italso applies to the data from our in vivo pig studies because ofthe similarities of the human brain and the pig brain [28], [29])then the data from this ROI was not used for the correlationanalysis.An alternative evaluation method would be to manuallyselect ROIs in different gray and white matter regions as donein [9]. The evaluation conducted in this work does not requiremanual selection of ROIs and is therefore user-independent.B. ResultsFigure 9 shows the locations of the arterial and venous vesselsand the tissue regions that were selected for investigationof the time-attenuation curves. The time-attenuation curvesfrom one animal are shown in Figure 10. With increasing N seqthe full width at half maximum of the reconstructed curvesdecreases and gets closer to the value from the reference <strong>CT</strong>.The curves obtained with IS-PRI are generally smoother thanthe curves from <strong>CT</strong>. The smoothest curves are obtained withN seq = 1. These qualitative findings also hold for the resultsof the other 4 animals of our study.Fig. 9. Coronal C-arm <strong>CT</strong> image of a pig head that shows the locationsof the extra-cranial arterial (A) and intra-cranial venous (V) vessels and thetissue (T) region that were selected for plotting of the time-attenuation curvesshown in Figure 10. The windowing range is from –75 HU to +375 HU.A representative 3-D CBF data set of one animal is givenin Figure 11 by displaying 3 orthogonal planes through thevolume. No severe asymmetry can be seen in the transversaland coronal planes as would be expected from a healthyanimal. Figure 12 shows a comparison of the CBF maps ofone animal obtained with perfusion <strong>CT</strong> and with perfusionC-arm <strong>CT</strong> using IS-PRI (N seq = 2, M = 6).Table II shows the linear correlation coefficients r betweenperfusion <strong>CT</strong> and perfusion C-arm <strong>CT</strong> parameters for theresults with and without VPE. For brevity, we have omitted thedetailed results for MTT. The mean correlations for MTT weregenerally lower (r = 0.12 with VPE, r = 0.35 without VPEfor N seq = 2) but also showed an increase for increasing N seq(r = 0.31 with VPE, r = 0.51 without VPE for N seq = 3).C. DiscussionThe results from Figure 10 show that the time-attenuationcurves measured with the IS-PRI approach are comparable tothose measured with <strong>CT</strong>. The smoothness of the curves withIS-PRI could be explained by the potential undersampling,especially at low numbers N seq , and the interpolation, both ofwhich act as a low-pass filtering.Compared to conventional multi-slice perfusion <strong>CT</strong> it ispossible to measure volumetric perfusion with our IS-PRI approach,cf. Figure 11. A detailed discussion of the advantagesof volumetric perfusion measurement for stroke diagnosis isprovided in [30].The mean correlation of the computed C-arm <strong>CT</strong> perfusionvalues with perfusion <strong>CT</strong> increases for increasing N seqregardless of whether vascular pixels are kept or eliminated.While the mean correlation is highest when vascular pixelsare included in the analysis, it is also very high if the vascularpixels are removed. 1 In that case the improvement when using1 It has been observed that when removing the vascular pixels from thestatistical analysis the decrease of the covariance between the measured <strong>CT</strong>and C-arm <strong>CT</strong> values is relatively stronger than the decrease of the product oftheir standard deviations. This explains the decrease of the linear correlationcoefficient — which is the ratio of these two quantities — when VPE isapplied.
PUBLISHED IN: IEEE TRANSA<strong>CT</strong>IONS ON MEDICAL IMAGING, VOL. 31, NO. 4, PAGES 892–906, APRIL 2012 12attenuation [HU]40035030025020015010050N =1 seqN seq=2N seq=3N =6 seqP<strong>CT</strong>attenuation [HU]20151050−5N =1 seqN seq=2N seq=3N =6 seqP<strong>CT</strong>attenuation [HU]40035030025020015010050N =1 seqN seq=2N seq=3N =6 seqP<strong>CT</strong>0−1000 5 10 15 20 25 30 35time [s]0 5 10 15 20 25 30 35time [s]0 5 10 15 20 25 30 35time [s](a) artery(b) tissue(c) veinFig. 10. Reconstructed time-attenuation curves obtained from one pig in our in vivo studies using different numbers N seq ∈ {1,2,3,4} of interleavedsequences and M = 6 angular interpolation intervals. The data from a perfusion <strong>CT</strong> (P<strong>CT</strong>) exam is given as reference. For each curve the first sample pointvalue was subtracted to allow for better comparison.(a) coronal (b) sagittal (c) transversalFig. 11. 3-D CBF data (unit: ml/100g/min) of a perfusion-normal pig computed from 4-D data acquired using the IS-PRI approach. The color bar appliesto all three images.808080707070606060505050404040303030202020101010000(a) P<strong>CT</strong>, slice 1(b) P<strong>CT</strong>, slice 2(c) P<strong>CT</strong>, slice 3808080707070606060505050404040303030202020101010000(d) IS-PRI, slice 1(e) IS-PRI, slice 2(f) IS-PRI, slice 3Fig. 12. CBF maps (units: ml/100g/min) of a perfusion-normal pig obtained with (a–c) perfusion <strong>CT</strong> (P<strong>CT</strong>) and (d–f) perfusion C-arm <strong>CT</strong> using the IS-PRIapproach. The 3-D volume CBF data from IS-PRI was registered onto the 2-D maps from perfusion <strong>CT</strong>.
PUBLISHED IN: IEEE TRANSA<strong>CT</strong>IONS ON MEDICAL IMAGING, VOL. 31, NO. 4, PAGES 892–906, APRIL 2012 13TABLE IICORRELATION r BETWEEN PERFUSION PARAMETERS THAT WERE MEASURED WITH <strong>CT</strong> AND C-ARM <strong>CT</strong> IN 5 HEALTHY PIGS (LABELED FROM A TO E).VPE: VASCULAR PIXEL ELIMINATION, SD: STANDARD DEVIATION.N seq A B C D E mean±SDCBF [ml/100g/min], w/o VPE 1 0.97 0.92 0.91 0.87 0.95 0.92±0.04CBF [ml/100g/min], w/ VPE 1 0.79 0.80 0.58 0.54 0.62 0.67±0.12CBV [ml/100g], w/o VPE 1 0.98 0.96 0.92 0.87 0.96 0.94±0.05CBV [ml/100g], w/ VPE 1 0.75 0.73 0.52 0.42 0.49 0.58±0.15CBF [ml/100g/min], w/o VPE 2 0.97 0.95 0.93 0.88 0.94 0.94±0.03CBF [ml/100g/min], w/ VPE 2 0.79 0.82 0.74 0.55 0.63 0.71±0.11CBV [ml/100g], w/o VPE 2 0.98 0.96 0.93 0.89 0.96 0.94±0.04CBV [ml/100g], w/ VPE 2 0.78 0.77 0.59 0.46 0.53 0.63±0.14CBF [ml/100g/min], w/o VPE 3 0.93 0.95 0.94 0.89 0.93 0.93±0.02CBF [ml/100g/min], w/ VPE 3 0.80 0.83 0.78 0.59 0.65 0.73±0.10CBV [ml/100g], w/o VPE 3 0.98 0.96 0.94 0.91 0.95 0.95±0.03CBV [ml/100g], w/ VPE 3 0.77 0.76 0.71 0.51 0.61 0.67±0.11increasing numbers N seq is most prominent. The standarddeviation of the mean correlation decreases for increasingN seq . The evaluation with VPE may be clinically more significant,in order to evaluate tissue perfusion, than the evaluationwithout VPE. Nevertheless, the results without VPE show thecorrelation between perfusion <strong>CT</strong> and perfusion C-arm <strong>CT</strong>values on a broader range of values.We did not evaluate higher numbers M of angular interpolationintervals as the results from the simulations did not show asignificant improvement for M > 6. The simulations showedthat reconstruction artifacts could be reduced with M = 6compared to M = 1. With in vivo data these reconstructionartifacts were difficult to evaluate due to the lack of groundtruth data.In order to increase the contrast-to-noise ratio (CNR) ofthe measured tissue time-attenuation curves and to increasethe reproducibility of the contrast flow patterns we used acontrast bolus injection at the aortic arch, cf. Section III-E.Intra-venous contrast injection methods may be investigatedin future animal studies. Note, ECG-triggered contrast bolusinjections, which were not performed in this study due tohardware constraints, could reduce the influence of the cardiaccycle [15] which could further increase the reproducibility ofthe contrast flow patterns.Our study was not optimized for X-ray dose reduction.When used in clinical practice the applied dose of a protocolwith two interleaved scan sequences may be similar to theapplied dose of current volume perfusion <strong>CT</strong> protocols [31].A more detailed analysis of the clinical data focusing onclinical aspects such as different injection protocols and adifferentiation of gray and white matter was carried out in[9] where further statistical measures (Bland-Altman plots,concordance correlation coefficients) were also investigated.In [9] the correlation between perfusion <strong>CT</strong> and perfusionC-arm <strong>CT</strong> was computed using manually selected circularROIs and a linear correlation of r = 0.88 was obtainedwith two interleaved sequences. Also with the automatic, userindependentROI selection approach as carried out in this workthe correlation of CBF and CBV is very high (ranging fromr = 0.63 to r = 0.94 for N seq = 2).Our studies were based on perfusion-normal pigs. Note,there is no minimally invasive stroke model for pigs sincethe rete mirabile does not permit endovascular access tothe anterior cerebrovasculature [29]. Further studies involvinganimal stroke models or human stroke patients are necessaryfor the validation of our methods and will be carried out inthe future.V. OUTLOOK ON FUTURE DEVELOPMENTSThe IS-PRI approach presented in this paper enables, forthe first time, perfusion imaging using C-arm <strong>CT</strong> in theinterventional suite. Future research in this field may focuson further increasing the accuracy of the technique, and toreduce the amount of contrast agent and X-ray radiation thatis applied to the patient. These goals could be accomplishedby new image reconstruction algorithms or new C-arm <strong>CT</strong>system technologies. In this section, we will give an outlookon potential future developments.A. Dual-source Bi-plane SystemAs discussed in Section III-E, two interleaved sequencesmay already provide results that can be used for a reliablestroke diagnosis. However, two separate injections are requiredwhich increase the contrast agent dose and lead to a longerexamination time. The necessity for two injections could berelaxed if a bi-plane C-arm angiography system was usedwhere both planes could acquire projections simultaneouslyduring the C-arm rotation. In that case, two interleaved-typesequences could be acquired with only one contrast bolusinjection.Figure 13 shows how the PRI approach could be applied todata acquired with a bi-plane system. The two planes of thebi-plane system are mounted at an angle of Λ/2 in relationto each other. With current bi-plane systems it is not possibleto perform simultaneous data acquisition using both planes.However, if simultaneous acquisition was feasible, and if a biplanesystem was actually available in the interventional suite,the aforementioned modified PRI approach could be used asan alternative to the dual bolus approach.
PUBLISHED IN: IEEE TRANSA<strong>CT</strong>IONS ON MEDICAL IMAGING, VOL. 31, NO. 4, PAGES 892–906, APRIL 2012 14Fig. 13. Partial reconstruction interpolation applied to data acquired using abi-plane system. See Figure 3(b) for a comparison with the case for a monoplanesystem.B. Constrained Image Reconstruction TechniquesIn this section, we will discuss how different constrainedimage reconstruction techniques could further enhance the IS-PRI approach presented in this paper or even lead to new kindsof approaches.It was recently shown that 4-D vascular blood flow informationcan be obtained from projection data acquired duringa slow C-arm rotation using a C-arm <strong>CT</strong> system [32], [33].This novel technique uses a limited number of projections anda constrained image reconstruction for obtaining reconstructedvolumes corresponding to different time frames at short intervals.The vascular blood flow information alone cannot be usedto quantify tissue perfusion. However, it could be used to moreaccurately estimate the arterial input function which is neededto compute the perfusion parameters [13]. Thus, it could beused in an ideal combination with the IS-PRI approach whichcan reconstruct the flow in vessels and tissue, but providesless accuracy when reconstructing the faster flow in vessels(Section III-E; cf. [8]).Constrained image reconstruction can also be realized usingthe concepts of compressed sensing; this topic has recentlygained considerable attention in the imaging community [34].For example, prior image constrained compressed sensing(PICCS) is a technique to reconstruct time-resolved images[35]–[37]. In <strong>CT</strong> brain perfusion imaging, PICCS was investigatedin order to reconstruct images using only a fewprojections (e.g., 4–20) distributed over the full view-anglerange and thus saving X-ray dose [38]. Compared to the FBPreconstruction the results using PICCS showed significantlyfewer streaking artifacts; however, in this study no perfusionvalues were investigated. In micro-<strong>CT</strong> imaging, PICCS hasbeen used for noise reduction [39]. A decrease to 1/16 of thenoise variance of a FBP reconstruction was observed. <strong>Perfusion</strong>parameters maps were rated to have higher image qualitywhen a PICCS reconstruction instead of a FBP reconstructionwas used.A further application of PICCS is to improve temporalresolution by using limited sector reconstruction (TRI-PICCS)[37], [40]–[42]. The projections are taken from a shorter viewanglerange (e.g., 100 ◦ ) than is necessary for traditional imagereconstruction. TRI-PICCS has been investigated for cardiac<strong>CT</strong> imaging where an increase of the temporal resolution bya factor of 2–2.3 has been reported [41]. In the future, it mayeventually be possible to apply this concept also to perfusiondata acquired using a slow rotation C-arm <strong>CT</strong> system. Incontrast to the 4-D vascular blood flow approach [33] tissueperfusion information could be obtained.TRI-PICCS-based methods could potentially be applied todata acquired with an interleaved scanning protocol and bean alternative to the PRI approach. Eventually, the need forinterleaving could even be relaxed and only one contrast bolusinjection would be required. Topics for further research inthe field of TRI-PICCS may include the resolution of lowcontrastchanges due to the contrast agent flow in tissue; thisis of particular importance and has not yet been investigatedin detail. Furthermore, the computational time required by thisiterative method must be sufficiently short such that it can beused during interventional stroke treatment.VI. SUMMARY AND CONCLUSIONWe have developed a novel combined scanning and reconstructionapproach that allows for tissue perfusion measurementin the interventional suite. Emphasis was put oncomputational speed of the methods, e.g. by using a modifiedFDK-based reconstruction algorithm, so that our techniquecould be used for intra-operative imaging during stroke therapyprocedures.<strong>Using</strong> numerical simulations we have shown that with twointerleaved sequences the variability of estimated perfusionvalues is sufficiently low such that our method could be usedfor clinical decision making. These simulations were carriedout with C-arm <strong>CT</strong> scan parameters that are representativeof current systems (Table I). We expect that our results willimprove with faster C-arm rotation speeds accompanied byfaster detector readout rates and shorter waiting times betweenrotations, e.g. realized with robotic C-arm <strong>CT</strong> systems such asthe Artis zeego (Siemens AG, Healthcare Sector, Forchheim,Germany). Furthermore, with new bi-plane C-arm angiographysystems the two interleaved sequences could be acquired usinga single contrast bolus injection only.Our in vivo studies were based on a healthy pig model andthe perfusion parameter maps computed from data acquiredwith our novel IS-PRI approach showed promising correlationswith those from a reference perfusion <strong>CT</strong>. Further validationin stroke cases and human patient studies is necessary and willbe carried out in the future.In conclusion, this work is a novel and fundamental contributiontowards perfusion imaging using C-arm <strong>CT</strong> whichcould lead to optimized stroke treatment in the interventionalsuite.ACKNOWLEDGMENTThis work was supported by a research grant from SiemensAG, Healthcare Sector, Forcheim, Germany. Financial support
PUBLISHED IN: IEEE TRANSA<strong>CT</strong>IONS ON MEDICAL IMAGING, VOL. 31, NO. 4, PAGES 892–906, APRIL 2012 15was also provided through NIH 1K99EB007676 and the LucasFoundation. The authors gratefully acknowledge funding ofthe Erlangen Graduate School in Advanced Optical Technologies(SAOT) by the German Research Foundation (DFG) inthe framework of the German excellence initiative. We thankGünter Lauritsch and Michael Manhart for helpful adviceduring preparation of the manuscript and Frank Dennerleinfor providing parts of the simulation framework. The experttechnical assistance of Wendy Baumgardner, Pamela Hertz andLior Molvin is gratefully acknowledged.REFERENCES[1] R. G. González, J. A. Hirsch, W. J. Koroshetz, M. H. Lev, and P. W.Schaefer, Eds., Acute Ischemic Stroke, 1st ed. Berlin, Germany:Springer, 2006.[2] A. Fieselmann, “<strong>Interventional</strong> perfusion imaging using C-arm computedtomography: Algorithms and clinical evaluation,” Ph.D. dissertation,Friedrich-Alexander University of Erlangen-Nuremberg, Germany, 2011.[3] N. Strobel, O. Meissner, J. Boese, T. Brunner, B. Heigl, M. Hoheisel,G. Lauritsch, M. Nagel, M. Pfister, E.-P. Rührnschopf, B. Scholz,B. Schreiber, M. Spahn, M. Zellerhoff, and K. Klingenbeck-Regn,Multislice <strong>CT</strong>, 3rd ed. Berlin, Germany: Springer, 2009, ch. 3D <strong>Imaging</strong>with Flat-Detector C-<strong>Arm</strong> Systems, pp. 33–51.[4] C. Neukirchen, M. Giordano, and S. Wiesner, “An iterative method fortomographic x-ray perfusion estimation in a decomposition model-basedapproach,” Medical Physics, vol. 37, no. 12, pp. 6125–6141, 2010.[5] L. A. Feldkamp, L. C. Davis, and J. W. Kress, “Practical cone-beamalgorithm,” Journal of the Optical Society of America, vol. A1, pp. 612–619, 1984.[6] C. Rohkohl, B. Keck, H. Hofmann, and J. Hornegger, “Rabbit<strong>CT</strong>– an open platform for benchmarking 3D cone-beam reconstructionalgorithms,” Medical Physics, vol. 36, no. 9, pp. 3940–3944, 2009.[7] P. Montes and G. Lauritsch, “A temporal interpolation approach fordynamic reconstruction in perfusion <strong>CT</strong>,” Medical Physics, vol. 34,no. 7, pp. 3077–3092, 2007.[8] A. Fieselmann, A. Ganguly, Y. Deuerling-Zheng, M. Zellerhoff,J. Boese, J. Hornegger, and R. Fahrig, “A dynamic reconstructionapproach for cerebral blood flow quantification with an interventionalC-arm <strong>CT</strong>,” in Proc. IEEE International Symposium on Biomedical<strong>Imaging</strong> 2010, Rotterdam, The Netherlands, 2010, pp. 53–56.[9] A. Ganguly, A. Fieselmann, M. Marks, J. Rosenberg, J. Boese,Y. Deuerling-Zheng, M. Straka, G. Zaharchuk, R. Bammer, andR. Fahrig, “Cerebral <strong>CT</strong> perfusion using an interventional C-arm imagingsystem: Cerebral blood flow measurements,” American Journal ofNeuroradiology, vol. 32, no. 8, pp. 1525–1531, 2011.[10] G. Lauritsch, J. Boese, L. Wigström, H. Kemeth, and R. Fahrig,“Towards cardiac C-arm computed tomography,” IEEE Transactions onMedical <strong>Imaging</strong>, vol. 25, no. 7, pp. 922–934, 2006.[11] M. Wintermark, W. S. Smith, N. U. Ko, M. Quist, P. Schnyder, and W. P.Dillon, “Dynamic perfusion <strong>CT</strong>: optimizing the temporal resolution andcontrast volume for calculation of perfusion <strong>CT</strong> parameters in strokepatients.” American Journal of Neuroradiology, vol. 25, no. 5, pp. 720–729, 2004.[12] M. Wiesmann, S. Berg, G. Bohner, R. Klingebiel, V. Schöpf, B. M.Stoeckelhuber, I. Yousry, J. Linn, and U. Missler, “Dose reduction indynamic perfusion <strong>CT</strong> of the brain: effects of the scan frequency onmeasurements of cerebral blood flow, cerebral blood volume, and meantransit time.” European Radiology, vol. 18, no. 12, pp. 2967–2974, 2008.[13] A. Fieselmann, M. Kowarschik, A. Ganguly, J. Hornegger, and R. Fahrig,“Deconvolution-based <strong>CT</strong> and MR brain perfusion measurement: Theoreticalmodel revisited and practical implementation details,” InternationalJournal of Biomedical <strong>Imaging</strong>, vol. 2011, article ID 467563, 20pages, 2011.[14] A. Fieselmann, F. Dennerlein, Y. Deuerling-Zheng, J. Boese, R. Fahrig,and J. Hornegger, “A model for filtered backprojection reconstructionartifacts due to time-varying attenuation values in perfusion C-arm <strong>CT</strong>,”Physics in Medicine and Biology, vol. 56, no. 12, pp. 3701–3717, 2011.[15] C. T. Badea, S. M. Johnston, E. Subashi, Y. Qi, L. W. Hedlund, andG. A. Johnson, “Lung perfusion imaging in small animals using 4Dmicro-<strong>CT</strong> at heartbeat temporal resolution,” Medical Physics, vol. 37,no. 1, pp. 54–62, 2010.[16] M. D. Silver, “A method for including redundant data in computedtomography,” Medical Physics, vol. 27, no. 4, pp. 773–774, 2000.[17] W. H. Press, S. A. Teukolsky, W. T. Vetterling, and B. P. Flannery,Numerical Recipes, 3rd ed. Cambridge, UK: Cambridge UniversityPress, 2007.[18] F. N. Fritsch and R. E. Carlson, “Monotone piecewise cubic interpolation,”SIAM Journal on Numerical Analysis, vol. 17, pp. 238–246, 1980.[19] M. D. Buhmann, Radial Basis Functions: Theory and Implementations,1st ed. Cambridge, UK: Cambridge University Press, 2003.[20] L. Østergaard, R. M. Weisskoff, D. A. Chesler, C. Gyldensted, andB. R. Rosen, “High resolution measurement of cerebral blood flow usingintravascular tracer bolus passages. part I: Mathematical approach andstatistical analysis,” Magnetic Resonance in Medicine, vol. 36, no. 5,pp. 715–725, 1996.[21] H. M. Silvennoinen, L. M. Hamberg, L. Valanne, and G. J. Hunter,“Increasing contrast agent concentration improves enhancement in firstpass<strong>CT</strong> perfusion,” American Journal of Neuroradiology, vol. 28, no. 7,pp. 1299–1303, 2007.[22] J. Bredno, M. E. Olszewski, and M. Wintermark, “Simulation model forcontrast agent dynamics in brain perfusion scans,” Magnetic Resonancein Medicine, vol. 6, no. 1, pp. 280–290, 2010.[23] A. Fieselmann, “DIPPO — a digital brain perfusion phantom,”www5.cs.fau.de/~fieselma/data/, accessed December 20, 2011.[24] A. Fieselmann, A. Ganguly, Y. Deuerling-Zheng, J. Boese, J. Hornegger,and R. Fahrig, “Automatic measurement of contrast bolus distributionin carotid arteries using a C-arm angiography system to support interventionalperfusion imaging,” in Proc. SPIE Medical <strong>Imaging</strong> 2011:Visualization, Image-Guided Procedures, and Modeling, vol. 7964, LakeBuena Vista, USA, 2011, pp. 79 641W1–6.[25] K. Kudo, M. Sasaki, K. Yamada, S. Momoshima, H. Utsunomiya,H. Shirato, and K. Ogasawara, “Differences in <strong>CT</strong> perfusion mapsgenerated by different commercial software: Quantitative analysis byusing identical source data of acute stroke patients,” Radiology, vol.254, no. 1, pp. 200–209, 2010.[26] F. Zanderigo, A. Bertoldo, G. Pillonetto, and C. Cobelli, “Nonlinearstochastic regularization to characterize tissue residue function in bolustrackingMRI: Assessment and comparison with SVD, block-circulantSVD, and Tikhonov,” IEEE Transactions on Biomedical Engineering,vol. 56, no. 5, pp. 1287–1297, 2009.[27] K. Kudo, S. Terae, C. Katoh, M. Oka, T. Shiga, N. Tamaki, andK. Miyasaka, “Quantitative cerebral blood flow measurement withdynamic perfusion <strong>CT</strong> using the vascular-pixel elimination method:Comparison with H 152 O positron emission tomography,” American Journalof Neuroradiology, vol. 24, no. 3, pp. 419–426, 2003.[28] P. Sauleaua, E. Lapoublea, D. Val-Lailleta, and C.-H. Malberta, “The pigmodel in brain imaging and neurosurgery,” The International Journal ofAnimal Biosciences, vol. 3, no. 8, pp. 1138–1151, 2009.[29] M. Mehra, N. Henninger, J. A. Hirsch, J. Chueh, A. K. Wakhloo, andM. J. Gounis, “Preclinical acute ischemic stroke modeling,” Journal ofNeuro<strong>Interventional</strong> Surgery, 2011, (in press).[30] D. Morhard, C. D. Wirth, G. Fesl, C. Schmidt, M. F. Reiser, C. R.Becker, and B. Ertl-Wagner, “Advantages of extended brain perfusioncomputed tomography: 9.6 cm coverage with time resolved computedtomography-angiography in comparison to standard stroke-computedtomography,” Investigative Radiology, vol. 45, no. 7, pp. 363–369, 2010.[31] R. Fahrig, R. Dixon, T. Payne, R. Morin, A. Ganguly, and N. Strobel,“Dose and image quality for a cone-beam C-arm <strong>CT</strong> system,” MedicalPhysics, vol. 33, no. 12, pp. 4541–50, 2006.[32] C. A. Mistretta, E. Oberstar, B. Davis, E. Brodsky, and C. M. Strother,“4D-DSA and 4D fluoroscopy: preliminary implementation,” in Proc.SPIE Medical <strong>Imaging</strong> 2010: Physics of Medical <strong>Imaging</strong>, vol. 7622,San Diego, USA, 2010, pp. 7 622 271–8.[33] C. A. Mistretta, “Sub-Nyquist acquisition and constrained reconstructionin time resolved angiography,” Medical Physics, vol. 38, no. 6, pp. 2975–2985, 2011.[34] M. Fornasier and H. Rauhut, Handbook of Mathematical Methods in<strong>Imaging</strong>, 1st ed. Berlin, Germany: Springer, 2011, ch. CompressiveSensing, pp. 187–228.[35] G.-H. Chen, J. Tang, and S. Leng, “Prior image constrained compressedsensing (PICCS),” Proc. SPIE Photons Plus Ultrasound: <strong>Imaging</strong> andSensing 2008, vol. 6856, p. 685618, 2008.[36] ——, “Prior image constrained compressed sensing (PICCS): a methodto accurately reconstruct dynamic <strong>CT</strong> images from highly undersampledprojection data sets,” Medical Physics, vol. 35, no. 2, pp. 660–663, 2008.[37] G.-H. Chen, J. Tang, B. Nett, Z. Qi, S. Leng, and T. Szczykutowicz,“Prior image constrained compressed sensing (PICCS) and applicationsin X-ray computed tomography,” Current Medical <strong>Imaging</strong> Reviews,vol. 6, no. 2, pp. 119–134, 2010.
PUBLISHED IN: IEEE TRANSA<strong>CT</strong>IONS ON MEDICAL IMAGING, VOL. 31, NO. 4, PAGES 892–906, APRIL 2012 16[38] J. C. Ramirez-Giraldo, J. Trzasko, S. Leng, L. Yu, A. Manduca, andC. H. McCollough, “Nonconvex prior image constrained compressedsensing (NCPICCS): Theory and simulations on perfusion <strong>CT</strong>,” MedicalPhysics, vol. 38, no. 4, pp. 2157–2167, 2011.[39] B. E. Nett, R. Brauweiler, W. Kalender, H. Rowley, and G.-H. Chen,“<strong>Perfusion</strong> measurements by micro-<strong>CT</strong> using prior image constrainedcompressed sensing (PICCS): initial phantom results,” Physics inMedicine and Biology, vol. 21, no. 8, pp. 2333–2350, 2010.[40] G.-H. Chen, J. Tang, and J. Hsieh, “Temporal resolution improvementusing PICCS in MD<strong>CT</strong> cardiac imaging,” Medical Physics, vol. 36,no. 6, pp. 2130–2135, 2009.[41] J. Tang, J. Hsieh, and G.-H. Chen, “Temporal resolution improvement incardiac <strong>CT</strong> using PICCS (TRI-PICCS): performance studies,” MedicalPhysics, vol. 37, no. 8, pp. 4377–4388, 2010.[42] C. Maaß and M. Kachelrieß, “Quantification of temporal resolution andits reliability in the context of TRI-PICCS and dual source <strong>CT</strong>,” in Proc.SPIE Medical <strong>Imaging</strong> 2011: Physics of Medical <strong>Imaging</strong>, vol. 7961,Lake Buena Vista, USA, 2011, pp. 79 611M1–7.