Interventional 4-D C-Arm CT Perfusion Imaging Using Interleaved ...
Interventional 4-D C-Arm CT Perfusion Imaging Using Interleaved ...
Interventional 4-D C-Arm CT Perfusion Imaging Using Interleaved ...

You also want an ePaper? Increase the reach of your titles
YUMPU automatically turns print PDFs into web optimized ePapers that Google loves.
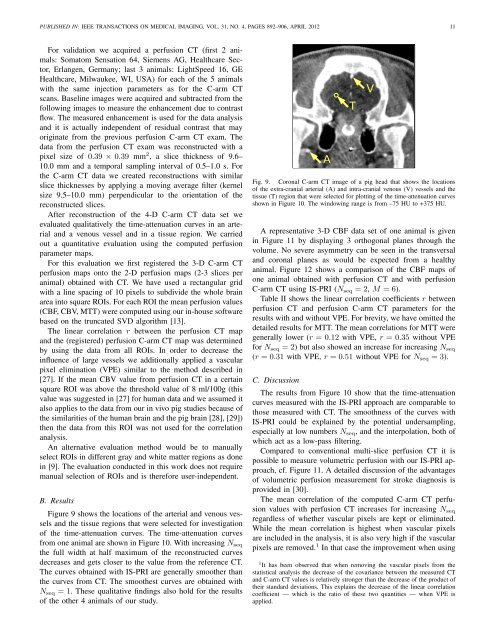
PUBLISHED IN: IEEE TRANSA<strong>CT</strong>IONS ON MEDICAL IMAGING, VOL. 31, NO. 4, PAGES 892–906, APRIL 2012 11For validation we acquired a perfusion <strong>CT</strong> (first 2 animals:Somatom Sensation 64, Siemens AG, Healthcare Sector,Erlangen, Germany; last 3 animals: LightSpeed 16, GEHealthcare, Milwaukee, WI, USA) for each of the 5 animalswith the same injection parameters as for the C-arm <strong>CT</strong>scans. Baseline images were acquired and subtracted from thefollowing images to measure the enhancement due to contrastflow. The measured enhancement is used for the data analysisand it is actually independent of residual contrast that mayoriginate from the previous perfusion C-arm <strong>CT</strong> exam. Thedata from the perfusion <strong>CT</strong> exam was reconstructed with apixel size of 0.39 × 0.39 mm 2 , a slice thickness of 9.6–10.0 mm and a temporal sampling interval of 0.5–1.0 s. Forthe C-arm <strong>CT</strong> data we created reconstructions with similarslice thicknesses by applying a moving average filter (kernelsize 9.5–10.0 mm) perpendicular to the orientation of thereconstructed slices.After reconstruction of the 4-D C-arm <strong>CT</strong> data set weevaluated qualitatively the time-attenuation curves in an arterialand a venous vessel and in a tissue region. We carriedout a quantitative evaluation using the computed perfusionparameter maps.For this evaluation we first registered the 3-D C-arm <strong>CT</strong>perfusion maps onto the 2-D perfusion maps (2-3 slices peranimal) obtained with <strong>CT</strong>. We have used a rectangular gridwith a line spacing of 10 pixels to subdivide the whole brainarea into square ROIs. For each ROI the mean perfusion values(CBF, CBV, MTT) were computed using our in-house softwarebased on the truncated SVD algorithm [13].The linear correlation r between the perfusion <strong>CT</strong> mapand the (registered) perfusion C-arm <strong>CT</strong> map was determinedby using the data from all ROIs. In order to decrease theinfluence of large vessels we additionally applied a vascularpixel elimination (VPE) similar to the method described in[27]. If the mean CBV value from perfusion <strong>CT</strong> in a certainsquare ROI was above the threshold value of 8 ml/100g (thisvalue was suggested in [27] for human data and we assumed italso applies to the data from our in vivo pig studies because ofthe similarities of the human brain and the pig brain [28], [29])then the data from this ROI was not used for the correlationanalysis.An alternative evaluation method would be to manuallyselect ROIs in different gray and white matter regions as donein [9]. The evaluation conducted in this work does not requiremanual selection of ROIs and is therefore user-independent.B. ResultsFigure 9 shows the locations of the arterial and venous vesselsand the tissue regions that were selected for investigationof the time-attenuation curves. The time-attenuation curvesfrom one animal are shown in Figure 10. With increasing N seqthe full width at half maximum of the reconstructed curvesdecreases and gets closer to the value from the reference <strong>CT</strong>.The curves obtained with IS-PRI are generally smoother thanthe curves from <strong>CT</strong>. The smoothest curves are obtained withN seq = 1. These qualitative findings also hold for the resultsof the other 4 animals of our study.Fig. 9. Coronal C-arm <strong>CT</strong> image of a pig head that shows the locationsof the extra-cranial arterial (A) and intra-cranial venous (V) vessels and thetissue (T) region that were selected for plotting of the time-attenuation curvesshown in Figure 10. The windowing range is from –75 HU to +375 HU.A representative 3-D CBF data set of one animal is givenin Figure 11 by displaying 3 orthogonal planes through thevolume. No severe asymmetry can be seen in the transversaland coronal planes as would be expected from a healthyanimal. Figure 12 shows a comparison of the CBF maps ofone animal obtained with perfusion <strong>CT</strong> and with perfusionC-arm <strong>CT</strong> using IS-PRI (N seq = 2, M = 6).Table II shows the linear correlation coefficients r betweenperfusion <strong>CT</strong> and perfusion C-arm <strong>CT</strong> parameters for theresults with and without VPE. For brevity, we have omitted thedetailed results for MTT. The mean correlations for MTT weregenerally lower (r = 0.12 with VPE, r = 0.35 without VPEfor N seq = 2) but also showed an increase for increasing N seq(r = 0.31 with VPE, r = 0.51 without VPE for N seq = 3).C. DiscussionThe results from Figure 10 show that the time-attenuationcurves measured with the IS-PRI approach are comparable tothose measured with <strong>CT</strong>. The smoothness of the curves withIS-PRI could be explained by the potential undersampling,especially at low numbers N seq , and the interpolation, both ofwhich act as a low-pass filtering.Compared to conventional multi-slice perfusion <strong>CT</strong> it ispossible to measure volumetric perfusion with our IS-PRI approach,cf. Figure 11. A detailed discussion of the advantagesof volumetric perfusion measurement for stroke diagnosis isprovided in [30].The mean correlation of the computed C-arm <strong>CT</strong> perfusionvalues with perfusion <strong>CT</strong> increases for increasing N seqregardless of whether vascular pixels are kept or eliminated.While the mean correlation is highest when vascular pixelsare included in the analysis, it is also very high if the vascularpixels are removed. 1 In that case the improvement when using1 It has been observed that when removing the vascular pixels from thestatistical analysis the decrease of the covariance between the measured <strong>CT</strong>and C-arm <strong>CT</strong> values is relatively stronger than the decrease of the product oftheir standard deviations. This explains the decrease of the linear correlationcoefficient — which is the ratio of these two quantities — when VPE isapplied.