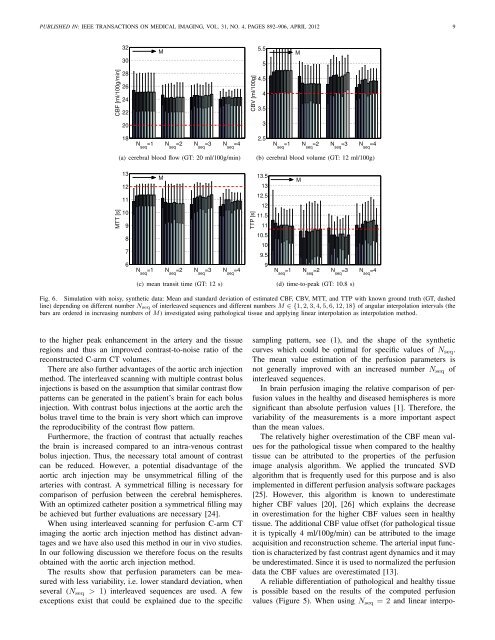
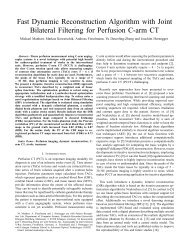
PUBLISHED IN: IEEE TRANSA<strong>CT</strong>IONS ON MEDICAL IMAGING, VOL. 31, NO. 4, PAGES 892–906, APRIL 2012 8(a) M = 1 (b) M = 3 (c) M = 6 (d) M = 18(e) M = 1 (f) M = 3 (g) M = 6 (h) M = 18Fig. 8. Reconstruction of a simulated arterial vessel with time-varyingattenuation values from (a–d) noisy and (e–h) noise-free input data usingN seq = 3 interleaved sequences. M is the number of angular interpolationintervals. The windowing is from –10 HU (black) to +10 HU (white).value of 20% of the maximum singular value as described in[13]. In this algorithm the arterial time curve µ art (t) and thetissue time curve µ tis are deconvolved and the peak value andthe integral of this deconvolved function give the CBF and theCBV, respectively, whereas MTT is the ratio of both, cf. (11).TTP was determined directly from the tissue time curves.We quantified the reconstruction artifact around the arteryby measuring the average absolute deviation from the groundtruth value in an annular region around the artery. Thefollowing expression defines the pixel positions x i (i =0,...,N i −1) that lie within this annular region:r 2 art ≤ x 2 i +y 2 i ≤ (3r art ) 2 . (12)We set the outer radius to 3r art after initial evaluation ofdifferent radii in order to have the majority of the artifactwithin the annulus ring. The measure χ art of the meanreconstruction artifact for a given time point t est is definedasχ art (t est ) = 1 N∑i−1N ii=0|˜µ rec (x i ,t est )−µ pha (x i ,t est )| . (13)C. Results: Simulated Aortic Arch InjectionFigure 5 shows the mean and standard deviation of thecomputed perfusion parameters CBF, CBV, MTT, and TTPfrom reconstructions with a constant number M = 6 of angularinterpolation intervals and different interpolation methods.Results with different numbers M will be discussed later.According to the central volume theorem, see (11), only twoof the three parameters CBF, CBV and MTT are independent;however, we present the results of all of these parameters fora more comprehensive evaluation.Generally, the standard deviation of the computed parametervalues, which is a measure for the variability, decreases whenthe number N seq of interleaved sequences increases. Especiallythe standard deviation of CBF, MTT, and TTP (healthytissue) decreases significantly when N seq is increased from 1to 2. For example, with linear interpolation the standard deviationof CBF in healthy tissue decreases from 14.3 ml/100g/minto 3.6 ml/100g/min when two interleaved sequences instead ofone sequence are used. For pathological tissue these values are2.9 ml/100g/min and 1.5 ml/100g/min.The mean TTP values get closer to the ground truth valuefor increasing N seq and the mean CBF and mean CBV valuestend to get overestimated, especially for pathological tissue.The mean MTT values show different trends for increasingN seq for the cases of healthy (they are closer to the groundtruth) and pathological tissue (they tend to get underestimated).Figure 6 shows the CBF, CBV, MTT, and TTP of thesimulated pathological tissue as a function of different numberM of interpolation intervals when using linear interpolation.For N seq ∈ {3,4} the mean of the estimations of CBV, MTT,and TTP varies with increasing M values while the CBFestimation is nearly unaffected by differentM values. It can beobserved that the results with M ∈ {12,18} are similar to theresults with M = 6. Generally, the estimation of the perfusionparameters does not improve significantly when increasing Mfor neither the pathological tissue (Figure 6) nor for the healthytissue (data omitted for brevity).Results for the reconstruction artifact around the simulatedartery are shown in Figure 7. Figure 7(c) shows χ art (t) fordifferent time points t when using the linear interpolationmethod. If N seq > 1 then the value of χ art (t) decreasesfor M = 6 when compared to M = 1. For comparisonof different interpolation methods, in Figure 7(a)–(b) themean and standard deviation is plotted for a reconstructiontime point during the arterial outflow phase (t est = 9s, seeFigure 4). The value of χ art (9s) from a reconstruction withoutany simulated contrast flow is indicated with a dashed line, thisvalue is purely due to the noise in the projection images andthus also the reconstructed images, cf. definition of χ art in(13).As a visual example Figure 8 shows reconstructions ofthe simulated arterial vessel at the time point t est = 9s fordifferent numbers M, here with an in-plane voxel spacing of0.1 mm. Additionally, also the results obtained from noise-freeinput data are presented in this figure.D. Results: Simulated Intra-venous InjectionThe results based on the simulated intra-venous injectionshow similar trends — when changing N seq , for example — asthe results corresponding to the simulated aortic arch injection(Section III-C). However, when comparing the two injectionmethods the intra-venous injection provides worse results thanthe aortic arch injection.For brevity we only show the results of the intra-venousinjection for one relevant case. With linear interpolation thestandard deviation of CBF in healthy tissue decreases from15.0 ml/100g/min to 12.1 ml/100g/min when two interleavedsequences instead of one sequence are used. For pathologicaltissue these values are 3.7 ml/100g/min and 3.1 ml/100g/min.E. DiscussionThe results indicate that when using an aortic arch injectionthe perfusion parameters can be estimated more reliably whencompared to an intra-venous injection. This can be attributed
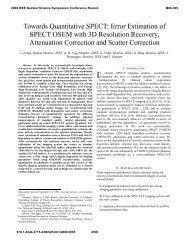
PUBLISHED IN: IEEE TRANSA<strong>CT</strong>IONS ON MEDICAL IMAGING, VOL. 31, NO. 4, PAGES 892–906, APRIL 2012 93230M5.55MCBF [ml/100g/min]28262422CBV [ml/100g]4.543.520318N seq=1 N seq=2 N seq=3 N seq=42.5N seq=1 N seq=2 N seq=3 N seq=4(a) cerebral blood flow (GT: 20 ml/100g/min)(b) cerebral blood volume (GT: 12 ml/100g)MTT [s]131211109MTTP [s]13.51312.51211.511M8710.5109.56N seq=1 N seq=2 N seq=3 N seq=49N seq=1 N seq=2 N seq=3 N seq=4(c) mean transit time (GT: 12 s)(d) time-to-peak (GT: 10.8 s)Fig. 6. Simulation with noisy, synthetic data: Mean and standard deviation of estimated CBF, CBV, MTT, and TTP with known ground truth (GT, dashedline) depending on different number N seq of interleaved sequences and different numbers M ∈ {1,2,3,4,5,6,12,18} of angular interpolation intervals (thebars are ordered in increasing numbers of M) investigated using pathological tissue and applying linear interpolation as interpolation method.to the higher peak enhancement in the artery and the tissueregions and thus an improved contrast-to-noise ratio of thereconstructed C-arm <strong>CT</strong> volumes.There are also further advantages of the aortic arch injectionmethod. The interleaved scanning with multiple contrast bolusinjections is based on the assumption that similar contrast flowpatterns can be generated in the patient’s brain for each bolusinjection. With contrast bolus injections at the aortic arch thebolus travel time to the brain is very short which can improvethe reproducibility of the contrast flow pattern.Furthermore, the fraction of contrast that actually reachesthe brain is increased compared to an intra-venous contrastbolus injection. Thus, the necessary total amount of contrastcan be reduced. However, a potential disadvantage of theaortic arch injection may be unsymmetrical filling of thearteries with contrast. A symmetrical filling is necessary forcomparison of perfusion between the cerebral hemispheres.With an optimized catheter position a symmetrical filling maybe achieved but further evaluations are necessary [24].When using interleaved scanning for perfusion C-arm <strong>CT</strong>imaging the aortic arch injection method has distinct advantagesand we have also used this method in our in vivo studies.In our following discussion we therefore focus on the resultsobtained with the aortic arch injection method.The results show that perfusion parameters can be measuredwith less variability, i.e. lower standard deviation, whenseveral (N seq > 1) interleaved sequences are used. A fewexceptions exist that could be explained due to the specificsampling pattern, see (1), and the shape of the syntheticcurves which could be optimal for specific values of N seq .The mean value estimation of the perfusion parameters isnot generally improved with an increased number N seq ofinterleaved sequences.In brain perfusion imaging the relative comparison of perfusionvalues in the healthy and diseased hemispheres is moresignificant than absolute perfusion values [1]. Therefore, thevariability of the measurements is a more important aspectthan the mean values.The relatively higher overestimation of the CBF mean valuesfor the pathological tissue when compared to the healthytissue can be attributed to the properties of the perfusionimage analysis algorithm. We applied the truncated SVDalgorithm that is frequently used for this purpose and is alsoimplemented in different perfusion analysis software packages[25]. However, this algorithm is known to underestimatehigher CBF values [20], [26] which explains the decreasein overestimation for the higher CBF values seen in healthytissue. The additional CBF value offset (for pathological tissueit is typically 4 ml/100g/min) can be attributed to the imageacquisition and reconstruction scheme. The arterial input functionis characterized by fast contrast agent dynamics and it maybe underestimated. Since it is used to normalized the perfusiondata the CBF values are overestimated [13].A reliable differentiation of pathological and healthy tissueis possible based on the results of the computed perfusionvalues (Figure 5). When using N seq = 2 and linear interpo-