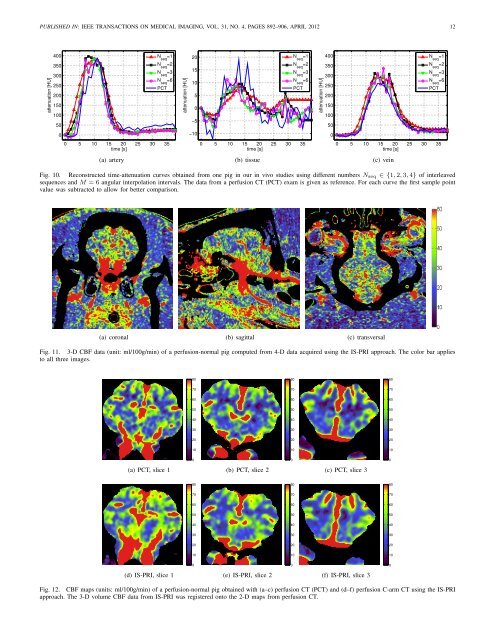
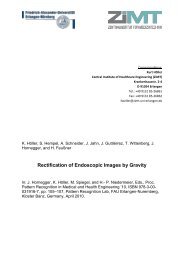
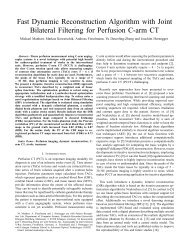
PUBLISHED IN: IEEE TRANSA<strong>CT</strong>IONS ON MEDICAL IMAGING, VOL. 31, NO. 4, PAGES 892–906, APRIL 2012 12attenuation [HU]40035030025020015010050N =1 seqN seq=2N seq=3N =6 seqP<strong>CT</strong>attenuation [HU]20151050−5N =1 seqN seq=2N seq=3N =6 seqP<strong>CT</strong>attenuation [HU]40035030025020015010050N =1 seqN seq=2N seq=3N =6 seqP<strong>CT</strong>0−1000 5 10 15 20 25 30 35time [s]0 5 10 15 20 25 30 35time [s]0 5 10 15 20 25 30 35time [s](a) artery(b) tissue(c) veinFig. 10. Reconstructed time-attenuation curves obtained from one pig in our in vivo studies using different numbers N seq ∈ {1,2,3,4} of interleavedsequences and M = 6 angular interpolation intervals. The data from a perfusion <strong>CT</strong> (P<strong>CT</strong>) exam is given as reference. For each curve the first sample pointvalue was subtracted to allow for better comparison.(a) coronal (b) sagittal (c) transversalFig. 11. 3-D CBF data (unit: ml/100g/min) of a perfusion-normal pig computed from 4-D data acquired using the IS-PRI approach. The color bar appliesto all three images.808080707070606060505050404040303030202020101010000(a) P<strong>CT</strong>, slice 1(b) P<strong>CT</strong>, slice 2(c) P<strong>CT</strong>, slice 3808080707070606060505050404040303030202020101010000(d) IS-PRI, slice 1(e) IS-PRI, slice 2(f) IS-PRI, slice 3Fig. 12. CBF maps (units: ml/100g/min) of a perfusion-normal pig obtained with (a–c) perfusion <strong>CT</strong> (P<strong>CT</strong>) and (d–f) perfusion C-arm <strong>CT</strong> using the IS-PRIapproach. The 3-D volume CBF data from IS-PRI was registered onto the 2-D maps from perfusion <strong>CT</strong>.
PUBLISHED IN: IEEE TRANSA<strong>CT</strong>IONS ON MEDICAL IMAGING, VOL. 31, NO. 4, PAGES 892–906, APRIL 2012 13TABLE IICORRELATION r BETWEEN PERFUSION PARAMETERS THAT WERE MEASURED WITH <strong>CT</strong> AND C-ARM <strong>CT</strong> IN 5 HEALTHY PIGS (LABELED FROM A TO E).VPE: VASCULAR PIXEL ELIMINATION, SD: STANDARD DEVIATION.N seq A B C D E mean±SDCBF [ml/100g/min], w/o VPE 1 0.97 0.92 0.91 0.87 0.95 0.92±0.04CBF [ml/100g/min], w/ VPE 1 0.79 0.80 0.58 0.54 0.62 0.67±0.12CBV [ml/100g], w/o VPE 1 0.98 0.96 0.92 0.87 0.96 0.94±0.05CBV [ml/100g], w/ VPE 1 0.75 0.73 0.52 0.42 0.49 0.58±0.15CBF [ml/100g/min], w/o VPE 2 0.97 0.95 0.93 0.88 0.94 0.94±0.03CBF [ml/100g/min], w/ VPE 2 0.79 0.82 0.74 0.55 0.63 0.71±0.11CBV [ml/100g], w/o VPE 2 0.98 0.96 0.93 0.89 0.96 0.94±0.04CBV [ml/100g], w/ VPE 2 0.78 0.77 0.59 0.46 0.53 0.63±0.14CBF [ml/100g/min], w/o VPE 3 0.93 0.95 0.94 0.89 0.93 0.93±0.02CBF [ml/100g/min], w/ VPE 3 0.80 0.83 0.78 0.59 0.65 0.73±0.10CBV [ml/100g], w/o VPE 3 0.98 0.96 0.94 0.91 0.95 0.95±0.03CBV [ml/100g], w/ VPE 3 0.77 0.76 0.71 0.51 0.61 0.67±0.11increasing numbers N seq is most prominent. The standarddeviation of the mean correlation decreases for increasingN seq . The evaluation with VPE may be clinically more significant,in order to evaluate tissue perfusion, than the evaluationwithout VPE. Nevertheless, the results without VPE show thecorrelation between perfusion <strong>CT</strong> and perfusion C-arm <strong>CT</strong>values on a broader range of values.We did not evaluate higher numbers M of angular interpolationintervals as the results from the simulations did not show asignificant improvement for M > 6. The simulations showedthat reconstruction artifacts could be reduced with M = 6compared to M = 1. With in vivo data these reconstructionartifacts were difficult to evaluate due to the lack of groundtruth data.In order to increase the contrast-to-noise ratio (CNR) ofthe measured tissue time-attenuation curves and to increasethe reproducibility of the contrast flow patterns we used acontrast bolus injection at the aortic arch, cf. Section III-E.Intra-venous contrast injection methods may be investigatedin future animal studies. Note, ECG-triggered contrast bolusinjections, which were not performed in this study due tohardware constraints, could reduce the influence of the cardiaccycle [15] which could further increase the reproducibility ofthe contrast flow patterns.Our study was not optimized for X-ray dose reduction.When used in clinical practice the applied dose of a protocolwith two interleaved scan sequences may be similar to theapplied dose of current volume perfusion <strong>CT</strong> protocols [31].A more detailed analysis of the clinical data focusing onclinical aspects such as different injection protocols and adifferentiation of gray and white matter was carried out in[9] where further statistical measures (Bland-Altman plots,concordance correlation coefficients) were also investigated.In [9] the correlation between perfusion <strong>CT</strong> and perfusionC-arm <strong>CT</strong> was computed using manually selected circularROIs and a linear correlation of r = 0.88 was obtainedwith two interleaved sequences. Also with the automatic, userindependentROI selection approach as carried out in this workthe correlation of CBF and CBV is very high (ranging fromr = 0.63 to r = 0.94 for N seq = 2).Our studies were based on perfusion-normal pigs. Note,there is no minimally invasive stroke model for pigs sincethe rete mirabile does not permit endovascular access tothe anterior cerebrovasculature [29]. Further studies involvinganimal stroke models or human stroke patients are necessaryfor the validation of our methods and will be carried out inthe future.V. OUTLOOK ON FUTURE DEVELOPMENTSThe IS-PRI approach presented in this paper enables, forthe first time, perfusion imaging using C-arm <strong>CT</strong> in theinterventional suite. Future research in this field may focuson further increasing the accuracy of the technique, and toreduce the amount of contrast agent and X-ray radiation thatis applied to the patient. These goals could be accomplishedby new image reconstruction algorithms or new C-arm <strong>CT</strong>system technologies. In this section, we will give an outlookon potential future developments.A. Dual-source Bi-plane SystemAs discussed in Section III-E, two interleaved sequencesmay already provide results that can be used for a reliablestroke diagnosis. However, two separate injections are requiredwhich increase the contrast agent dose and lead to a longerexamination time. The necessity for two injections could berelaxed if a bi-plane C-arm angiography system was usedwhere both planes could acquire projections simultaneouslyduring the C-arm rotation. In that case, two interleaved-typesequences could be acquired with only one contrast bolusinjection.Figure 13 shows how the PRI approach could be applied todata acquired with a bi-plane system. The two planes of thebi-plane system are mounted at an angle of Λ/2 in relationto each other. With current bi-plane systems it is not possibleto perform simultaneous data acquisition using both planes.However, if simultaneous acquisition was feasible, and if a biplanesystem was actually available in the interventional suite,the aforementioned modified PRI approach could be used asan alternative to the dual bolus approach.