Interventional 4-D C-Arm CT Perfusion Imaging Using Interleaved ...
Interventional 4-D C-Arm CT Perfusion Imaging Using Interleaved ...
Interventional 4-D C-Arm CT Perfusion Imaging Using Interleaved ...

Create successful ePaper yourself
Turn your PDF publications into a flip-book with our unique Google optimized e-Paper software.
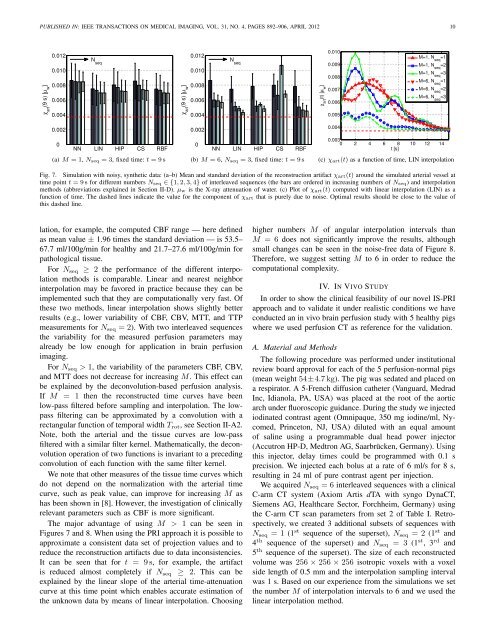
PUBLISHED IN: IEEE TRANSA<strong>CT</strong>IONS ON MEDICAL IMAGING, VOL. 31, NO. 4, PAGES 892–906, APRIL 2012 10χ art(9 s) [µ w]0.0120.0100.0080.0060.004N seqχ art(9 s) [µ w]0.0120.0100.0080.0060.004N seqχ art(t) [µ w]0.0100.0090.0080.0070.0060.005M=1, N =1 seqM=1, N =2 seqM=1, N =3 seqM=6, N seq=1M=6, N =2 seqM=6, N seq=30.0020NN LIN HIP CS RBF(a) M = 1, N seq = 3, fixed time: t = 9s0.0020NN LIN HIP CS RBF(b) M = 6, N seq = 3, fixed time: t = 9s0.0040.0030 2 4 6 8 10 12 14t [s](c) χ art(t) as a function of time, LIN interpolationFig. 7. Simulation with noisy, synthetic data: (a–b) Mean and standard deviation of the reconstruction artifact χ art(t) around the simulated arterial vessel attime point t = 9s for different numbers N seq ∈ {1,2,3,4} of interleaved sequences (the bars are ordered in increasing numbers of N seq) and interpolationmethods (abbreviations explained in Section II-D). µ w is the X-ray attenuation of water. (c) Plot of χ art(t) computed with linear interpolation (LIN) as afunction of time. The dashed lines indicate the value for the component of χ art that is purely due to noise. Optimal results should be close to the value ofthis dashed line.lation, for example, the computed CBF range — here definedas mean value ± 1.96 times the standard deviation — is 53.5–67.7 ml/100g/min for healthy and 21.7–27.6 ml/100g/min forpathological tissue.For N seq ≥ 2 the performance of the different interpolationmethods is comparable. Linear and nearest neighborinterpolation may be favored in practice because they can beimplemented such that they are computationally very fast. Ofthese two methods, linear interpolation shows slightly betterresults (e.g., lower variability of CBF, CBV, MTT, and TTPmeasurements for N seq = 2). With two interleaved sequencesthe variability for the measured perfusion parameters mayalready be low enough for application in brain perfusionimaging.For N seq > 1, the variability of the parameters CBF, CBV,and MTT does not decrease for increasing M. This effect canbe explained by the deconvolution-based perfusion analysis.If M = 1 then the reconstructed time curves have beenlow-pass filtered before sampling and interpolation. The lowpassfiltering can be approximated by a convolution with arectangular function of temporal width T rot , see Section II-A2.Note, both the arterial and the tissue curves are low-passfiltered with a similar filter kernel. Mathematically, the deconvolutionoperation of two functions is invariant to a precedingconvolution of each function with the same filter kernel.We note that other measures of the tissue time curves whichdo not depend on the normalization with the arterial timecurve, such as peak value, can improve for increasing M ashas been shown in [8]. However, the investigation of clinicallyrelevant parameters such as CBF is more significant.The major advantage of using M > 1 can be seen inFigures 7 and 8. When using the PRI approach it is possible toapproximate a consistent data set of projection values and toreduce the reconstruction artifacts due to data inconsistencies.It can be seen that for t = 9s, for example, the artifactis reduced almost completely if N seq ≥ 2. This can beexplained by the linear slope of the arterial time-attenuationcurve at this time point which enables accurate estimation ofthe unknown data by means of linear interpolation. Choosinghigher numbers M of angular interpolation intervals thanM = 6 does not significantly improve the results, althoughsmall changes can be seen in the noise-free data of Figure 8.Therefore, we suggest setting M to 6 in order to reduce thecomputational complexity.IV. IN VIVO STUDYIn order to show the clinical feasibility of our novel IS-PRIapproach and to validate it under realistic conditions we haveconducted an in vivo brain perfusion study with 5 healthy pigswhere we used perfusion <strong>CT</strong> as reference for the validation.A. Material and MethodsThe following procedure was performed under institutionalreview board approval for each of the 5 perfusion-normal pigs(mean weight 54±4.7kg). The pig was sedated and placed ona respirator. A 5-French diffusion catheter (Vanguard, MedradInc, Idianola, PA, USA) was placed at the root of the aorticarch under fluoroscopic guidance. During the study we injectediodinated contrast agent (Omnipaque, 350 mg iodine/ml, Nycomed,Princeton, NJ, USA) diluted with an equal amountof saline using a programmable dual head power injector(Accutron HP-D, Medtron AG, Saarbrücken, Germany). <strong>Using</strong>this injector, delay times could be programmed with 0.1 sprecision. We injected each bolus at a rate of 6 ml/s for 8 s,resulting in 24 ml of pure contrast agent per injection.We acquired N seq = 6 interleaved sequences with a clinicalC-arm <strong>CT</strong> system (Axiom Artis dTA with syngo Dyna<strong>CT</strong>,Siemens AG, Healthcare Sector, Forchheim, Germany) usingthe C-arm <strong>CT</strong> scan parameters from set 2 of Table I. Retrospectively,we created 3 additional subsets of sequences withN seq = 1 (1 st sequence of the superset), N seq = 2 (1 st and4 th sequence of the superset) and N seq = 3 (1 st , 3 rd and5 th sequence of the superset). The size of each reconstructedvolume was 256 × 256 × 256 isotropic voxels with a voxelside length of 0.5 mm and the interpolation sampling intervalwas 1 s. Based on our experience from the simulations we setthe number M of interpolation intervals to 6 and we used thelinear interpolation method.