To view the full report Children's Food Examined in PDF format click ...
To view the full report Children's Food Examined in PDF format click ...
To view the full report Children's Food Examined in PDF format click ...

You also want an ePaper? Increase the reach of your titles
YUMPU automatically turns print PDFs into web optimized ePapers that Google loves.
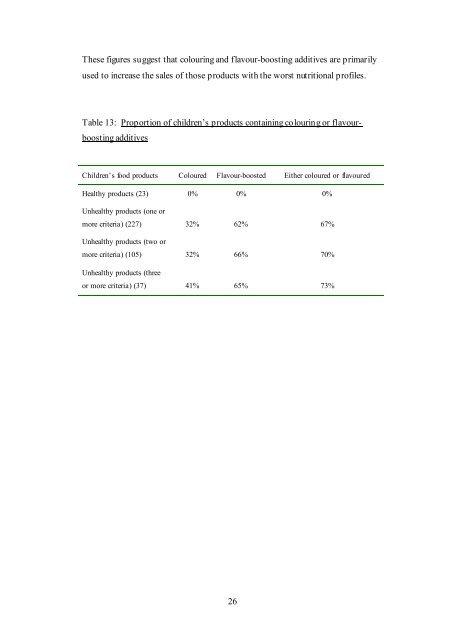
These figures suggest that colour<strong>in</strong>g and flavour-boost<strong>in</strong>g additives are primarilyused to <strong>in</strong>crease <strong>the</strong> sales of those products with <strong>the</strong> worst nutritional profiles.Table 13: Proportion of children’s products conta<strong>in</strong><strong>in</strong>g colour<strong>in</strong>g or flavourboost<strong>in</strong>gadditivesChildren’s food products Coloured Flavour-boosted Ei<strong>the</strong>r coloured or flavouredHealthy products (23) 0% 0% 0%Unhealthy products (one ormore criteria) (227) 32% 62% 67%Unhealthy products (two ormore criteria) (105) 32% 66% 70%Unhealthy products (threeor more criteria) (37) 41% 65% 73%26