
You also want an ePaper? Increase the reach of your titles
YUMPU automatically turns print PDFs into web optimized ePapers that Google loves.
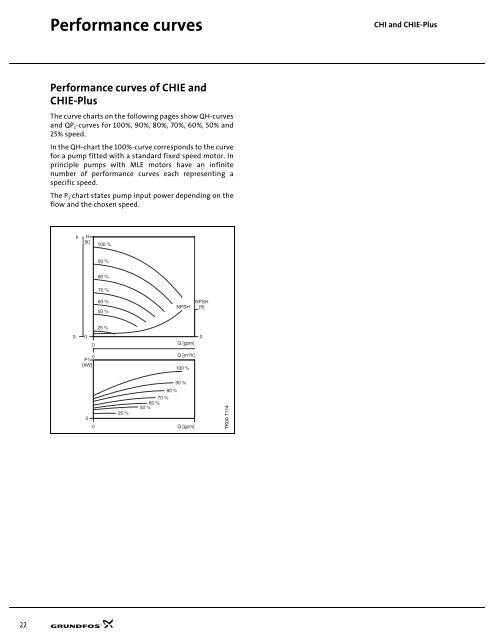
Performance curves<strong>CHI</strong> and <strong>CHI</strong>E-PlusPerformance curves of <strong>CHI</strong>E and<strong>CHI</strong>E-PlusThe curve charts on the following pages show QH-curvesand QP 1 -curves for 100%, 90%, 80%, 70%, 60%, 50% and25% speed.In the QH-chart the 100%-curve corresponds to the curvefor a pump fitted with a standard fixed speed motor. Inprinciple pumps with MLE motors have an infinitenumber of performance curves each representing aspecific speed.The P 1 chart states pump input power depending on theflow and the chosen speed.pH[ft]100 %90 %80 %70 %60 %50 %NPSHNPSH[ft]25 %000 Q [gpm]00P1Q [m³/h][kW]100 %025 %90 %80 %70 %60 %50 %0 Q [gpm]TK00 711422