City Heights CO and PM2.5 Data Analysis Report - Air Pollution ...
City Heights CO and PM2.5 Data Analysis Report - Air Pollution ...
City Heights CO and PM2.5 Data Analysis Report - Air Pollution ...

Create successful ePaper yourself
Turn your PDF publications into a flip-book with our unique Google optimized e-Paper software.
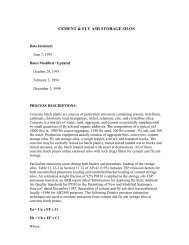
San Diego Hourly <strong>CO</strong> <strong>Data</strong> Averages by Hour:November 1, 2008, through December 13, 2008<strong>CO</strong> (ppm)2.01.81.61.41.21.00.80.60.40.20.00 1 2 3 4 5 6 7 8 9 10 11 12 13 14 15 16 17 18 19 20 21 22 23Hour (PST)CVADTNES<strong>CO</strong>TMTEPFigure 8.Graph of hourly averaged <strong>CO</strong> data for the Teralta Park (TEP) portion of theproject.The data for the project period when the <strong>CO</strong> analyzer in <strong>City</strong> <strong>Heights</strong> was located at thesouthwest corner of Central Elementary School (CES) is shown in Figure 9. Although thisgraph is similar to the earlier time period (Figure 8), the Otay Mesa site (OTM) shows lower<strong>CO</strong> concentrations. This is most likely due to lower border traffic volume during theChristmas holiday period.- 13 -