City Heights CO and PM2.5 Data Analysis Report - Air Pollution ...
City Heights CO and PM2.5 Data Analysis Report - Air Pollution ...
City Heights CO and PM2.5 Data Analysis Report - Air Pollution ...

You also want an ePaper? Increase the reach of your titles
YUMPU automatically turns print PDFs into web optimized ePapers that Google loves.
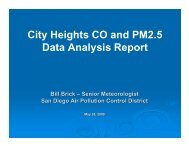
Hourly <strong>CO</strong> <strong>Data</strong> for: Thursday, 1/1/20095.04.54.0<strong>CO</strong> (ppm)3.53.02.52.01.51.0CVADTNES<strong>CO</strong>TMTEP/CES0.50.00 1 2 3 4 5 6 7 8 9 10 11 12 13 14 15 16 17 18 19 20 21 22 23Hour (PST)Figure 12. Graph of hourly <strong>CO</strong> concentrations for New Year’s Day, Thursday, January 1,2009.The above examples of holiday emissions show how human activities in San Diego Countyaffect air quality concentrations. In can also be educational to look at air quality patterns asthey relate to human activities throughout an average week. A graph of hourly averaged <strong>CO</strong>concentrations based on the day of the week for the Teralta Park (TEP) <strong>and</strong> CentralElementary School (CES) sites is shown in Figure 13. This graph shows that the weekdaymorning commutes peak at 0700 PST while the weekend morning commutes peak lower <strong>and</strong>at 0800 PST. The lowest morning commute peak is on Sunday mornings. Daytimeconcentrations are also lowest on Sundays, with day of week differences relatively small.The evening patterns show that Friday nights had the highest concentrations <strong>and</strong> Saturdaynights the lowest concentrations.- 17 -