City Heights CO and PM2.5 Data Analysis Report - Air Pollution ...
City Heights CO and PM2.5 Data Analysis Report - Air Pollution ...
City Heights CO and PM2.5 Data Analysis Report - Air Pollution ...

You also want an ePaper? Increase the reach of your titles
YUMPU automatically turns print PDFs into web optimized ePapers that Google loves.
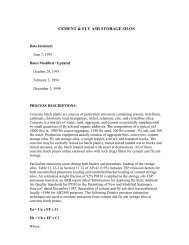
San Diego Hourly <strong>CO</strong> <strong>Data</strong> Averages by Hour (interpolated):November 1, 2008, through January 30, 2009<strong>CO</strong> (ppm)2.22.01.81.61.41.21.00.80.60.40.20.00 1 2 3 4 5 6 7 8 9 10 11 12 13 14 15 16 17 18 19 20 21 22 23Hour (PST)TEPCESFigure 10.Graph of hourly averaged <strong>CO</strong> data for the Teralta Park (TEP) <strong>and</strong> CentralElementary School (CES) portions of the project (interpolated mode to showdata for hour 0).The data from New Year’s Eve <strong>and</strong> New Year’s Day show how changes in daily patterns ofhuman activity can impact ambient air quality concentrations. Figure 11 shows the hourly<strong>CO</strong> concentrations for New Year’s Eve (Wednesday, December 31, 2008). <strong>CO</strong>concentrations reflect the typical morning commute, with the highest concentrationsmeasured at the District’s Downtown San Diego (DTN) <strong>and</strong> Escondido (ESC) monitoringstations. The normal afternoon pattern is followed by a later than usual afternoon increase in<strong>CO</strong> concentrations. The Escondido monitoring station data show a continuous increase inevening <strong>and</strong> late night concentrations as people continue to drive their cars <strong>and</strong> home heatingsystems <strong>and</strong> fireplaces operate at later than normal hours. The later than normal peak in <strong>CO</strong>concentrations is seen at the Central Elementary School (TEP/CES) site as well. This peakcomes from local activities as well as traffic on SR-15. The traffic on SR-15 would becomposed mainly of passenger car traffic at this time, with very limited truck traffic.- 15 -