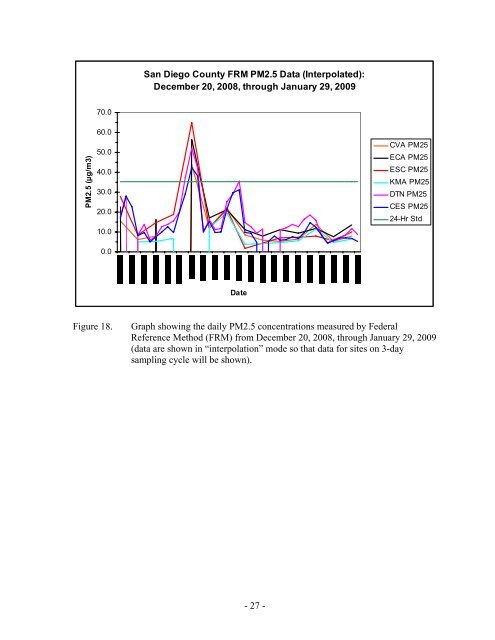
<strong>CO</strong>NCLUSIONSThis study measured carbon monoxide (<strong>CO</strong>) <strong>and</strong> fine particulate matter (<strong>PM2.5</strong>) at severallocations in the community of <strong>City</strong> <strong>Heights</strong> during winter months, when both pollutantstypically reach their annual peak concentrations. The study found that <strong>CO</strong> <strong>and</strong> <strong>PM2.5</strong> exhibitsimilar patterns to other locations in the County, <strong>and</strong> that the measured concentrations fallmid-range to other San Diego sites for both pollutants.<strong>CO</strong> levels at all monitoring sites in San Diego, including <strong>City</strong> <strong>Heights</strong>, meet all state <strong>and</strong>federal air quality st<strong>and</strong>ards. In fact, measured levels were well below the st<strong>and</strong>ards. The<strong>CO</strong> measurements, in close proximity <strong>and</strong> on both sides of SR-15, found concentrations thatwere less than other areas of the County where population density, traffic, topography, <strong>and</strong>meteorology result in higher concentrations. <strong>City</strong> <strong>Heights</strong> is in an area with adequateventilation <strong>and</strong> without topography for cold air to settle <strong>and</strong> trap pollutants in the surfacelayer. This combination of meteorology <strong>and</strong> geography contributes to good air quality in<strong>City</strong> <strong>Heights</strong>.Based upon the official FRM sampling, the 24-hour <strong>PM2.5</strong> st<strong>and</strong>ard was exceeded in <strong>City</strong><strong>Heights</strong> on two days during the study (New Year’s Day <strong>and</strong> the following day, when thehighest particulate concentrations are frequently measured in the County). <strong>City</strong> <strong>Heights</strong> hadthe lowest <strong>PM2.5</strong> concentration of all monitoring sites on New Year’s Day, when all sites inSan Diego County exceeded the 24-hour st<strong>and</strong>ard (see Figure 18 <strong>and</strong> Table 8).The <strong>PM2.5</strong> data collected at the <strong>City</strong> <strong>Heights</strong>’ locations exhibit similar patterns to other areasof the County, with concentrations in <strong>City</strong> <strong>Heights</strong> mirrored by concentrations in otherlocales. This indicates a strong correlation to atmospheric conditions <strong>and</strong> regional air qualitypatterns; not a locally-based problem.Similar to other locations in San Diego County, the daily <strong>PM2.5</strong> averages in <strong>City</strong> <strong>Heights</strong> arestrongly influenced by night <strong>and</strong> morning concentrations, where atmospheric stability playsan important role in surface concentrations. During the day, when local traffic, <strong>and</strong> thereforeemissions, is highest, surface concentrations tend to be at their low point in the diurnal cycle.The <strong>PM2.5</strong> measurements in <strong>City</strong> <strong>Heights</strong> are consistent with longer-term measurements inother monitoring sites in San Diego County, falling mid-range between other locations.Along with the rest of San Diego County, <strong>City</strong> <strong>Heights</strong> meets the federal air quality st<strong>and</strong>ardsfor <strong>PM2.5</strong>.- 26 -
San Diego County FRM <strong>PM2.5</strong> <strong>Data</strong> (Interpolated):December 20, 2008, through January 29, 200970.0<strong>PM2.5</strong> (µg/m3)60.050.040.030.020.010.0CVA PM25ECA PM25ESC PM25KMA PM25DTN PM25CES PM2524-Hr Std0.0DateFigure 18.Graph showing the daily <strong>PM2.5</strong> concentrations measured by FederalReference Method (FRM) from December 20, 2008, through January 29, 2009(data are shown in “interpolation” mode so that data for sites on 3-daysampling cycle will be shown).- 27 -