Quarterly Financial Report Q1 2012 - Export Development ... - EDC
Quarterly Financial Report Q1 2012 - Export Development ... - EDC
Quarterly Financial Report Q1 2012 - Export Development ... - EDC
- No tags were found...

You also want an ePaper? Increase the reach of your titles
YUMPU automatically turns print PDFs into web optimized ePapers that Google loves.
<strong>Quarterly</strong> <strong>Financial</strong> <strong>Report</strong> March 31, <strong>2012</strong>Unaudited
TABLE OF CONTENTSMANAGEMENT’S DISCUSSION AND ANALYSISOverview ................................................................................................................................. 1Summary of <strong>Financial</strong> Results ................................................................................................ 2First Quarter Highlights .......................................................................................................... 4<strong>Financial</strong> Results – Year to DatePrior Year Comparison ......................................................................................... 5Corporate Plan Comparison .................................................................................. 6Non-IFRS Performance Measures .......................................................................................... 8Statement of Management Responsibility .............................................................................. 9CONDENSED CONSOLIDATED FINANCIAL STATEMENTSCondensed Consolidated Statement of <strong>Financial</strong> Position ..................................................... 10Condensed Consolidated Statement of Comprehensive Income ............................................ 11Condensed Consolidated Statement of Changes in Equity .................................................... 12Condensed Consolidated Statement of Cash Flows ............................................................... 13Notes to the Condensed Consolidated <strong>Financial</strong> Statements ................................................. 14Note 1. Significant Accounting Policies ......................................................... 14Note 2. Loans Receivable ............................................................................... 15Note 3. Individually Impaired Loans .............................................................. 15Note 4.Allowance for Losses on Loans, Loan Commitments andGuarantees .......................................................................................... 16Note 5. Recoverable Insurance Claims ........................................................... 17Note 6. Policy and Claims Liabilities ............................................................. 17Note 7. Contingent Liabilities ......................................................................... 18Note 8. Loan Revenue..................................................................................... 18Note 9. Interest Expense ................................................................................. 18Note 10. Net Insurance Premiums and Guarantee Fees .................................... 19Note 11. Other Income (Expenses) .................................................................. 19Note 12. Provision for (Reversal of) Credit Losses .......................................... 20Note 13. Claims-Related Expenses ................................................................... 21Note 14. Administrative Expenses .................................................................... 21Note 15. Share Capital ...................................................................................... 21Note 16. Capital Management .......................................................................... 22Note 17. <strong>Financial</strong> Instruments Risk ................................................................. 23Note 18. Related Party Transactions ................................................................. 24Caution regarding forward-looking statementsThis document contains projections and other forward-looking statements regarding future events. Such statementsrequire us to make assumptions and are subject to inherent risks and uncertainties. These may cause actual resultsto differ materially from expectations expressed in the forward-looking statements.
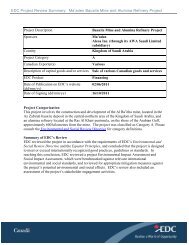
MANAGEMENT’S DISCUSSION AND ANALYSISOVERVIEW<strong>EDC</strong>, Canada's export credit agency, offers innovative commercial solutions to help Canadian exporters andinvestors expand their international business. <strong>EDC</strong> is a Crown corporation, wholly owned by theGovernment of Canada and accountable to Parliament through the Minister of International Trade. Weprovide insurance, financing, bonding products, small business solutions as well as online credit riskmanagement tools to Canadian exporters and investors. Each year 7,800 Canadian companies and theirglobal customers in up to 200 markets worldwide use our knowledge and partnerships. <strong>EDC</strong> is financiallyself-sustaining and does not receive parliamentary appropriations. We generate revenue primarily bycollecting interest on our loans and premiums on our insurance products.For the last three years the Government of Canada temporarily broadened <strong>EDC</strong>’s mandate and scope ofactivity because of the severe and ongoing credit crunch affecting a large number of Canadian businesses.Although the credit conditions are improving, some areas continue to have limited credit availability. In thefirst quarter of <strong>2012</strong>, the Government further extended <strong>EDC</strong>’s domestic powers until March 2013 to supportfurther assessment and consultation with stakeholders on <strong>EDC</strong>’s role in the domestic market. The expandedmandate enables us to provide domestic financing and insurance services, in partnership with private sectorfinancial institutions, credit insurance and surety companies, and with the Business <strong>Development</strong> Bank ofCanada (BDC).Facilitating Integrative Trade(in millions of Canadian dollars)Three months endedMar<strong>2012</strong>Mar2011Financing trade facilitated 2,800 1,940Insurance trade facilitated 17,533 20,029Trade facilitated in emergingmarkets 6,723 6,642$ in millions20,00015,00010,0005,0000DirectFinancingTrade FacilitatedThree months ended Mar 31CreditInsurance<strong>Financial</strong>InstitutionsInsurance2011 <strong>2012</strong>ContractInsuranceandBondingPoliticalRiskInsuranceThe uncertainty and volatility that marked the global economy in 2011 continued into the first quarter of<strong>2012</strong>. Unrest in the Middle East and the European debt crisis are still causes for concern. Despite theuncertainty, we are seeing opportunities for global growth on a number of fronts. Commodity prices remainhigh, U.S. demand continues to move upwards and Canadian trade activity continues to climb. Althoughemerging market growth has softened in some areas, growth in emerging markets still outperforms advancedeconomies.There was strong demand for <strong>EDC</strong>’s financing products in the first quarter and we saw our financing tradefacilitated increase by 44% over the same period in 2011. This translated to net loan disbursements of $750million for the quarter, the highest level of first quarter disbursement activity in four years.Trade facilitated within our insurance portfolio declined by 12% over the same period last year. This waslargely influenced by the timing of business declared by two large customers and a decline in businessdeclared by another large customer.QUARTERLY FINANCIAL REPORT 1
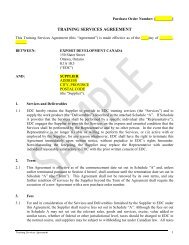
MANAGEMENT’S DISCUSSION AND ANALYSISOur business results also include a significant increase in financing facilitated in emerging markets due to twolarge transactions in Russia and Mexico. However, we experienced only negligible overall growth inemerging markets due to the reduced activity in our insurance program.SUMMARY OF FINANCIAL RESULTS<strong>Financial</strong> PerformanceFor the three months ended(in millions of Canadian dollars)Mar<strong>2012</strong>Dec2011Mar2011Net financing and investment income 247 236 229Net insurance premiums and guarantee fees* 61 66 63308 302 292Other income (expenses) (28) 1 26Administrative expenses 77 82 65Income before provision and claims-relatedexpenses 203 221 253Provision for (reversal of) credit losses (172) 151 (116)Claims-related expenses 11 14 35Net income $364 $56 $334* Includes loan guarantee feesOur income before provisions and claims-related expenses for the first quarter of <strong>2012</strong> was $203 million, inline with the fourth quarter of 2011; however, there was a significant variation in net income between the twoquarters due to provisioning requirements. The impact of updating the probability of default rates used in thecalculation of the allowance for losses on loans resulted in a reversal of provisions in the first quarter of<strong>2012</strong> whereas negative credit migration and the decline in the collateral values associated with our securedaerospace portfolio led to a provision charge in the fourth quarter of 2011.Loan RevenueInterest Expense$ in millions300250200150100500<strong>Q1</strong>2011Q22011RevenueQ32011Q42011Yield (YTD)<strong>Q1</strong><strong>2012</strong>543210%$ in millions50403020100<strong>Q1</strong>2011Q22011ExpenseQ32011Q42011<strong>Q1</strong><strong>2012</strong>Cost of funds (YTD)0.80.70.60.50.40.30.20.10.0%2 EXPORT DEVELOPMENT CANADA
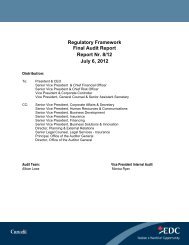
MANAGEMENT’S DISCUSSION AND ANALYSISCredit Insurance PremiumsNet Claims Paid600.30%30$ in millions50403020100.250.200.150.100.05$ in millions201000<strong>Q1</strong>2011Q22011PremiumsQ32011Q42011<strong>Q1</strong><strong>2012</strong>Average Premium Rate YTD0.00-10<strong>Q1</strong>2011Q22011Q32011Q42011<strong>Q1</strong><strong>2012</strong><strong>Financial</strong> Positionas at(in millions of Canadian dollars)Mar<strong>2012</strong>Dec2011Mar2011Total Assets 33,961 33,596 31,450Total Liabilities 25,841 25,340 23,505Equity 8,120 8,256 7,945Gross Loans Receivable 29,440 29,093 26,476Total Allowances 2,379 2,580 2,13535,000Gross Loans ReceivableTotal Allowance as a Percentage of Total FinancingRelated Exposure$ in millions30,00025,00020,00015,00010,0005,0000%642<strong>Q1</strong>2011Q22011Q32011Q42011<strong>Q1</strong><strong>2012</strong>Investment Grade Below Investment Grade Impaired0<strong>Q1</strong>2011Q22011Q32011Q42011<strong>Q1</strong><strong>2012</strong>QUARTERLY FINANCIAL REPORT 3
MANAGEMENT’S DISCUSSION AND ANALYSISRisk ManagementOur business activities expose us to a wide variety of risks including credit, market, operational,organizational, and business risks. Our ability to manage these risks, a key competency within theorganization, is supported by a strong risk culture and an effective risk management approach guided by ourEnterprise Risk Management (ERM) Framework. We manage our risks by seeking to ensure that businessactivities and transactions provide an appropriate balance of return for the risks assumed and remain withinour risk appetite. Refer to Note 17 of the accompanying financial statements for details on financialinstruments risks.We continue to monitor ongoing events in the global financial risk environment and their potential impact onour portfolios and positions. <strong>EDC</strong> remains concerned about a potential market disruption that could resultfrom the default of Greece, or a contagion should it spread to other strained European sovereigns. As a result,we continue to hold increased liquidity by increasing the proportion of our investment portfolio held in U.S.and Canadian Treasury Bills. We continue to observe some areas of retrenchment by European banks as theyare challenged to meet new regulatory requirements around capital solvency and liquidity, which createspockets of need for <strong>EDC</strong>’s support.FIRST QUARTER HIGHLIGHTSNet income was $364 million for the firstquarter of <strong>2012</strong>, compared to $56 million forthe fourth quarter of 2011. A reversal ofprovisions for credit losses contributed to the$308 million increase in income. Income fromthe first quarter of <strong>2012</strong> before provisions andclaims-related expenses was $203 million,similar to the $221 million in the previousquarter.Three months ended(in millions of Canadian dollars)Mar<strong>2012</strong>Dec2011Income before provisions and claimsrelatedexpenses 203 221(Provision)/reversal and claimsrelatedexpenses 161 (165)Net income $364 $56There was a provision reversal of $172 million for the first quarter, of which $156 million was the result ofupdating the probability of default rates used in the calculation of the base allowance. The default rates weredetermined using a new credit risk rating tool; whereas prior to <strong>2012</strong>, default rates were based on a weightedaverage of Moody’s and Standard & Poor’s default tables. In 2011 we initiated a multi-year project to updateand standardize our credit risk rating methodology and processes. This project, which is still ongoing, willresult in an internally based approach for assessing the credit ratings of our obligors and related transactions.Had we updated the probability of default rates in the same manner as previous years there would have been areversal of provisions of $125 million. Use of the new tool contributed an additional $31million to thereversal of provisions.In comparison, we reported a provision charge of $151 million for the fourth quarter of 2011, mainly due tonegative credit migration and a decline in the value of the collateral associated with our secured aerospaceportfolio.We had loan impairments of $212 million in the first quarter, bringing our total individually impaired loanbalance to $1,971 million. Of this amount 70% pertains to the aerospace sector and includes exposure toboth American Airlines, Inc. and Pinnacle Airlines Inc. (Pinnacle Airlines) as discussed on page 57 of our2011 annual report. At the end of 2011, when we classified Pinnacle Airlines as impaired, the airline wasexperiencing financial difficulties. On April 1, <strong>2012</strong>, Pinnacle Airlines filed for Chapter 11 bankruptcyprotection. Our exposure is collateralized by aircraft with an estimated fair value covering 80% of the4 EXPORT DEVELOPMENT CANADA
MANAGEMENT’S DISCUSSION AND ANALYSISoutstanding loan balance. Management is satisfied that we have adequate provisions in place and continuesto monitor the evolving situation.FINANCIAL RESULTS – YEAR TO DATEPrior Year ComparisonOur net income of $364 million for the first quarter of <strong>2012</strong> was $30 million higher than reported for thesame period in 2011. The increase is primarily due to a change in provision requirements in our loansportfolio.We had a reversal of provision for credit losses of $172 million for the first quarter of <strong>2012</strong>, compared to aprovision reversal of $116 million for the same period in 2011. In both years, the main contributor to thereversal was updates made to the independent variables used in the calculation of the allowance. However,the impact of updating the probability of default rates was more significant in <strong>2012</strong>. Refer to Note 12 forfurther details.Other items of note:• Other expenses of $28 million for the first quarter of <strong>2012</strong> compared to other income of $26 million forthe same period in 2011. The variance is largely due to the volatility in the fair values associated with ourfinancial instruments. Refer to Note 11 for further details.• Claims-related expenses for the first quarter of <strong>2012</strong> were $24 million lower when compared to the sameperiod in 2011. There was a $26 million actuarial increase in the net allowance for claims in the firstquarter of 2011 primarily as a result of increased risk in our political risk insurance program.• Loan revenue increased by $20 million when compared to last year. Our larger loan book, combinedwith the impact of higher Libor rates on our floating rate portfolio led to an increase in performing loaninterest revenue. In addition, increased financing activity resulted in higher loan fee revenue. Lastly, werecognized impaired revenue on loans in <strong>2012</strong>, mainly with two airline obligors as a result of re-estimatesof future cash flows. Higher fee and impaired loan revenue contributed to the increase in our total loanyield to 4.04% from last year’s first quarter result of 3.88%.• The net finance margin was 3.21% for the first three months of <strong>2012</strong>, 13 basis points higher than thesame period in 2011 primarily due to higher impaired loan revenue.• Administrative expenses for the first quarter were $77 million, an increase of $12 million over the sameperiod in 2011. We continue our focus on cost containment; however, pension costs increased due tochanges in actuarial assumptions associated with the pension liability. In addition, higher depreciationand accommodation costs associated with our new head office also contributed to the variance.QUARTERLY FINANCIAL REPORT 5
MANAGEMENT’S DISCUSSION AND ANALYSISCorporate Plan ComparisonCondensed Consolidated Statement of Comprehensive Income Summary(in millions of Canadian dollars)Mar <strong>2012</strong>Actual ResultsThree months endedMar <strong>2012</strong>Corporate PlanYear endedDec <strong>2012</strong>Corporate PlanNet financing and investment income 247 228 931Net insurance premiums and guarantee fees* 61 60 271Other expenses (28) (3) (11)Administrative expenses 77 76 303Reversal of provision for credit losses (172) (117) (125)Claims-related expenses 11 24 96Net income 364 302 917Other comprehensive income - - -Comprehensive income $364 $302 $917*Includes loan guarantee feesNet income for the first three months of <strong>2012</strong> was $62 million higher than anticipated in the Corporate Planprimarily due to a change in provisioning requirements for our loans portfolio.The reversal of provision for credit losses of $172 million for the first quarter of <strong>2012</strong> exceeded theprovision reversal projected in the Corporate Plan by $55 million. At the time the <strong>2012</strong> Corporate Plan wasprepared, a provision release of approximately $100 million was anticipated upon the updating of theprobability of default rates. This estimate was derived assuming no change in default rates other than thoserelated to the implementation of the new internal credit risk rating tool. However, the actual impact ofupdating the default rates was $156 million, $125 million of which would have occurred had we updated therates in the same manner as previous years. Use of the new tool increased the provision reversal by anadditional $31 million.Other expenses totalled $28 million (refer to Note 11 for further details) compared to $3 million in theCorporate Plan. The variance is largely the result of changes in market conditions not contemplated in thePlan which impacts the fair values of our financial instruments.Administrative expenses are tracking to Plan for the first quarter of <strong>2012</strong>. However, we anticipate by yearend that we will be over Plan as the impact of updated assumptions on our pension liability was greater thancontemplated at the time of preparing the Corporate Plan. We are forecasting that we will be slightly belowPlan on the remaining expenses.6 EXPORT DEVELOPMENT CANADA
Condensed Consolidated Statement of <strong>Financial</strong> Position Summaryas at(in millions of Canadian dollars)Mar <strong>2012</strong>Actual ResultsMANAGEMENT’S DISCUSSION AND ANALYSISMar <strong>2012</strong>Corporate PlanDec <strong>2012</strong>Corporate PlanCash and marketable securities 3,568 3,216 3,216Derivative instruments 1,591 2,082 2,082Loans receivable 29,050 26,126 27,170Allowance for losses on loans (1,484) (1,296) (1,253)Other financing and leasing assets 696 750 796Other assets 540 624 616Total Assets $33,961 $31,502 $32,627Loans payable 24,140 21,759 22,306Derivative instruments 142 130 130Allowance for losses on loan commitments 42 117 100Policy and claims liabilities* 859 753 787Other liabilities 658 611 557Equity 8,120 8,132 8,747Total Liabilities and Equity $33,961 $31,502 $32,627* Previously referred to as allowance for claims on insurance. Amount also includes deferred insurance premiums which was includedin other liabilities in this table in prior years.Loans receivable were $2.9 billion higher than projected in the Plan mainly due to the following:• The 2011 actual year-end balance was $2.2 billion higher than anticipated at the time of preparing the<strong>2012</strong> Corporate Plan due to higher than forecast net disbursements in 2011 and a weaker Canadiandollar, and• Net loan disbursements in the first quarter of <strong>2012</strong> were $1.1 billion higher than contemplated in thePlan.These impacts were partially offset by a stronger Canadian dollar at the end of March than anticipated in thePlan.Loans payable were $2.4 billion higher than the Corporate Plan amount of $21.8 billion mainly due to thesame factors impacting the loans receivable discussed above. Our borrowing requirements are driven largelyby the activity within our loan portfolio.QUARTERLY FINANCIAL REPORT 7
MANAGEMENT’S DISCUSSION AND ANALYSISNON-IFRS PERFORMANCE MEASURESClaims Ratio – Credit Insurance ProgramThe claims ratio expresses net claims incurred as a percentage of net written premium. Net claims incurredincludes claims paid net of estimated recoveries and changes in actuarial liabilities. This ratio only includesexport credit insurance activities.Reinsurance assumed and ceded reflect various partnerships we have with private insurers and reinsurers inoffering and managing insurance capacity.The change in the claims ratio from 2011 was mainly due to a $1.5 million increase in net claims incurred.The lower net written premium in <strong>2012</strong>, which resulted from the decline in business declared by a few largecustomers as discussed previously, had a minimal impact on the claims ratio.Three months ended(in thousands of Canadian dollars)Mar<strong>2012</strong>Mar2011Direct premiums 28,500 31,907Reinsurance assumed 1,083 1,390Reinsurance ceded (2,477) (2,832)Net written premium $27,106 $30,465Direct net claims incurred 4,214 2,815Net claims incurred – reinsurance assumed 86 -Net claims incurred – reinsurance ceded 6 -Net claims incurred $4,306 $2,815Claims ratio % 15.9% 9.2%8 EXPORT DEVELOPMENT CANADA
STATEMENT OF MANAGEMENT RESPONSIBILITYMANAGEMENT’S DISCUSSION AND ANALYSISManagement is responsible for the preparation and fair presentation of these condensed consolidatedquarterly financial statements in accordance with the Treasury Board of Canada Standard on <strong>Quarterly</strong><strong>Financial</strong> <strong>Report</strong>s for Crown Corporations and for such internal controls as management determines isnecessary to enable the preparation of condensed consolidated quarterly financial statements that are freefrom material misstatement. Management is also responsible for ensuring all other information in thisquarterly financial report is consistent, where appropriate, with the condensed consolidated quarterly financialstatements.These condensed consolidated quarterly financial statements have not been audited or reviewed by anexternal auditor.Based on our knowledge, these unaudited condensed consolidated quarterly financial statements presentfairly, in all material respects, the financial position, results of operations and cash flows of the corporation,as at March 31, <strong>2012</strong> and for the periods presented in the condensed consolidated quarterly financialstatements.Stephen Poloz,President and Chief Executive OfficerKen Kember,Senior Vice-President and Chief <strong>Financial</strong> OfficerOttawa, CanadaMay 2, <strong>2012</strong>QUARTERLY FINANCIAL REPORT 9
CONDENSED CONSOLIDATED FINANCIAL STATEMENTS (UNAUDITED)<strong>Export</strong> <strong>Development</strong> CanadaCondensed Consolidated <strong>Financial</strong> StatementsCONDENSED CONSOLIDATED STATEMENT OF FINANCIAL POSITION(in millions of Canadian dollars)as atMar Dec Mar<strong>2012</strong> 2011 2011AssetsCash 125 90 154Marketable securities:At fair value through profit or loss 3,368 3,720 3,354At amortized cost 75 76 74Derivative instruments 1,591 1,541 2,166Loans receivable (Notes 2 and 3) 29,050 28,680 26,096Allowance for losses on loans (Note 4) (1,484) (1,680) (1,391)Equity financing at fair value through profit or loss 382 385 338Equipment available for lease 52 55 132Net investment in aircraft under finance leases 88 92 95Recoverable insurance claims (Note 5) 41 44 84Reinsurers' share of policy and claims liabilities (Note 6) 126 129 99Other assets 262 174 164Property, plant and equipment 71 74 45Intangible assets 40 40 40Building under finance lease 174 176 -Total Assets $33,961 $33,596 $31,450Liabilities and EquityAccounts payable and other credits 144 159 166Loans payable:Designated at fair value through profit or loss 22,093 21,505 20,044At amortized cost 2,047 2,065 1,987Derivative instruments 142 178 249Obligation under finance lease 176 177 -Retirement benefit obligations75 74 9442 41 48Allowance for losses on loan commitments (Note 4)Policy and claims liabilities (Note 6) 859 875 642Loan guarantees 263 266 27525,841 25,340 23,505Financing commitments (Note 2) and contingent liabilities (Note 7)EquityShare capital (Note 15) 1,333 1,333 1,333Retained earnings 6,787 6,923 6,6128,120 8,256 7,945Total Liabilities and Equity $33,961 $33,596 $31,450The accompanying notes are an integral part of these consolidated financial statementsThese financial statements were approved for issuance by the Board of Directors on May 2, <strong>2012</strong>John RooneyDirectorStephen PolozDirector10 EXPORT DEVELOPMENT CANADA
CONDENSED CONSOLIDATED FINANCIAL STATEMENTS (UNAUDITED)CONDENSED CONSOLIDATED STATEMENT OF COMPREHENSIVE INCOME(in millions of Canadian dollars)For the three months endedMar Dec Mar<strong>2012</strong> 2011 2011Financing and investment revenue:Loan (Note 8) 272 244 252Finance lease 2 2 2Operating lease 3 5 6Debt relief - 2 -Investment 9 11 12Total financing and investment revenue 286 264 272Interest expense (Note 9) 33 21 35Leasing and financing related expenses 6 7 8Net Financing and Investment Income 247 236 229Loan Guarantee Fees 8 8 8Insurance premiums and guarantee fees 55 57 57Reinsurance assumed 3 4 4Reinsurance ceded (5) (3) (6)Net Insurance Premiums and Guarantee Fees (Note 10) 53 58 55Other Income (Expenses) (Note 11) (28) 1 26Administrative Expenses (Note 14) 77 82 65Income before Provision and Claims-Related Expenses 203 221 253Provision for (Reversal of) Credit Losses (Note 12) (172) 151 (116)Claims-Related Expenses (Note 13) 11 14 35Net Income 364 56 334Other comprehensive income - - -Comprehensive Income $364 $56 $334QUARTERLY FINANCIAL REPORT 11
CONDENSED CONSOLIDATED FINANCIAL STATEMENTS (UNAUDITED)CONDENSED CONSOLIDATED STATEMENT OF CHANGES IN EQUITY(in millions of Canadian dollars)For the three months endedMar Dec Mar<strong>2012</strong> 2011 2011Share Capital (Note 15) 1,333 1,333 1,333Retained EarningsBalance beginning of period 6,923 6,867 6,628Comprehensive income 364 56 334Dividend paid (500) - (350)Balance end of period 6,787 6,923 6,612Total Equity at End of Period $8,120 $8,256 $7,94512 EXPORT DEVELOPMENT CANADA
CONDENSED CONSOLIDATED FINANCIAL STATEMENTS (UNAUDITED)CONDENSED CONSOLIDATED STATEMENT OF CASH FLOWS(in millions of Canadian dollars)For the three months endedMar Dec Mar<strong>2012</strong> 2011 2011Cash Flows from (used in) Operating ActivitiesComprehensive income 364 56 334Adjustments to determine net cash from (used in) operating activitiesProvision for (reversal of) credit losses (172) 151 (116)Actuarial change in the allowance for claims on insurance 3 5 26Depreciation and amortization 11 12 13Changes in operating assets and liabilitiesChange in accrued interest and fees receivable (17) 31 (7)Change in fair value of marketable securities 25 24 3Change in fair value of loans payable (8) (105) (24)Change in derivative instruments receivable (31) 134 (97)Change in derivative instruments payable 131 125 228Other (117) 211 (31)Loan disbursements (2,831) (4,057) (2,232)Loan repayments 2,081 2,716 2,190Net cash from (used in) operating activities (561) (697) 287Cash Flows from (used in) Investing ActivitiesEquity financing disbursements (27) (19) (31)Equity financing receipts 20 3 7Finance lease repayments 2 2 2Purchases of marketable securities at fair value through profit or loss (8,853) (10,677) (9,423)Sales/maturities of marketable securities at fair value through profit or loss 9,121 10,845 9,637Purchases of marketable securities at amortized cost - (240) (187)Sales/maturities of marketable securities at amortized cost - 241 132Distribution from investment in joint ventures - - 54Net cash from investing activities 263 155 191Cash Flows from (used in) Financing ActivitiesIssue of long-term loans payable - designated at fair value through profit or loss2,455 2,033 2,002Repayment of long-term loans payable - designated at fair value through profit or loss(2,000) (1,882) (1,448)Issue of short-term loans payable - designated at fair value through profit or loss7,096 6,383 3,593Repayment of short-term loans payable - designated at fair value through profit or loss(6,671) (5,863) (4,182)Change in derivative instruments receivable (19) (109) (59)Change in derivative instruments payable (27) 4 (2)Dividend paid (500) - (350)Net cash from (used in) financing activities 334 566 (446)Effect of exchange rate changes on cash (1) - (2)Net increase (decrease) in cash 35 24 30CashBeginning of period 90 66 124End of period $125 $90 $154Operating Cash Flows from InterestCash paid for interest on loans payable $34 $47 $28Cash received for interest on currency swaps related to capital $16 $18 $17Cash received for interest on loan assets and marketable securities $259 $265 $259QUARTERLY FINANCIAL REPORT 13
CONDENSED CONSOLIDATED FINANCIAL STATEMENTS (UNAUDITED)Notes to the Condensed Consolidated <strong>Financial</strong> Statements1. Significant Accounting PoliciesBasis of PresentationOur condensed consolidated financial statements comply with the Standard on <strong>Quarterly</strong> <strong>Financial</strong> <strong>Report</strong>sfor Crown Corporations issued by the Treasury Board of Canada.These condensed interim consolidated financial statements follow the same accounting policies and methodsof computation as our audited consolidated financial statements for the year ended December 31, 2011 andshould be read in conjunction with the audited consolidated financial statements for the year ended December31, 2011 and the accompanying notes as set out on pages 84-143 of our 2011 Annual <strong>Report</strong>.Use of Judgements and EstimatesThe preparation of financial statements requires the use of judgment and estimates. Judgment is required inthe selection of accounting policies, and their application requires the use of estimates and assumptions toarrive at the reported carrying values of our assets and liabilities. Areas where significant estimates are usedinclude the allowance for losses on loans, loan commitments and guarantees, equipment available for lease,policy and claims liabilities, recoverable insurance claims, retirement benefit obligations and financialinstruments measured at fair value. Refer to page 88 of our 2011 Annual <strong>Report</strong> for details.Future Accounting ChangesThere have been no new standards, interpretations, amendments or improvements issued by the InternationalAccounting Standards Board that impact <strong>EDC</strong> other than disclosed in our audited consolidated financialstatements for the year ended December 31, 2011. However, we have quantified the impact of implementingthe amendment to IAS 19 – Employee Benefits.In June 2011, the International Accounting Standards Board issued an amendment to IAS 19 – EmployeeBenefits. The amendment removes the option to use the corridor method to defer gains and losses; requiresthat the impact of re-measuring pension assets and liabilities be recorded in other comprehensive income; andprovides enhanced disclosure requirements for defined benefit plans. The new requirements will be effectiveJanuary 1, 2013 and must be applied retrospectively. The transition adjustment upon adoption of the amendedstandard will reduce opening retained earnings by $259 million. In addition, <strong>2012</strong> pension expense isexpected to decrease by $5 million in the restated comparatives.14 EXPORT DEVELOPMENT CANADA
CONDENSED CONSOLIDATED FINANCIAL STATEMENTS (UNAUDITED)2. Loans ReceivableMar<strong>2012</strong>Dec2011Mar2011(in millions of Canadian dollars)Performing:Past due 12 28 422011 and beyond 27,457 27,260 25,901Performing gross loans receivable 27,469 27,288 25,943Individually impaired loans (Note 3) 1,971 1,805 533Gross loans receivable 29,440 29,093 26,476Accrued interest and fees receivable 167 145 163Deferred loan revenue and other credits (557) (558) (543)Total loans receivable $29,050 $28,680 $26,096The breakdown of our gross loans receivable by credit grade is as follows:(in millions of Canadian dollars)Mar<strong>2012</strong>Dec2011Mar2011% of% of% of$ total $ total $ totalInvestment grade 12,455 42 11,972 41 10,541 40Below investment grade 15,014 51 15,316 53 15,402 58Individually impaired loans (Note 3) 1,971 7 1,805 6 533 2Total gross loans receivable $29,440 100 $29,093 100 $26,476 100The following table shows our outstanding financing commitments by type:(in millions of Canadian dollars)Mar<strong>2012</strong>Dec2011Mar2011Signed loan commitments 9,616 9,722 8,437Letters of offer 2,126 2,201 2,385Confirmed lines of credit 134 410 377Total financing commitments $11,876 $12,333 $11,1993. Individually Impaired LoansMar<strong>2012</strong>Dec2011Mar2011(in millions of Canadian dollars)Gross loans receivableSovereign 245 248 284Commercial 1,726 1,557 2491,971 1,805 533Less: Deferred loan revenue and other credits 208 205 221Individual allowance 512 422 211Carrying amount of individually impaired loans $1,251 $1,178 $101QUARTERLY FINANCIAL REPORT 15
CONDENSED CONSOLIDATED FINANCIAL STATEMENTS (UNAUDITED)The following reflects the movement in individually impaired gross loans receivable during the period:(in millions of Canadian dollars) <strong>2012</strong> 2011Balance at January 1 1,805 710Loans classified as impaired 212 -Disbursements on loan guarantees called 3 5Principal repayments (22) (10)Principal recoveries from asset sales - (11)Loans written off - (19)Loans reinstated to performing - (129)Foreign exchange translation (27) (13)Balance at March 31 $1,971 $5334. Allowance for Losses on Loans, Loan Commitments and GuaranteesThe composition of the allowance for losses on loans, loan commitments and guarantees is as follows:(in millions of Canadian dollars)Mar<strong>2012</strong>Dec2011Mar2011Base allowanceInvestment grade exposure 63 98 90Non-investment grade exposure 997 1,216 1,182Total base allowance 1,060 1,314 1,272Counterparty concentrationInvestment grade exposure 1 2 1Non-investment grade exposure 63 102 96Total counterparty concentration 64 104 97Total collective allowance 1,124 1,418 1,369Allowance for individually impaired loans, loancommitments and guarantees 608 509 289Total allowance for losses on loans, loan commitmentsand guarantees $1,732 $1,927 $1,658The allowance for losses on loans, loan commitments and guarantees is as follows:(in millions of Canadian dollars)Mar<strong>2012</strong>Dec2011Mar2011Allowance for losses on loans 1,484 1,680 1,391Allowance for losses on loan commitments 42 41 48Allowance for losses on loan guarantees * 206 206 219Total $1,732 $1,927 $1,658* Included in the liability for loan guarantees16 EXPORT DEVELOPMENT CANADA
CONDENSED CONSOLIDATED FINANCIAL STATEMENTS (UNAUDITED)During the period, changes to the allowance for losses on loans, loan commitments and guarantees were asfollows:Mar<strong>2012</strong>(in millions of Canadian dollars)Collective Individual Total Collective IndividualMar2011TotalBalance at beginning of year 1,418 509 1,927 1,560 279 1,839Provision for (reversal of) losses on loans,loan commitments and guarantees (276) 104 (172) (146) 30 (116)Write–offs - - - - (18) (18)Recovery of amounts written-off in prioryears - - - - 1 1Foreign exchange translation (18) (5) (23) (45) (3) (48)Total $1,124 $608 $1,732 $1,369 $289 $1,6585. Recoverable Insurance Claims(in millions of Canadian dollars)Mar<strong>2012</strong>Mar2011Balance at January 1 44 92Claims paid 11 13Claims recovered (6) (11)Change in recoverable portion ofcumulative claims paid (7) (8)Foreign exchange translation (1) (2)Balance at March 31 $ 41 $846. Policy and Claims LiabilitiesThe table below presents our policy and claims liabilities for our credit insurance, contract insurance andbonding and political risk insurance programs.(in millions ofCanadian dollars)Mar<strong>2012</strong>Dec2011Mar2011NetNetNetInsurance Reinsurance liability Insurance Reinsurance liability Insurance Reinsurance liabilityCredit insurance 141 (9) 132 143 (10) 133 196 (21) 175Contract insurance andbonding 105 (2) 103 122 (4) 118 132 - 132Political risk insurance 613 (115) 498 610 (115) 495 314 (78) 236Total $859 $(126) $733 $875 $(129) $746 $642 $(99) $543The policy and claims liabilities are comprised of the following components:(in millions of Canadian dollars)Mar<strong>2012</strong>Dec2011Mar2011Deferred insurance premiums 86 93 66Allowance for claims on insurance 773 782 576Total policy and claims liabilities $859 $875 $642QUARTERLY FINANCIAL REPORT 17
CONDENSED CONSOLIDATED FINANCIAL STATEMENTS (UNAUDITED)7. Contingent LiabilitiesAs explained on page 88 of the 2011 Annual <strong>Report</strong>, we are subject to a limit imposed by the <strong>Export</strong><strong>Development</strong> Act on our contingent liability arrangements. The limit is currently $45.0 billion. Our positionagainst this limit is provided below.(in millions of Canadian dollars)Mar<strong>2012</strong>Dec2011Mar2011Credit insurance 7,892 7,949 7,160<strong>Financial</strong> institutions insurance 6,834 6,824 5,282Contract insurance and bonding 9,148 9,651 9,682Political risk insurance 1,736 1,795 1,840Contingent liabilities – insurance program 25,610 26,219 23,964Loan guarantees 2,601 2,740 2,430Total $28,211 $28,959 $26,3948. Loan RevenueMar<strong>2012</strong>Dec2011Mar2011(in millions of Canadian dollars)Loan interestFloating rate 134 115 116Fixed rate 98 101 110Loan fee revenue 29 26 25Impaired revenue 9 - -Other 2 2 1Total loan revenue $272 $244 $2529. Interest ExpenseMar<strong>2012</strong>Three months endedDec2011Mar2011(in millions of Canadian dollars)Debt designated at fair value through profit or loss andrelated derivativesShort-term debt 8 4 9Long-term debt – floating 27 21 20Long-term debt – fixed (8) (8) (3)Debt carried at amortized costLong-term debt – fixed 20 20 19Total interest expense on debt and related derivatives 47 37 45Interest income on currency swaps related to capital (15) (18) (16)Other 1 2 6Total interest expense $33 $21 $3518 EXPORT DEVELOPMENT CANADA
CONDENSED CONSOLIDATED FINANCIAL STATEMENTS (UNAUDITED)For the first three months of <strong>2012</strong>, our total interest expense was $33 million; a 57% increase from theprevious quarter ended December 2011. Our interest expense on the short-term and long-term floating ratedebt increased as a result of higher funding costs and a larger debt portfolio. Consistent with the increase inapplicable short-term rates, our funding costs increased as our floating rate debt reset to higher rates towardsthe end of 2011.Our interest expense includes not only the cost of the debt issued by <strong>EDC</strong> and the related derivatives; butalso, the impact of the currency swaps used to reduce the foreign currency risk of our capital. These currencyswaps are set up with the objective to offset U.S. dollar assets and liabilities; as a result they include aCanadian dollar receivable component and a U.S. dollar payable component which each carry a floatinginterest rate. The positive spread between the Canadian dollar interest rates applicable to the receivablecomponent of these swaps and the U.S. dollar rates on their payable component decreased during the firstthree months of <strong>2012</strong>; leading to a lower interest revenue on these swaps as they reset.10. Net Insurance Premiums and Guarantee FeesThe following tables present our net insurance premiums and guarantee fee revenue for our credit insurance(CI), financial institutions insurance (FII), contract insurance and bonding (CIB) and political risk insurance(PRI) programs.(in millions ofCanadian dollars)Mar<strong>2012</strong>Three months endedCI FII CIB PRI Total CI FII CIB PRI Total CI FII CIB PRI TotalDec2011Mar2011Direct premiums 29 7 12 7 55 29 9 14 5 57 32 6 13 6 57Reinsurance assumed 1 - 2 - 3 2 - 2 - 4 2 - 2 - 4Reinsurance ceded (2) - (1) (2) (5) (1) - (1) (1) (3) (3) - - (3) (6)Net insurancepremiums andguarantee fees $28 $7 $13 $5 $53 $30 $9 $15 $4 $58 $31 $6 $15 $3 $5511. Other Income (Expenses)Mar<strong>2012</strong>Three months endedDec2011Mar2011(in millions of Canadian dollars)Net unrealized gain on loans payable designatedat fair value20 91 61Net unrealized (loss) on debt related derivatives (22) (85) (50)Net realized and unrealized (loss) on marketablesecurities at fair value through profit or loss (13) - (10)Net realized and unrealized gain (loss) on loanrelated credit default swaps (15) 11 (5)Foreign exchange translation gain (loss) 3 (4) 8Other (1) (12) 22Total other income (expenses) $(28) $1 $26QUARTERLY FINANCIAL REPORT 19
CONDENSED CONSOLIDATED FINANCIAL STATEMENTS (UNAUDITED)We have designated the majority of our long-term debt at fair value through profit or loss in order to obtainthe same accounting treatment as their related derivatives. In general, these derivatives are entered into tomanage interest and foreign exchange rate risks on the related bonds. For the three months ended March31, <strong>2012</strong>, the net realized and unrealized loss on our long-term debt and associated derivatives totalled $2million. In accordance with IFRS, our debt is valued on the basis of our credit rating (AAA) while therelated derivatives are being valued on curves that reflect the credit risk of the resulting exposure. Duringthe first quarter of <strong>2012</strong>, most rates relevant to the valuation of our debt and the related derivatives movedin sync, leading to gains on our bonds which almost offset the losses on our derivatives.We have designated the majority of our marketable securities at fair value through profit or loss; consistentwith our business model for managing these instruments. For the three months ended March 31, <strong>2012</strong>, otherexpense includes a $13 million net realized and unrealized loss on these instruments. Our portfolio includes asignificant portion of U.S. treasury securities and the loss is mainly due to the increase of the relevant U.S.treasury rates during the period.For the first three months of <strong>2012</strong>, we recorded a net unrealized loss of $15 million on our portfolio of loanrelated credit default swaps. The majority of this loss relates to a decrease in the fair value on those swapswhere we bought protection and represents a reversal of the unrealized gains which were recorded in 2011.The gains were due to the increase in the fair value of the instruments as a result of the market uncertaintyassociated with some of the underlying entities. During <strong>2012</strong>, this uncertainty has subsided leading to areduction in their fair value.12. Provision for (Reversal of) Credit LossesThe following tables provide the breakdown of our provision for (reversal of) credit losses recorded withinnet income.Three months ended(in millions of Canadian dollars)Mar<strong>2012</strong>Dec2011Mar2011Changes in portfolio composition* (38) (38) (23)Negative credit migration 24 108 21Updates to independent variables:Updated probability of default rates (156) - (84)Increased concentration threshold (4) - (28)Changes in collateral values 2 90 (1)Changes in estimates of loss emergence period - 14 -Other - (23) (1)Total provision for (reversal of ) credit losses $(172) $151 $(116)* Represents provision requirements (release) as a result of disbursements, new financing volume and repayments.In the first quarter of <strong>2012</strong>, we updated the probability of default assumptions in our allowance calculationresulting in a provision reversal of $156 million. The updated default rates were generated by a new creditrisk rating tool. In prior years, default rates were based on a weighted average of Moody’s and Standard &Poor’s default tables. In 2011 we initiated a multi-year project to update and standardize our credit risk ratingmethodology and processes. This project, which is still ongoing, will result in an internally based approachfor assessing the credit ratings of our obligors. The difference between using our new tool and the approachfrom prior years is a $31 million increase in the reversal of provisions and represents a change in accountingestimate. The impact on future periods has not been determined as it is impracticable to estimate.20 EXPORT DEVELOPMENT CANADA
CONDENSED CONSOLIDATED FINANCIAL STATEMENTS (UNAUDITED)Three months ended(in millions of Canadian dollars)Mar<strong>2012</strong>Dec2011Mar2011Provision for (reversal of) losses on loans (174) 169 (112)Provision for (reversal of) losses on loan commitments 2 (7) (43)Provision for (reversal of) losses on loan guarantees - (11) 39Provision for (reversal of) credit losses $(172) $151 $(116)13. Claims-Related ExpensesThree months endedMar Dec Mar(in millions of Canadian dollars) <strong>2012</strong> 2011 2011Claims paid 11 10 13Claims recovered (6) (5) (11)Actuarial increase in the net allowance for claims 3 5 26Decrease in recoverable insurance claims 2 3 6Claims handling expenses 1 1 1Total claims-related expenses $11 $14 $3514. Administrative ExpensesThree months ended(in millions of Canadian dollars)Mar<strong>2012</strong>Dec2011Mar2011Salaries and benefits 40 38 38Pension, other retirement and postemploymentbenefits 15 7 8Accommodation 7 7 4Amortization and depreciation 7 7 6Other 8 23 9Total administrative expenses $77 $82 $65Retirement benefit obligations included in pension, other retirement and post-employment benefits above:Three months ended(in millions of Canadian dollars)Mar<strong>2012</strong>Dec2011Mar2011Pension benefit expense 11 5 5Other post-employment benefit andseverance expense 4 2 3$15 $7 $815. Share Capital<strong>EDC</strong>’s authorized share capital is $3.0 billion consisting of 30 million shares with a par value of $100 each.The number of shares issued and fully paid is 13.3 million (2011 – 13.3 million). In March <strong>2012</strong>, a dividendof $500 million was paid to the Government of Canada (2011 – $350 million).QUARTERLY FINANCIAL REPORT 21
CONDENSED CONSOLIDATED FINANCIAL STATEMENTS (UNAUDITED)16. Capital Management<strong>EDC</strong> has a capital management process in place to ensure that we are appropriately capitalized and that ourcapital position is identified, measured, managed and regularly reported to the Board of Directors. We are notsubject to externally imposed capital requirements.Our primary objective with respect to capital management is to ensure that <strong>EDC</strong> has adequate capital tosupport the evolving needs of Canadian exporters and investors while remaining financially self-sustaining.The following table represents the breakdown of <strong>EDC</strong>’s supply of capital:(in millions of Canadian dollars)Mar<strong>2012</strong>Dec2011Mar2011Allowance for losses on loans 1,484 1,680 1,391Allowance for losses on loan commitments 42 41 48Allowance for losses on loan guarantees 206 206 219Allowance for claims on insurance 773 782 576Reinsurers’ share of policy and claimsliabilities (126) (129) (99)Share capital 1,333 1,333 1,333Retained earnings 6,787 6,923 6,612Supply of capital $10,499 $10,836 $10,08022 EXPORT DEVELOPMENT CANADA
CONDENSED CONSOLIDATED FINANCIAL STATEMENTS (UNAUDITED)17. <strong>Financial</strong> Instruments RiskThe principal risks that we are exposed to as a result of holding financial instruments, are credit, market andliquidity risk.Credit RiskCredit risk is the risk of loss incurred if a counterparty fails to meet its financial commitments. We areexposed to credit risk on financial instruments under both our lending program and our treasury activities.The following table provides a breakdown, by the country in which the risk resides, of the maximum grossexposure to credit risk of financial instruments. The exposure includes gross loans receivable, loanguarantees, equity financing, investments and derivative assets.(in millions of Canadian dollars)Mar<strong>2012</strong>ExposureDec2011ExposureMar2011ExposureCountry $ % $ % $ %United States 13,494 36 13,894 37 13,149 38Canada 6,633 18 6,651 18 6,001 17Mexico 1,905 5 1,891 5 1,820 5Brazil 1,553 4 1,456 4 947 3India 1,379 4 1,552 4 1,301 4United Kingdom 1,048 3 1,025 3 1,167 3Chile 935 2 960 3 970 3Australia 766 2 750 2 521 1Qatar 751 2 768 2 638 2Spain 673 2 662 1 571 2Other 8,445 22 8,036 21 7,906 22Total $37,582 100 $37,645 100 $34,991 100The concentration of credit risk by industry sector for our financial instruments is as follows:(in millions of Canadian dollars)Mar<strong>2012</strong>ExposureDec2011ExposureMar2011ExposureIndustry $ % $ % $ %Commercial:Aerospace 9,997 27 10,136 27 8,984 26Extractive 7,065 19 6,835 18 5,810 17Surface transportation 4,822 13 4,915 13 4,412 12<strong>Financial</strong> institutions 3,451 9 3,233 9 3,662 11Infrastructure and environment 3,175 8 3,094 8 2,948 8Information andcommunicationtechnology 2,715 7 2,855 8 3,151 9Other 1,860 5 1,804 5 1,731 5Total commercial 33,085 88 32,872 88 30,698 88Sovereign 4,497 12 4,773 12 4,293 12Total $37,582 100 $37,645 100 $34,991 100QUARTERLY FINANCIAL REPORT 23
CONDENSED CONSOLIDATED FINANCIAL STATEMENTS (UNAUDITED)Market RiskMarket risk is the risk that the fair value or future cash flows of a financial instrument will fluctuate becauseof changes in market prices. Market risk comprises three types of risk: foreign exchange risk, interest raterisk and other price risk. We are exposed to potential negative impacts on the value of financial instrumentsresulting from adverse movements in interest and foreign exchange rates. We have policies and procedures inplace to ensure that interest rate and foreign exchange risks are identified, measured, managed and regularlyreported to management and the Board of Directors.Liquidity RiskLiquidity risk is the risk that we would be unable to honour daily cash commitments or the risk that we wouldhave to obtain funds rapidly, possibly at an excessively high premium during severe market conditions. Wemaintain liquidity through a variety of methods such as holding cash and marketable securities and havingaccess to commercial paper markets.Our objectives, policies and processes for managing financial instruments risk as well as the method we useto measure exposure to risk are disclosed within our 2011 annual report in the notes related to our derivativefinancial instruments and debt instruments, as well as in the text and tables displayed in green font inmanagement’s discussion and analysis on pages 67 to 72.18. Related Party TransactionsThe Government of Canada is the sole shareholder of <strong>Export</strong> <strong>Development</strong> Canada. We enter intotransactions with other government departments, agencies and Crown corporations in the normal course ofbusiness, under terms and conditions similar to those that apply to unrelated parties.24 EXPORT DEVELOPMENT CANADA
Corporate RepresentationNationalHead Office<strong>Export</strong> <strong>Development</strong> Canada150 Slater StreetOttawa, ONK1A 1K3Tel: 613-598-2500Fax: 613-598-3811edc.caVancouver1055 Dunsmuir StreetSuite 400, Bentall FourPO Box 49086Vancouver, BCV7X 1G4Tel: 604-638-6950Fax: 604-638-6955Edmonton10180-101 StreetSuite 1150Edmonton, ABT5J 3S4Tel: 780-702-5233Fax: 780-702-5235Calgary308-4th Avenue SWSuite 2403Calgary, ABT2P 0H7Tel: 403-537-9800Fax: 403-817-6701Regina1914 Hamilton StreetSuite 300Regina, SKS4P 3N6Tel: 306-586-1727Fax: 306-586-1725WinnipegCommodity Exchange Tower360 Main StreetSuite 2075Winnipeg, MBR3C 3Z3Tel: 204-975-5090Fax: 204-975-5094Windsor3270 Electricity Dr.Suite 209Walker Industrial ParkWindsor, ONN8W 5J1Tel: 519-974-7674Fax: 519-974-9753London148 Fullarton StreetSuite 1512London, ONN6A 5P3Tel: 519-963-5400Fax: 519-963-5407Mississauga1 City Centre DriveSuite 805Mississauga, ONL5B 1M2Tel: 905-366-0300Fax: 905-366-0332Toronto155 Wellington StreetSuite 3120Toronto, ONM5V 3L3Tel: 416-349-6515Fax: 416-349-6516Drummondville1412 Jean BerchmansMichaud StreetDrummondville, QCJ2C 7V3Tel: 819-475-2587Fax: 819-475-2408Montréal800 Victoria SquareSuite 4520P.O. Box 124, Tour de la BourseMontréal, QCH4Z 1C3Tel: 514-908-9200Fax: 514-878-9891Québec City2875 Laurier BoulevardD-3, Suite 600Québec, QCG1V 2M2Tel: 418-577-7408Fax: 418-577-7419Ville Saint-Laurent9900 Cavendish BoulevardSuite 201Saint-Laurent, QCH4M 2V2Tel: 514-215-7200Fax: 514-215-7201HalifaxSuite 16051969 Upper Water Street,Tower 2Halifax, NSB3J 3R7Tel: 902-442-5205Fax: 902-442-5204Moncton735 Main StreetSuite 400Moncton, NBE1C 1E5Tel: 506-851-6066Fax: 506-851-6406St. John’s90 O’Leary AvenueSt. John’s, NLA1B 2C7Tel: 709-772-8808Fax: 709-772-8693InternationalSao PauloConsulate General of CanadaAv. das Nações Unidas 12901Cenu Torre Norte, Andar 16°CEP 04578-000São Paulo - SP, BrazilTel: (011) 55-11-5509-4320Fax: (011) 55-11-5509-4275Rio de JaneiroCanadian Consulate GeneralAv. Atlantic 1130/5 AnderCopacabanaAtlantica Business CenterRio de Janeiro, BrazilCEP 22021-000Tel: (011) 55-21-2295-0391Fax: (011) 55-21-2275-5735ChileCanadian EmbassyNueva Tajamar481 – 12th floorNorth TowerLas CondesSantiago, ChileTel: (011) 56-2-652-3807Fax: (011) 56-2-652-3808PeruCanadian EmbassyBolognesi 228, MirafloresLima 18, PeruTel: (011) 51-1 319-3385Fax: (011) 51-1 446-6257MexicoCanadian EmbassyCalle Schiller 529Rincón del BosqueColonia PolancoMéxico, D.F. 11580MexicoTel: (011) 52-55-5387-9316Fax: (011) 52-55-5387-9317Consulate of CanadaTorre Gomez Morin 955Piso 4, Suite 404, Col.MontebelloSan Pedro Garza Garcia, N.L.Monterrey, Mexico, CP, 66279Tel: (011) 52-81-8378-0240ext. 3360Fax: (011) 52-81-8356-9965PanamaCanadian EmbassyTorres de las AmericasTower A, 11th FloorPanama City, PanamaTel: (011) 507-294-2527Fax: (011) 507-674-0887GermanyConsulate of Canada –DüsseldorfBenrather Strasse 840213 DüsseldorfGermanyTel: (011) 49-0-211-17217-45Fax: (011) 49-0-211-17217-80TurkeyConsulate of Canada209 Buyukdere CaddesiTekfen Tower – 16th FloorLevent 4, Istanbul34394 TurkeyTel: (011) 90-212-385-9700Fax: (011) 90-212-385-9715RussiaCanadian Embassy23 Starokonyushenny PereulokMoscow, 119002RussiaTel: (011) 7-495-925-6895Fax: (011) 7-495-925-5667Greater ChinaCanadian Consulate GeneralWest Tower Suite 604,Shanghai Centre1376 Nanjing Xi LuShanghai 200040ChinaTel: (011) 86-21-3279-2832Fax: (011) 86-21-3279-2837Canadian Embassy19 Dongzhimenwai StreetChayoang District,Beijing 100600ChinaTel: (011) 86-10-5139-4126Fax: (011) 86-10-5139-4463IndiaCanadian High Commission7/8 ShantipathChanakyanpuriNew Delhi 110021IndiaTel: (011) 91-11-4178-2288Fax: (011) 91-11-4178-2607Consulate General of CanadaFort House6th Floor221, Dr. D.N. RoadMumbai 400 001IndiaTel: (011) 91-22-6749-4480Fax: (011) 91-22-6749-4481SingaporeCanadian High CommissionOne George Street, #11-01Singapore 049145Tel: (011) 65-6854-5949Fax: (011) 65-6854-5848United Arab EmiratesCanadian EmbassyP.O. Box 6970Abu DhabiUnited Arab EmiratesTel: (011) 971-2-694-0376Fax: (011) 971-2-694-0389CoverInside1.4.6.2.5.8.3.7.Rubik’s Cube ® used by permission of Seven Towns Limited. www.rubiks.com1. Courtesy of Empresas CMPC2. © Ocean / Corbis3. © Dinodia Photos / Alamy4. © Radius Images / Alamy5. © Radius Images / Corbis6. Courtesy of ANDRITZ Group7. Courtesy of Magna IV Engineering8. Rubik’s Cube image © Pasieka / Science Photo Library / CorbisPages 4, 6, 8, 30, 40 © Martin LipmanPage 11 © STRINGER/epa/CorbisPage 12 © Keith Dannemiller/CorbisPage 13 Courtesy of ANDRITZ GroupPage 14 Courtesy of Empresas CMPCPage 15 © Ian Trower / Age FotostockPage 16 Courtesy of Magna IV EngineeringPage 17 © Radius Images / AlamyPage 19 © Dinodia Photos / AlamyPage 22 Courtesy of Hyduke EnergyPage 26 © Gleb GombergPage 27 © Teckles PhotographyPage 31 © Bern ChartrandCe document est également disponible en français.Printed in Canada.
edc.ca<strong>EDC</strong> is the owner of trademarks and official marks. Any use of an <strong>EDC</strong> trademark or official mark without written permission is strictly prohibited.All other trademarks appearing in this document are the property of their respective owners. The information presented is subject to change withoutnotice. <strong>EDC</strong> assumes no responsibility for inaccuracies contained herein. Copyright © <strong>2012</strong> <strong>Export</strong> <strong>Development</strong> Canada. All rights reserved.