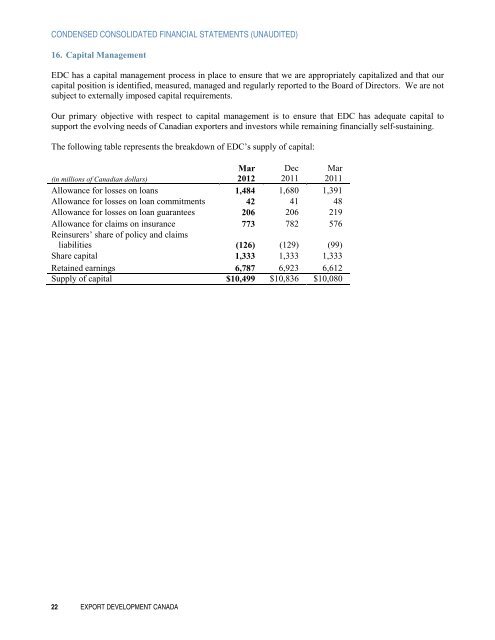
CONDENSED CONSOLIDATED FINANCIAL STATEMENTS (UNAUDITED)16. Capital Management<strong>EDC</strong> has a capital management process in place to ensure that we are appropriately capitalized and that ourcapital position is identified, measured, managed and regularly reported to the Board of Directors. We are notsubject to externally imposed capital requirements.Our primary objective with respect to capital management is to ensure that <strong>EDC</strong> has adequate capital tosupport the evolving needs of Canadian exporters and investors while remaining financially self-sustaining.The following table represents the breakdown of <strong>EDC</strong>’s supply of capital:(in millions of Canadian dollars)Mar<strong>2012</strong>Dec2011Mar2011Allowance for losses on loans 1,484 1,680 1,391Allowance for losses on loan commitments 42 41 48Allowance for losses on loan guarantees 206 206 219Allowance for claims on insurance 773 782 576Reinsurers’ share of policy and claimsliabilities (126) (129) (99)Share capital 1,333 1,333 1,333Retained earnings 6,787 6,923 6,612Supply of capital $10,499 $10,836 $10,08022 EXPORT DEVELOPMENT CANADA
CONDENSED CONSOLIDATED FINANCIAL STATEMENTS (UNAUDITED)17. <strong>Financial</strong> Instruments RiskThe principal risks that we are exposed to as a result of holding financial instruments, are credit, market andliquidity risk.Credit RiskCredit risk is the risk of loss incurred if a counterparty fails to meet its financial commitments. We areexposed to credit risk on financial instruments under both our lending program and our treasury activities.The following table provides a breakdown, by the country in which the risk resides, of the maximum grossexposure to credit risk of financial instruments. The exposure includes gross loans receivable, loanguarantees, equity financing, investments and derivative assets.(in millions of Canadian dollars)Mar<strong>2012</strong>ExposureDec2011ExposureMar2011ExposureCountry $ % $ % $ %United States 13,494 36 13,894 37 13,149 38Canada 6,633 18 6,651 18 6,001 17Mexico 1,905 5 1,891 5 1,820 5Brazil 1,553 4 1,456 4 947 3India 1,379 4 1,552 4 1,301 4United Kingdom 1,048 3 1,025 3 1,167 3Chile 935 2 960 3 970 3Australia 766 2 750 2 521 1Qatar 751 2 768 2 638 2Spain 673 2 662 1 571 2Other 8,445 22 8,036 21 7,906 22Total $37,582 100 $37,645 100 $34,991 100The concentration of credit risk by industry sector for our financial instruments is as follows:(in millions of Canadian dollars)Mar<strong>2012</strong>ExposureDec2011ExposureMar2011ExposureIndustry $ % $ % $ %Commercial:Aerospace 9,997 27 10,136 27 8,984 26Extractive 7,065 19 6,835 18 5,810 17Surface transportation 4,822 13 4,915 13 4,412 12<strong>Financial</strong> institutions 3,451 9 3,233 9 3,662 11Infrastructure and environment 3,175 8 3,094 8 2,948 8Information andcommunicationtechnology 2,715 7 2,855 8 3,151 9Other 1,860 5 1,804 5 1,731 5Total commercial 33,085 88 32,872 88 30,698 88Sovereign 4,497 12 4,773 12 4,293 12Total $37,582 100 $37,645 100 $34,991 100QUARTERLY FINANCIAL REPORT 23