Variable permittivity dielectric material loaded stepped-horn antenna
Variable permittivity dielectric material loaded stepped-horn antenna
Variable permittivity dielectric material loaded stepped-horn antenna

You also want an ePaper? Increase the reach of your titles
YUMPU automatically turns print PDFs into web optimized ePapers that Google loves.
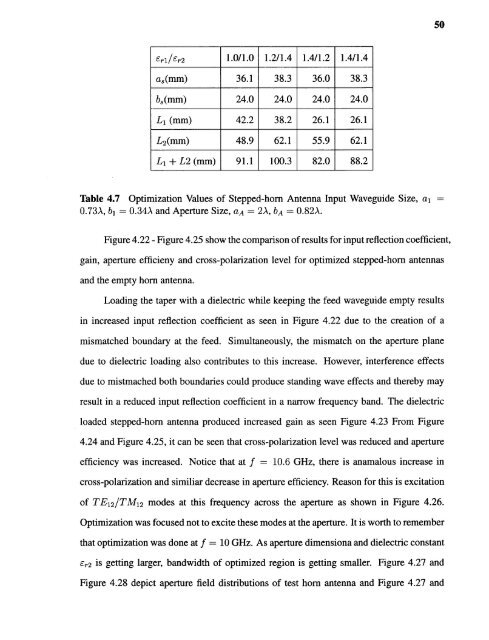
50Table 4.7 Optimization Values of Stepped-<strong>horn</strong> Antenna Input Waveguide Size, al =0.73A, b 1 = 0.34A and Aperture Size, aA = 2A, bA = 0.82A.Figure 4.22 - Figure 4.25 show the comparison of results for input reflection coefficient,gain, aperture efficieny and cross-polarization level for optimized <strong>stepped</strong>-<strong>horn</strong> <strong>antenna</strong>sand the empty <strong>horn</strong> <strong>antenna</strong>.Loading the taper with a <strong>dielectric</strong> while keeping the feed waveguide empty resultsin increased input reflection coefficient as seen in Figure 4.22 due to the creation of amismatched boundary at the feed. Simultaneously, the mismatch on the aperture planedue to <strong>dielectric</strong> loading also contributes to this increase. However, interference effectsdue to mistmached both boundaries could produce standing wave effects and thereby mayresult in a reduced input reflection coefficient in a narrow frequency band. The <strong>dielectric</strong><strong>loaded</strong> <strong>stepped</strong>-<strong>horn</strong> <strong>antenna</strong> produced increased gain as seen Figure 4.23 From Figure4.24 and Figure 4.25, it can be seen that cross-polarization level was reduced and apertureefficiency was increased. Notice that at f = 10.6 GHz, there is anamalous increase incross-polarization and similiar decrease in aperture efficiency. Reason for this is excitationof TE12/TM12² modes at this frequency across the aperture as shown in Figure 4.26.Optimization was focused not to excite these modes at the aperture. It is worth to rememberthat optimization was done at f = 10 GHz. As aperture dimensiona and <strong>dielectric</strong> constantεr2 is getting larger, bandwidth of optimized region is getting smaller. Figure 4.27 andFigure 4.28 depict aperture field distributions of test <strong>horn</strong> <strong>antenna</strong> and Figure 4.27 and