

PRUEBAS
PRUEBAS
PRUEBAS

You also want an ePaper? Increase the reach of your titles
YUMPU automatically turns print PDFs into web optimized ePapers that Google loves.
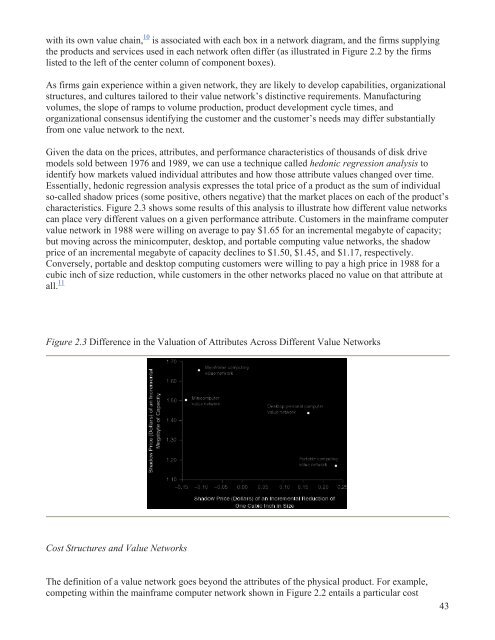
with its own value chain, 10 is associated with each box in a network diagram, and the firms supplyingthe products and services used in each network often differ (as illustrated in Figure 2.2 by the firmslisted to the left of the center column of component boxes).As firms gain experience within a given network, they are likely to develop capabilities, organizationalstructures, and cultures tailored to their value network’s distinctive requirements. Manufacturingvolumes, the slope of ramps to volume production, product development cycle times, andorganizational consensus identifying the customer and the customer’s needs may differ substantiallyfrom one value network to the next.Given the data on the prices, attributes, and performance characteristics of thousands of disk drivemodels sold between 1976 and 1989, we can use a technique called hedonic regression analysis toidentify how markets valued individual attributes and how those attribute values changed over time.Essentially, hedonic regression analysis expresses the total price of a product as the sum of individualso-called shadow prices (some positive, others negative) that the market places on each of the product’scharacteristics. Figure 2.3 shows some results of this analysis to illustrate how different value networkscan place very different values on a given performance attribute. Customers in the mainframe computervalue network in 1988 were willing on average to pay $1.65 for an incremental megabyte of capacity;but moving across the minicomputer, desktop, and portable computing value networks, the shadowprice of an incremental megabyte of capacity declines to $1.50, $1.45, and $1.17, respectively.Conversely, portable and desktop computing customers were willing to pay a high price in 1988 for acubic inch of size reduction, while customers in the other networks placed no value on that attribute atall. 11Figure 2.3 Difference in the Valuation of Attributes Across Different Value NetworksCost Structures and Value NetworksThe definition of a value network goes beyond the attributes of the physical product. For example,competing within the mainframe computer network shown in Figure 2.2 entails a particular cost43