Have the Southern Westerlies changed in a zonally symmetric ...
Have the Southern Westerlies changed in a zonally symmetric ...
Have the Southern Westerlies changed in a zonally symmetric ...

You also want an ePaper? Increase the reach of your titles
YUMPU automatically turns print PDFs into web optimized ePapers that Google loves.
Quaternary International 253 (2012) 32e46Contents lists available at ScienceDirectQuaternary Internationaljournal homepage: www.elsevier.com/locate/qua<strong>in</strong>t<strong>Have</strong> <strong>the</strong> Sou<strong>the</strong>rn <strong>Westerlies</strong> <strong>changed</strong> <strong>in</strong> a <strong>zonally</strong> <strong>symmetric</strong> manner over <strong>the</strong>last 14,000 years? A hemisphere-wide take on a controversial problemMichael-Shawn Fletcher a, *, Patricio Iván Moreno a,ba Institute of Ecology and Biodiversity, University of Chile, Santiago, Chileb Department of Ecological Sciences, University of Chile, Santiago, Chilearticle<strong>in</strong>foabstractArticle history:Available onl<strong>in</strong>e 10 May 2011The prevail<strong>in</strong>g view <strong>in</strong> <strong>the</strong> palaeoclimate literature of <strong>the</strong> last 20 years is that <strong>the</strong> Sou<strong>the</strong>rn WesterlyW<strong>in</strong>ds (SWW) were <strong>in</strong>tensified over sou<strong>the</strong>rn Australia and Tasmania dur<strong>in</strong>g <strong>the</strong> warmer-than-presentearly Holocene (11e8 ka). At similar latitudes on <strong>the</strong> opposite side of <strong>the</strong> sou<strong>the</strong>rn mid-latitudes,palaeoclimate studies have suggested a poleward shift of <strong>the</strong> nor<strong>the</strong>rn edge of <strong>the</strong> westerlies andfocus<strong>in</strong>g at 49 S <strong>in</strong> sou<strong>the</strong>rn South America. This zonal asymmetry contrasts with <strong>the</strong> modern day zonalsymmetry displayed by <strong>the</strong> SWW and poses a formidable challenge to an understand<strong>in</strong>g of <strong>the</strong> modes ofclimatic variability of <strong>the</strong> sou<strong>the</strong>rn extra-tropics. This paper presents an updated syn<strong>the</strong>sis of cont<strong>in</strong>uous,radiocarbon-dated palaeoenvironmental data from <strong>the</strong> westerlies zone of <strong>in</strong>fluence <strong>in</strong> all Sou<strong>the</strong>rnHemisphere cont<strong>in</strong>ents. Synchronous multi-millennial trends <strong>in</strong> moisture, vegetation, fire, and hydrologicbalance are remarkably consistent with <strong>the</strong> way <strong>the</strong> SWW changes impact upon <strong>the</strong> climate <strong>in</strong>Sou<strong>the</strong>rn Hemisphere landmasses <strong>in</strong> <strong>the</strong> modern climate. Consider<strong>in</strong>g <strong>the</strong> modern relationships betweenlocal precipitation and zonal w<strong>in</strong>d speeds, it is suggested that <strong>the</strong> SWW <strong>changed</strong> <strong>in</strong> a <strong>zonally</strong> <strong>symmetric</strong>manner at multi-millennial scale between 14 and 5 ka. Regional asymmetry develops after 5 ka across<strong>the</strong> Sou<strong>the</strong>rn Hemisphere, with a pattern of precipitation anomalies ak<strong>in</strong> to <strong>the</strong> modern function<strong>in</strong>g of ElNiño e Sou<strong>the</strong>rn Oscillation, which started w6200 years ago.Ó 2011 Elsevier Ltd and INQUA. All rights reserved.1. IntroductionThe absence of major topographic barriers <strong>in</strong> <strong>the</strong> Sou<strong>the</strong>rnHemisphere middle latitudes allows <strong>the</strong> development of stronglyzonal atmospheric and oceanic circulation patterns, i.e. <strong>the</strong>Sou<strong>the</strong>rn Westerly W<strong>in</strong>ds (SWW) and <strong>the</strong> Antarctic Circum-PolarCurrent. The modern Sou<strong>the</strong>rn Westerly W<strong>in</strong>ds are a strik<strong>in</strong>gly<strong>symmetric</strong> component of <strong>the</strong> climate system that dictate <strong>the</strong>climate of all Sou<strong>the</strong>rn Hemisphere landmasses south of w30 S(Garreaud, 2007), and also govern nutrient, heat, and gas fluxesbetween surface and deep oceanic water masses <strong>in</strong> <strong>the</strong> Sou<strong>the</strong>rnOcean and <strong>the</strong> atmosphere.Recent research has led to <strong>the</strong> realisation that <strong>the</strong> SWW mayhave played a key role <strong>in</strong> <strong>the</strong> generation of past atmospheric CO 2variations, establish<strong>in</strong>g a conduit for <strong>in</strong>ter-hemispheric propagationof palaeoclimate signals dur<strong>in</strong>g ice-age term<strong>in</strong>ations(Toggweiler et al., 2006; Anderson et al., 2009; Toggweiler, 2009;* Correspond<strong>in</strong>g author.E-mail addresses: michael.fletcher@u.uchile.cl, michael.fletcher@live.com.au(M.-S. Fletcher).Denton et al., 2010) and <strong>the</strong> Holocene (Moreno et al., 2010;Fletcher and Moreno, 2011). Despite this importance, <strong>the</strong>re arefew chronologies of past variations of <strong>the</strong> SWW that span <strong>the</strong>irentire zone of <strong>in</strong>fluence dur<strong>in</strong>g and s<strong>in</strong>ce <strong>the</strong> Last Glacial Maximum(LGM). The current understand<strong>in</strong>g relies on local, regional and subcont<strong>in</strong>entalscale palaeoenvironmental reconstructions (e.g.Markgraf et al., 1992; Harrison, 1993; Shulmeister et al., 2004; Gilliet al., 2005a, b; Moreno et al., 2010) and meridionally alignedtransects (e.g. Markgraf et al., 2000; Ono et al., 2004; Turney et al.,2006a), with little attempt to <strong>in</strong>tegrate data from across <strong>the</strong> entirewesterly w<strong>in</strong>d zone of <strong>in</strong>fluence (Heusser, 1989a). As a consequence,understand<strong>in</strong>g of hemisphere-wide westerly changethrough <strong>the</strong> Quaternary <strong>in</strong> <strong>the</strong> Sou<strong>the</strong>rn Hemisphere is largelypiecemeal, often contradictory and is <strong>the</strong> source of considerablediscussion <strong>in</strong> <strong>the</strong> palaeoclimate literature (Heusser, 1989a, b;Markgraf, 1989; Markgraf et al., 1992; Harrison and Dodson, 1993;Dodson, 1998; Shulmeister, 1999; Shulmeister et al., 2004; Lamyet al., 2010; Moreno et al., 2010; Fletcher and Moreno, 2011).Controversy and debate are <strong>in</strong>evitable products of scientificendeavour and, <strong>in</strong>deed, it could be argued that <strong>the</strong> basic tenet offalsification encourages researchers to enterta<strong>in</strong> controversial, or,perhaps more correctly, adversarial positions <strong>in</strong> order to produce1040-6182/$ e see front matter Ó 2011 Elsevier Ltd and INQUA. All rights reserved.doi:10.1016/j.qua<strong>in</strong>t.2011.04.042
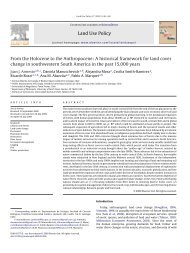
M.-S. Fletcher, P.I. Moreno / Quaternary International 253 (2012) 32e46 33robust scientific <strong>the</strong>ory. Perhaps <strong>the</strong> most visible controversy perta<strong>in</strong><strong>in</strong>gto <strong>the</strong> SWW through <strong>the</strong> Quaternary regards <strong>the</strong>ir behaviourdur<strong>in</strong>g <strong>the</strong> Last Glacial Maximum (LGM). The oppos<strong>in</strong>g camps<strong>in</strong> <strong>the</strong> palaeoclimate literature argue for ei<strong>the</strong>r a sou<strong>the</strong>rly/polewarddisplacement (e.g. Markgraf, 1987, 1989; Markgraf et al., 1992;Harrison and Dodson, 1993; Markgraf, 1993; Dodson, 1998);a nor<strong>the</strong>rly/equatorward displacement (e.g. Nicholson and Flohn,1980; Heusser, 1989b; Lamy et al., 1999; Moreno et al., 1999;Holmgren et al., 2003; Ono et al., 2004; Shulmeister et al., 2004;Fletcher and Thomas, 2010b); or little, if any, change of <strong>the</strong> meanlatitud<strong>in</strong>al position of <strong>the</strong> SWW relative to today (Wyrwoll et al.,2000; Hesse et al., 2004; Rojas et al., 2009). To date, this issue isstill a matter of discussion and consensus rema<strong>in</strong>s elusive.A less adversarial, but not less contentious issue prevailsbetween models of SWW change through <strong>the</strong> late Pleistocene andHolocene. Dur<strong>in</strong>g <strong>the</strong> early Holocene <strong>in</strong>terval (ca.11,000e8000 cal ka), for example, arguments exist for botha northward displacement and/or streng<strong>the</strong>n<strong>in</strong>g of <strong>the</strong> westerlies<strong>in</strong> sou<strong>the</strong>rn South America (west of <strong>the</strong> Andes around 30 S) (Veit,1996) and Australia (e.g. Harrison and Dodson, 1993; Dodson,1998; G<strong>in</strong>gele et al., 2007; Moros et al., 2009); and a southwarddisplacement and/or weaken<strong>in</strong>g of <strong>the</strong> SWW <strong>in</strong> southwest SouthAmerica (below 32 S) (Jenny et al., 2003; Moreno and Leon, 2003;Moreno, 2004; Villa-Mart<strong>in</strong>ez and Moreno, 2007; Lamy et al.,2010; Moreno et al., 2010), New Zealand (Shulmeister, 1999;McGlone et al., 2000; Shulmeister et al., 2004), Africa (Holmgrenet al., 2003) and Australia (Shulmeister, 1999). The mid Holocene(ca. 7e5 ka) is equally contradictory, with arguments for a northwarddisplacement and/or <strong>in</strong>creased <strong>in</strong>tensity of westerly flow(relative to <strong>the</strong> early Holocene ca. 11e7 ka) <strong>in</strong> sou<strong>the</strong>rn SouthAmerica (Jenny et al., 2003; Moreno, 2004; Moreno et al., 2010),New Zealand (Shulmeister et al., 2004), Australia (Shulmeister,1999; Fletcher and Thomas, 2010b) andAfrica(Holmgren et al.,2003); and a southward displacement and/or weaker <strong>in</strong>tensityof westerly flow (relative to <strong>the</strong> early Holocene) <strong>in</strong> Australia(Harrison and Dodson, 1993; Moros et al., 2009) and Africa(Nicholson and Flohn, 1980). Accord<strong>in</strong>gly, it is not possible to drawa clear conclusion from <strong>the</strong> palaeoclimate literature as to whe<strong>the</strong>rchanges <strong>in</strong> <strong>the</strong> SWW dur<strong>in</strong>g or s<strong>in</strong>ce <strong>the</strong> LGM have been <strong>zonally</strong><strong>symmetric</strong>, nor is it possible to draw consensus on <strong>the</strong> direction ofwesterly change. The lack of resolve over <strong>the</strong> behaviour of <strong>the</strong>SWW through <strong>the</strong> last glaciale<strong>in</strong>terglacial cycle is, given <strong>the</strong>irimportance <strong>in</strong> regional and global climate systems, an AchillesHeel to attempts at understand<strong>in</strong>g and predict<strong>in</strong>g regional andglobal climate dynamics.A basic premise <strong>in</strong> <strong>the</strong>se studies is <strong>the</strong> correlation between localprecipitation and zonal w<strong>in</strong>d speeds, which holds true for severalparts of <strong>the</strong> sou<strong>the</strong>rn mid-latitudes <strong>in</strong> <strong>the</strong> modern climate (Fig. 1)and which is important <strong>in</strong> a palaeoclimatic context, as it suggeststhat palaeohydrological reconstructions from regions with<strong>in</strong> <strong>the</strong>Sou<strong>the</strong>rn Westerly zone of <strong>in</strong>fluence may proxy relative westerlyw<strong>in</strong>d <strong>in</strong>fluence. A complicat<strong>in</strong>g factor <strong>in</strong> <strong>the</strong> <strong>in</strong>terpretation ofpalaeohydrological changes, though, is that this relationship mayhave <strong>changed</strong> its strength or sign <strong>in</strong> some regions s<strong>in</strong>ce <strong>the</strong> LGM, orthat o<strong>the</strong>r moisture sources not as important <strong>in</strong> <strong>the</strong> modernhydrologic balance could have had more importance <strong>in</strong> <strong>the</strong> past.Identify<strong>in</strong>g <strong>the</strong>se non-stationarities require an array of detailedrecords, unavailable for most regions today.Fig. 1. Maps show<strong>in</strong>g (a) <strong>the</strong> location of sites and boundary currents mentioned <strong>in</strong> <strong>the</strong> text and (b) <strong>the</strong> local correlation between zonal w<strong>in</strong>d strength and precipitation from <strong>the</strong>equator to 80 S (scale bar <strong>in</strong>dicates <strong>the</strong> strength of correlation; Garreaud, 2007). BC e Benguela Current; AC e Agulhas Current; LC e Leeuw<strong>in</strong> Current; HC e Humboldt Current.Note <strong>the</strong> anti-phased precipitation response to westerly w<strong>in</strong>d speed between west fac<strong>in</strong>g and east fac<strong>in</strong>g coasts <strong>in</strong> all Sou<strong>the</strong>rn Hemisphere landmasses. The grey arrows <strong>in</strong>dicate<strong>the</strong> approximate latitude of maximum westerly w<strong>in</strong>d speed (50 S). Site list: 1 e Western Cape region of South Africa; 2 e Mataputaland, South Africa; 3 e ocean core MD03-2611;4 e Southwest Victoria, Australia; 5 e Western Tasmania, Australia; 6 e Eastern Tasmania, Australia; 7 e Lake George, sou<strong>the</strong>ast Australia; 8 e Okarito Bog, South Island, NewZealand; 9 e Otago, South Island, New Zealand; 10 e Laguna Acuelo, Chile; 11 e Lago Condorito, Chile; 12 e Lago Cardiel, Argent<strong>in</strong>a; 13 e Lago Guanaco, Chile; 14 e Lago Tamar,Chile; 15 e Gran Campo-2, Chile; 16 e Laguna Potrok Aike, Argent<strong>in</strong>a.
34M.-S. Fletcher, P.I. Moreno / Quaternary International 253 (2012) 32e46This paper syn<strong>the</strong>sises and analyses palaeoenvironmental datafrom areas located with<strong>in</strong> <strong>the</strong> SWW zone of <strong>in</strong>fluence <strong>in</strong> Africa,sou<strong>the</strong>rn Australia, New Zealand and sou<strong>the</strong>rn South America(Fig. 1a). It specifically aims to address <strong>the</strong> follow<strong>in</strong>g questions: (1)are coherent, multi-millennial scale changes <strong>in</strong> <strong>the</strong> SWW <strong>in</strong>ferablefrom palaeoenvironmental data?; (2) are multi-millennial scalechanges <strong>in</strong> palaeohydrology <strong>in</strong> Sou<strong>the</strong>rn Hemisphere landmassesconsistent with <strong>the</strong> modern relationship between westerly w<strong>in</strong>dspeed and precipitation?; (3) have multi-millennial scale changes<strong>in</strong> <strong>the</strong> Sou<strong>the</strong>rn <strong>Westerlies</strong> been <strong>zonally</strong> <strong>symmetric</strong> over <strong>the</strong> last14,000 years?; and (4) how relevant are SWW changes for understand<strong>in</strong>gvariations <strong>in</strong> <strong>the</strong> CO 2 content of <strong>the</strong> atmosphere dur<strong>in</strong>gand s<strong>in</strong>ce <strong>the</strong> LGM?2. Sou<strong>the</strong>rn Australia2.1. Present environmentThe climate of Australia is dom<strong>in</strong>ated by <strong>the</strong> sub-tropical highpressure system associated with <strong>the</strong> cool and dry descend<strong>in</strong>g air of<strong>the</strong> Hadley Cell (Sturman and Tapper, 2006). In <strong>the</strong> south of Australia,<strong>the</strong> sub-tropical high pressure system <strong>in</strong>teracts with <strong>the</strong> SWW andan <strong>in</strong>creas<strong>in</strong>gly cooler w<strong>in</strong>ter ra<strong>in</strong> climate prevails toward <strong>the</strong> south.On west fac<strong>in</strong>g coasts <strong>in</strong> sou<strong>the</strong>rn Australia (e.g. southwest Victoriaand southwest Western Australia; Fig. 1a), seasonal (w<strong>in</strong>ter) <strong>in</strong>cursionsof <strong>the</strong> SWW result <strong>in</strong> a Mediterranean type climate (Sturmanand Tapper, 2006). Summer moisture delivered by easterly w<strong>in</strong>dsorig<strong>in</strong>at<strong>in</strong>g from <strong>the</strong> Pacific Ocean provides an additional source ofprecipitation along <strong>the</strong> sou<strong>the</strong>ast Australian coast and GreatDivid<strong>in</strong>g Range, result<strong>in</strong>g <strong>in</strong> a temperate summer-ra<strong>in</strong> climate. Thestrength of this moisture advection is <strong>in</strong>fluenced by changes <strong>in</strong>westerly flow at seasonal and <strong>in</strong>terannual timescales (Hendon et al.,2007). The cont<strong>in</strong>ental island of Tasmania (41e44 S; Fig. 1a) lies <strong>in</strong><strong>the</strong> path of <strong>the</strong> SWW year-round and is bisected by a nor<strong>the</strong>astesouthwestmounta<strong>in</strong> range. Orographic uplift of <strong>the</strong> SWW overTasmania results <strong>in</strong> a hyper-humid west and sub-humid conditions<strong>in</strong> central and eastern regions as westerly foehn w<strong>in</strong>ds strip moistureand negate <strong>in</strong>cursions of easterly moisture (Gentilli, 1972;Sturman and Tapper, 2006; Hill et al., 2009).The entire eastern coast of ma<strong>in</strong>land Australia and <strong>the</strong> westcoast of Tasmania are climatically suited to <strong>the</strong> development ofra<strong>in</strong>forest vegetation. A diverse array of vegetation types dom<strong>in</strong>atedby Eucalyptus species prevails across much of <strong>the</strong> Australiancont<strong>in</strong>ent (from <strong>the</strong> monsoonal tropics to temperate, Mediterranean,and arid regions) and are dependent on vary<strong>in</strong>g <strong>in</strong>teractionsbetween climate, soils and fire regime. Fire is a key factor <strong>in</strong> <strong>the</strong>vegetation landscape of Australia with, for example, fire be<strong>in</strong>gimplicated as <strong>the</strong> only factor capable for expla<strong>in</strong><strong>in</strong>g <strong>the</strong> contemporary(restricted) distribution of Australian ra<strong>in</strong>forests (Bowman,2000). Australia has a well developed Mediterranean flora, particularly<strong>in</strong> southwest Western Australia, that is characterised bya very diverse array of scleromorphic shrubs that give way to aridzone vegetation as ra<strong>in</strong>fall decreases fur<strong>the</strong>r.2.2. Palaeoenvironmental records2.2.1. Lake-levels2.2.1.1. Southwest Victoria. Ra<strong>in</strong>fall <strong>in</strong> southwest Victoria (38 S;Fig. 1a) is delivered almost exclusively by <strong>the</strong> SWW and is positivelycorrelated with near-surface zonal w<strong>in</strong>d speeds <strong>in</strong> <strong>the</strong> modernclimate (Fig. 1b). Lake-level reconstructions from closed-bas<strong>in</strong> lakes<strong>in</strong> southwest Victoria have enabled a reconstruction of effectiveprecipitation spann<strong>in</strong>g <strong>the</strong> last 10,000 years that proxies westerlyderived moisture (Bowler and Hamada, 1971; Harrison and Dodson,1993; Jones et al., 1998). A marked <strong>in</strong>crease <strong>in</strong> effectiveprecipitation occurs <strong>in</strong> <strong>the</strong> region after 9.5 ka (Fig. 2g), driv<strong>in</strong>g highlake-levels that persist until 6 ka (Fig. 2f), after which lake-levelsdrop substantially. Low and variable values of effective precipitationcharacterise <strong>the</strong> period after 3 ka (Fig. 2g), with Lake Keilambete<strong>in</strong> southwest Victoria display<strong>in</strong>g a lake-level m<strong>in</strong>imumbetween 3 and 2 ka, an <strong>in</strong>crease after 2 ka, and a decl<strong>in</strong>e s<strong>in</strong>ce <strong>the</strong>18th century (Fig. 2f).2.2.1.2. Tasmania. The Tasmanian regional lake-level reconstructionpublished by Harrison and Dodson (1993) is dom<strong>in</strong>ated bylakes located <strong>in</strong> central and eastern Tasmania (41e44 S; Fig. 1a),regions <strong>in</strong> which ra<strong>in</strong>fall is negatively correlated with westerlyw<strong>in</strong>d speed <strong>in</strong> <strong>the</strong> modern climate (Fig. 1b; Hendon et al., 2007; Hillet al., 2009). The lake-level syn<strong>the</strong>sis shows a low percentage oflakes full between 14e12 ka and 7e5 ka, a high percentage of lakesfull between 11 and 8 ka, and little change s<strong>in</strong>ce 5 ka (Fig. 2b). LakeVera is <strong>the</strong> only lake located <strong>in</strong> <strong>the</strong> western hyper-humid zoneFig. 2. Palaeoenvironmental data from sou<strong>the</strong>rn Australia plotted on a calendar yearBP timescale: (a) Lake George composite lake-level curve (Site 7, Fig. 1a; De Deckker,1982; S<strong>in</strong>gh and Geissler, 1985; Fitzsimmons and Barrows, 2010); (b) eastern andcentral Tasmanian lake-level curve (Site 6, Fig. 1a; Harrison and Dodson, 1993); (c) LakeVera stratigraphy (Site 5, Fig. 1a; Macphail, 1979); (d) western Tasmanian regionalcharcoal curve (dashed l<strong>in</strong>e <strong>in</strong>dicates <strong>the</strong> 14 ka mean) (Site 5, Fig. 1a; Fletcher andThomas, 2010a); (e) Lake Vera palaeovegetation <strong>in</strong>dex (Site 5, Fig. 1a; dashed l<strong>in</strong>e<strong>in</strong>dicates <strong>the</strong> 14 ka mean); (f) Lake Keilambete lake-level curve (Site 4, Fig. 1a; Bowlerand Hamada, 1971); (g) southwest Victoria effective precipitation curve (Site 4, Fig. 1a;Jones et al., 1998); (h) tropical foram<strong>in</strong>ifera <strong>in</strong> ocean core MD03-2611 (Site 3, Fig. 1a;Moros et al., 2009). Timescales were developed based on calendar years whenever <strong>the</strong>orig<strong>in</strong>al records were published <strong>in</strong> radiocarbon age scales. Radiocarbon dates werecalibrated us<strong>in</strong>g Calib 6.1 (Stuiver et al., 2010) and l<strong>in</strong>ear <strong>in</strong>terpolations developedbetween <strong>the</strong>se calibrated dates. See Fig. 1a for <strong>the</strong> location of sites. Grey shad<strong>in</strong>g<strong>in</strong>dicates <strong>the</strong> early Holocene (11e8 ka) period of weak westerly flow <strong>in</strong> <strong>the</strong> Sou<strong>the</strong>rnHemisphere.
M.-S. Fletcher, P.I. Moreno / Quaternary International 253 (2012) 32e46 35utilised <strong>in</strong> Harrison and Dodson’s (1993) syn<strong>the</strong>sis. The lithostratigraphyof <strong>the</strong> Lake Vera record reveals dark-brown clay detritusmud (13e8 ka, black <strong>in</strong> Fig. 2c) overla<strong>in</strong> by bluish-grey clay muddeposited between w8 and 6.5 ka (grey <strong>in</strong> Fig. 2c), capped <strong>in</strong> turnby detritus mud after 6.5 ka (black <strong>in</strong> Fig. 2c) (Macphail, 1979). Thechange to bluish-grey clay mud between 8 and 6.5 ka impliesdelivery of terrigenous material <strong>in</strong>to <strong>the</strong> bas<strong>in</strong> and has two plausibleand contrast<strong>in</strong>g explanations: (1) <strong>in</strong>ternal rework<strong>in</strong>g of littoralmaterial under a low lake-level stand driven by drier-than-presentconditions (Bradbury, 1986); or (2) <strong>in</strong>creased flux of <strong>in</strong>organicmaterial <strong>in</strong> <strong>the</strong> catchment area result<strong>in</strong>g from enhanced runoffdriven by higher-than-present ra<strong>in</strong>fall.2.2.1.3. Sou<strong>the</strong>ast Australia. Lake George (35 S; Fig. 1b) is a muchstudied, hydrologically sensitive lake, with a large (800 km 2 ) flatbas<strong>in</strong> near <strong>the</strong> sou<strong>the</strong>ast Australian coast (Hunt<strong>in</strong>gton et al., 1908;Cep, 1923; S<strong>in</strong>gh et al., 1981; De Deckker, 1982; S<strong>in</strong>gh andGeissler, 1985; Fitzsimmons and Barrows, 2010). Summer-ra<strong>in</strong>fall<strong>in</strong> this temperate region is negatively correlated with zonal, nearsurfaceSWW speed <strong>in</strong> <strong>the</strong> modern climate (Fig. 1b; Hendon et al.,2007). The fact that historical lake-level fluctuations at LakeGeorge display a good correlation with local ra<strong>in</strong>fall and evaporationdemonstrates its sensitivity to monitor past changes <strong>in</strong> effectiveprecipitation (Jenn<strong>in</strong>gs, 1981). Optically StimulatedLum<strong>in</strong>escence (OSL) dat<strong>in</strong>g of two outcrops at different elevationsabove <strong>the</strong> lake depocentre, <strong>in</strong> comb<strong>in</strong>ation with previous palaeoecologicalstudies from <strong>the</strong> lake, enables a lake-level reconstructionspann<strong>in</strong>g <strong>the</strong> last 14,000 years (Fig. 2a). Three dist<strong>in</strong>ct phasesare recognisable based on <strong>the</strong> OSL geochronology: (1) a permanent11.5 m deep lake at 14.2 0.9 ka; (2) aeolian deposition at9.13 1.2 ka (<strong>the</strong> pooled mean age of a cluster of statisticallyidentical OSL dates) signify<strong>in</strong>g lake-level lower<strong>in</strong>g from 15 mdeep to below 11.5 m prior to this time; (3) a fluctuat<strong>in</strong>g lakebetween 6.0 0.4 and 0.34 0.03 ka, with a clear low stand at3.7 1.0 ka (w11.5 m), a high-stand between 2.4 0.2 ka (15 m)and aeolian deposition at 1.1 0.2 ka (
36M.-S. Fletcher, P.I. Moreno / Quaternary International 253 (2012) 32e46of decreased westerly flow over <strong>the</strong>se regions <strong>in</strong> <strong>the</strong> modernclimate (Fig. 1b) and <strong>in</strong>dicat<strong>in</strong>g a multi-millennial phase of attenuatedSWW flow at this time. The period between 7 and 5 ka ismarked by a reversal of <strong>the</strong> previous trend with a multi-millennialphase of enhanced westerly flow that led to a moisture <strong>in</strong>crease <strong>in</strong>western Tasmania and southwest Victoria, along with low lakelevels<strong>in</strong> eastern/central Tasmania between 8 and 6 ka and sou<strong>the</strong>astAustralia (Lake George) between w9 and 6 ka. This wasconcurrent with a decrease <strong>in</strong> palaeofire <strong>in</strong> western Tasmania anddeposition of terrigenous material <strong>in</strong> Lake Vera result<strong>in</strong>g fromenhanced runoff driven by a multi-millennial <strong>in</strong>crease <strong>in</strong> westerlyflow across <strong>the</strong> entire region. A ‘westerly maximum’ is apparent atw6 ka and is supported by a sharp <strong>in</strong>crease <strong>in</strong> tropical foram<strong>in</strong>iferadelivered by <strong>the</strong> Leeuw<strong>in</strong> Current from negligible values at 7.5 ka toa greater-than-present maximum between 5.5 and 5 ka <strong>in</strong> deep seacore MD03-2611 (Fig. 2h).A multi-millennial decrease <strong>in</strong> moisture and <strong>in</strong>crease <strong>in</strong> charcoal<strong>in</strong> western Tasmania from 5 to 2 ka is consistent with a cessation ofterrigenous <strong>in</strong>put <strong>in</strong>to Lake Vera and lake-level lower<strong>in</strong>g at LakeKeilambete <strong>in</strong> southwest Victoria, reflect<strong>in</strong>g a decrease <strong>in</strong> westerlyprecipitation. After 2 ka, western Tasmanian charcoal decl<strong>in</strong>essubstantially, counter to <strong>the</strong> cont<strong>in</strong>ued dry<strong>in</strong>g trend <strong>in</strong>dicated by<strong>the</strong> Lake Vera palaeovegetation <strong>in</strong>dex, yet consistent with a returnto a high lake-level at Lake Keilambete. A gradual multi-millennialdecrease <strong>in</strong> tropical foram<strong>in</strong>ifera <strong>in</strong> ocean core MD03-2611 isconsistent with <strong>the</strong> Lake Vera <strong>in</strong>dex, suggest<strong>in</strong>g a multi-millennialdecrease <strong>in</strong> SWW flow toward <strong>the</strong> present. Lake-levels <strong>in</strong> easternand central Tasmania rema<strong>in</strong> <strong>in</strong>variant from 5 ka onward, whileLake George undergoes a moderate lower<strong>in</strong>g of lake-level centredat 3.7 1 ka. This event is not replicated <strong>in</strong> o<strong>the</strong>r sou<strong>the</strong>rnAustralian sites, although <strong>the</strong> large error associated with <strong>the</strong> tim<strong>in</strong>gof this event precludes confident correlations with o<strong>the</strong>r records.The drop <strong>in</strong> Lake George lake-level between ca. 2.5 and 0.5 ka isconcomitant with high a lake-level at Lake Keilambete, suggest<strong>in</strong>ga return to east-west anti-phas<strong>in</strong>g prevalent under <strong>in</strong>creased SWWflow.3. New Zealand3.1. Present environmentNew Zealand is a long narrow series of islands located between34 and 45 S, predom<strong>in</strong>antly with<strong>in</strong> <strong>the</strong> SWW zone of <strong>in</strong>fluence(Fig. 1a). North Island extends <strong>in</strong>to <strong>the</strong> sub-tropical high pressurezone and receives moisture from <strong>the</strong> warm nor<strong>the</strong>rn oceans (PacificOcean), result<strong>in</strong>g <strong>in</strong> a warm temperate climate (Sturman and Tapper,2006). South Island is subject to cooler temperatures and is under<strong>the</strong> permanent <strong>in</strong>fluence of <strong>the</strong> SWW (McGlone et al.,1993; Sturmanand Tapper, 2006). The northwestesou<strong>the</strong>ast trend<strong>in</strong>g Sou<strong>the</strong>rnAlps bisect <strong>the</strong> South Island <strong>in</strong>to dist<strong>in</strong>ct west and east climatezones: a hyper-humid west and a humid to sub-humid east(McGlone et al., 1993). Precipitation is significantly correlated towesterly w<strong>in</strong>d speed, with an <strong>in</strong>crease (decrease) <strong>in</strong> westerly flowresult<strong>in</strong>g <strong>in</strong> a steepen<strong>in</strong>g (relax<strong>in</strong>g) of <strong>the</strong> westeeast precipitationgradient (McGlone et al.,1993). Sou<strong>the</strong>rly w<strong>in</strong>ds deliver precipitationto <strong>the</strong> south of <strong>the</strong> South Island, with <strong>the</strong> orographic ra<strong>in</strong>-shadowzone restricted to <strong>the</strong> central east (Otago) region (McGlone et al.,1993). The Sou<strong>the</strong>rn Alps are glaciated, with glacial dynamics governedby both temperature (Anderson and Mack<strong>in</strong>tosh, 2006) andwesterly derived precipitation (Fitzharris et al., 1992).The complex topography and geology of New Zealand producesa wide variety of microclimatic zones that host a complex andhighly endemic flora. Broadly speak<strong>in</strong>g, <strong>the</strong> pr<strong>in</strong>cipal vegetationunits are forest and grassland that are primarily determ<strong>in</strong>ed bytemperature, moisture and disturbance (Dodson, 1998).Taxonomically diverse hardwood trees dom<strong>in</strong>ate <strong>the</strong> forests of <strong>the</strong>warm temperate North Island and were much more widespreadbefore <strong>the</strong> arrival of humans (w0.8 ka) (Wardle, 1991; McGloneet al., 1993; Wilmshurst et al., 2008). In <strong>the</strong> South Island, Nothofagusand podocarp forests dom<strong>in</strong>ate <strong>the</strong> high-ra<strong>in</strong>fall west andsou<strong>the</strong>rn regions up to <strong>the</strong> tree-l<strong>in</strong>e, where stunted woody taxa andherbaceous plants prevail <strong>in</strong> <strong>the</strong> oceanic climate (Wardle, 1991).Grasslands prevail <strong>in</strong> <strong>the</strong> sub-humid central eastern region, ow<strong>in</strong>g<strong>the</strong>ir present spatial extent to <strong>the</strong> comb<strong>in</strong>ed effects of dry westerlyfoehn w<strong>in</strong>ds and anthropogenic disturbance (e.g. McGlone andMoar, 1998; McWethy et al., 2009).3.2. Palaeoenvironmental records3.2.1. West coast South Island vegetationThe Okarito Bog pollen record (Newnham et al., 2007) from <strong>the</strong>west coast of South Island (43 S; Fig. 1a) is located with<strong>in</strong> <strong>the</strong>westerly derived high-ra<strong>in</strong>fall zone, a region that displays a strongpositive correlation between zonal westerly w<strong>in</strong>d speed andprecipitation (Fig. 1b; McGlone et al., 1993; Ummenhofer andEngland, 2007). Unfortunately, no dat<strong>in</strong>g was performed on <strong>the</strong>Holocene portion of this record. A l<strong>in</strong>ear extrapolation is used from<strong>the</strong> uppermost date (10.9 ka) to <strong>the</strong> present, although this is likely<strong>in</strong>appropriate given <strong>the</strong> sedimentary changes through this section(Newnham et al., 2007). Never<strong>the</strong>less, trends <strong>in</strong> aquatic taxa <strong>in</strong> <strong>the</strong>Okarito Bog pollen record show a dynamic response to moisturechanges over <strong>the</strong> last 14,000 years (Fig. 3c). The transition from anLGM lake to a post-glacial bog was punctuated by <strong>the</strong> follow<strong>in</strong>gmulti-millennial fluctuations <strong>in</strong> aquatic pollen content: highaquatic pollen content between 14 and 11.5 ka; a significantreduction <strong>in</strong> aquatic pollen content between 11.5 and 8 ka;<strong>in</strong>creas<strong>in</strong>g aquatic pollen between 7.5 and 5 ka; and a multimillennialdecrease to present (Fig. 3c).3.2.2. East South Island precipitationPrebble and Shulmeister (2002) conducted a quantitativereconstruction of effective precipitation based on phytolyths <strong>in</strong>Otago (45 S; Fig. 1a), a region affected by dry foehn w<strong>in</strong>ds thatdisplays a negative correlation between zonal flow and precipitation<strong>in</strong> <strong>the</strong> modern climate (Fig. 1b). The stratigraphy of <strong>the</strong> site iscomplex, and <strong>the</strong> chronology relies on three radiocarbon dates andfive OSL dates that have substantial error ranges, preclud<strong>in</strong>g <strong>the</strong>development of a precise age model. Prebble and Shulmeister(2002) report an <strong>in</strong>crease <strong>in</strong> effective precipitation beg<strong>in</strong>n<strong>in</strong>g atFig. 3. Palaeoenvironmental data from New Zealand plotted on a calendar age scale:(a) Otago precipitation curve (Site 9, Fig. 1a; Prebble and Shulmeister, 2002); (b)Sou<strong>the</strong>rn Alps glaciations (Lowell et al., 1995; Shulmeister et al., 2004; Schaefer et al.,2009); (c) Okarito Bog aquatic pollen content (Site 8, Fig. 1a; Newnham et al., 2007).See Fig. 1a for <strong>the</strong> location of sites. Grey shad<strong>in</strong>g <strong>in</strong>dicates <strong>the</strong> early Holocene (11e8 ka)period of weak westerly flow <strong>in</strong> <strong>the</strong> Sou<strong>the</strong>rn Hemisphere.
M.-S. Fletcher, P.I. Moreno / Quaternary International 253 (2012) 32e46 3712 ka, peak<strong>in</strong>g at w8.5 ka and decreas<strong>in</strong>g toward 4 ka (Fig. 3a).Depositional hiatuses effectively term<strong>in</strong>ate <strong>the</strong> record at w4 ka.3.2.3. Sou<strong>the</strong>rn Alps glacier dynamicsThe temperate glaciers of New Zealand are sensitive to climatechange, although <strong>the</strong>re is some debate over what component ofclimate exerts <strong>the</strong> greatest <strong>in</strong>fluence over changes <strong>in</strong> glacier massbalance <strong>in</strong> <strong>the</strong> region, with both temperature and precipitationpurported as <strong>the</strong> dom<strong>in</strong>ant control (Fitzharris et al., 1992;Anderson and Mack<strong>in</strong>tosh, 2006; Purdie et al., 2011). A significantrelationship between <strong>the</strong> strength of SWW flow and glacialmass balance was observed by Fitzharris et al. (1992) and it is clearthat westerly derived precipitation is an important factor <strong>in</strong> glacialdynamics <strong>in</strong> this region. A substantial body of work has beendevoted to establish<strong>in</strong>g a chronology of glacial fluctuations <strong>in</strong> <strong>the</strong>Sou<strong>the</strong>rn Alps that reveals multi-millennial trends that most likelyreflect both precipitation and temperature effects (e.g. Gellatlyet al., 1988; Denton and Hendy, 1994; Fitzsimons, 1997; Barrowset al., 2007; McCarthy et al., 2008; Schaefer et al., 2009). A salientfeature of <strong>the</strong> glacial record (Fig. 3b) is a deep glacial recessionbetween w11 and 7 ka, which Shulmeister et al. (2004) arguereflects weak westerly flow across <strong>the</strong> region effectively starv<strong>in</strong>gglaciers of moisture. Increased westerly flow and/or lowertemperatures are sufficient to account for widespread and welladvanced glaciation between 14 and 11 ka and for neoglaciations<strong>in</strong>ce 7 ka (Moreno et al., 2009; Rojas and Moreno, 2010;Shulmeister et al., 2010).3.2.4. SummaryClear multi-millennial trends are evident <strong>in</strong> <strong>the</strong> palaeoenvironmentaldata from New Zealand’s South Island: 14e11,11e8, 7.5e4.5, and 4.5e0 ka. The period between 14 and 11 ka ischaracterised by relatively high aquatic pollen content at OkaritoBog and glacial advances <strong>in</strong> <strong>the</strong> Sou<strong>the</strong>rn Alps, likely reflect<strong>in</strong>ga comb<strong>in</strong>ation of cool temperatures and strong westerly flow over<strong>the</strong> region. Between 11 and 8 ka, aquatic pollen content decl<strong>in</strong>essubstantially at Okarito Bog on <strong>the</strong> west coast and precipitation<strong>in</strong>creases <strong>in</strong> Otago to a maximum at w8.5 ka. Anti-phas<strong>in</strong>g of westand east precipitation anomalies is consistent with <strong>the</strong> modernrelationship between South Island ra<strong>in</strong>fall and westerly w<strong>in</strong>d speedand <strong>the</strong> lack of (or very much limited) glacial advance at this time iscontemporaneous with weak westerly flow. A comb<strong>in</strong>ation ofmaximum Holocene aquatic pollen content at Okarito Bog anddecreas<strong>in</strong>g precipitation east of <strong>the</strong> Sou<strong>the</strong>rn Alps <strong>in</strong> Otago,contemporaneous with renewed glaciation, suggests an <strong>in</strong>crease <strong>in</strong>westerly flow over <strong>the</strong> South Island between 7.5 and 4.5 ka. After4.5 ka, aquatic pollen content <strong>in</strong> <strong>the</strong> Okarito record shows a gradualdecl<strong>in</strong>e toward <strong>the</strong> present; suggest<strong>in</strong>g a possible decl<strong>in</strong>e <strong>in</strong> westerlyflow over <strong>the</strong> region, while, <strong>in</strong> contrast, <strong>the</strong> spread of <strong>the</strong>podocarpaceous tree Dacrydium cupress<strong>in</strong>um recorded acrossSouthland and Otago (South Island New Zealand) has been <strong>in</strong>terpretedas <strong>in</strong>dicat<strong>in</strong>g an <strong>in</strong>crease <strong>in</strong> westerly flow across <strong>the</strong> regionafter ca. 3 ka (McGlone et al., 1993).4. Sou<strong>the</strong>rn South America4.1. Present environmentSouth America stretches from north of <strong>the</strong> equator to 55 S,transgress<strong>in</strong>g a broad range of climatic zones, from warm equatorialto cold sub-Antarctic. In <strong>the</strong> zone of westerly <strong>in</strong>fluence, largeamounts of year-round ra<strong>in</strong>fall <strong>in</strong>undate areas west of <strong>the</strong> Andessouth of w38 S, while <strong>in</strong> <strong>the</strong> ra<strong>in</strong>-shadow east of <strong>the</strong> Andes, subhumidto semi-arid conditions result from persistent foehnw<strong>in</strong>ds. Abundant precipitation of westerly orig<strong>in</strong> susta<strong>in</strong>stemperate ra<strong>in</strong>forests on <strong>the</strong> Pacific side of <strong>the</strong> Patagonian Andes(<strong>the</strong> region south of 40 S <strong>in</strong> South America). Climatic segregation of<strong>the</strong> vegetation has led to <strong>the</strong> recognition of Valdivian, North Patagonian,and sub-Antarctic ra<strong>in</strong>forest communities <strong>in</strong> Patagoniaalong a gradient of <strong>in</strong>creas<strong>in</strong>g precipitation and w<strong>in</strong>d speeds, lowertemperatures and length of <strong>the</strong> grow<strong>in</strong>g season. Vegetation east of<strong>the</strong> Andes is dom<strong>in</strong>ated by <strong>the</strong> sub-humid to semi-arid PatagonianSteppe to <strong>the</strong> east as moisture decreases. Seasonal forc<strong>in</strong>g drives<strong>the</strong> SWW north (south) <strong>in</strong> w<strong>in</strong>ter (summer) relative to <strong>the</strong>ir coreregion of strongest w<strong>in</strong>d speeds (w50 S), result<strong>in</strong>g <strong>in</strong> a w<strong>in</strong>ter(summer) dom<strong>in</strong>ant ra<strong>in</strong>fall climate north (south) of w50 S.4.2. Palaeoenvironmental records4.2.1. Lake-levels4.2.1.1. West of <strong>the</strong> Andes e central Chile. Laguna Aculeo is located<strong>in</strong> <strong>the</strong> Mediterranean climate zone of central Chile toward <strong>the</strong>nor<strong>the</strong>rn limits of <strong>the</strong> zone of westerly <strong>in</strong>fluence (33 S; Fig. 1a), anarea <strong>in</strong> which local precipitation is positively correlated withwesterly w<strong>in</strong>d speed (Fig. 1). The hydrologic balance of this relativelyclosed-bas<strong>in</strong> lake is dependent on <strong>the</strong> westerlies for recharge(Jenny et al., 2003). A precipitation curve spann<strong>in</strong>g <strong>the</strong> last 10,000years has been derived from changes <strong>in</strong> <strong>the</strong> lake-level of LagunaAculeo through this time that is characterised by <strong>the</strong> follow<strong>in</strong>gsequence (Fig. 4f; Jenny et al., 2003): low effective precipitationbetween 10 and 8.6 ka; a slight <strong>in</strong>crease <strong>in</strong> precipitation at 8.6 ka;a marked <strong>in</strong>crease at 5.6 ka that persists until 3 ka; after whicha variable and slightly <strong>in</strong>creas<strong>in</strong>g precipitation regime prevails until<strong>the</strong> present.Abarzúa et al. (2004) present stratigraphic evidence from LagoTahui (w43 S), a small closed-bas<strong>in</strong> lake located <strong>in</strong> an <strong>in</strong>termora<strong>in</strong>aldepression <strong>in</strong> east-central Isla Grande de Chiloé, NWPatagonia, a region <strong>in</strong> which precipitation is strongly correlated withwesterly w<strong>in</strong>d speed. The record <strong>in</strong>cludes piston cores obta<strong>in</strong>edalong a bathymetric transect, correlated on <strong>the</strong> basis of tephra layersand radiocarbon dates. Cores collected from <strong>the</strong> shallow portion of<strong>the</strong> lake revealed a basal silty gyttja overla<strong>in</strong> by woody gyttja (with>5 cm diameter tree trunks and branches), overla<strong>in</strong> <strong>in</strong> turn bycoarseorganic detritus gyttja, and gyttja until <strong>the</strong> present. The authors<strong>in</strong>terpreted <strong>the</strong>se data as evidence for a regressive lake phase thatled to <strong>the</strong> centripetal expansion of a swamp forest environment at<strong>in</strong>termediate depths <strong>in</strong> <strong>the</strong> lake, followed by a transgressive phaseand persistence of <strong>the</strong> lake until today (Abarzúa et al., 2004). Theavailable chronology <strong>in</strong>dicates that lake-levels <strong>in</strong> Lago Tahuirema<strong>in</strong>ed stationary below <strong>the</strong> modern elevation between 11.5 and7.8 ka, imply<strong>in</strong>g a decl<strong>in</strong>e <strong>in</strong> regional precipitation delivered by <strong>the</strong>SWW dur<strong>in</strong>g that time (Abarzúa et al., 2004).4.2.1.2. East of <strong>the</strong> Andes e Argent<strong>in</strong>e Patagonia. Lago Cardiel isa deep and much studied closed-bas<strong>in</strong> lake located with<strong>in</strong> <strong>the</strong> dryPatagonian Steppe of Argent<strong>in</strong>a (49 S; Fig. 1a), a region receiv<strong>in</strong>g aslittle as 150 mm of annual ra<strong>in</strong>fall (Markgraf et al., 2003; Gilli et al.,2005a; Ariztegui et al., 2009). The site lies <strong>in</strong> <strong>the</strong> ra<strong>in</strong>-shadow eastof <strong>the</strong> Andes Cordillera close to <strong>the</strong> present-day zone of maximumSWW speeds (50 S), and displays a negative correlation betweenzonal w<strong>in</strong>d strength and local precipitation that results fromsignificant evaporative moisture loss as dry foehn w<strong>in</strong>ds stripmoisture from <strong>the</strong> region under strong westerly flow (Fig. 1b;Garreaud, 2007). A recent lake-level reconstruction from LagoCardiel reveals substantial lake-level changes s<strong>in</strong>ce 14 ka thatreflect changes <strong>in</strong> precipitation and evaporation (Ariztegui et al.,2009) (Fig. 4a). The lake was low between 14 and 12.3 ka, andwas followed by an abrupt transgressive phase that led to higherthan-modernlake-levels between w11e8 ka, represent<strong>in</strong>ga w100 m <strong>in</strong>crease <strong>in</strong> lake-level and reflect<strong>in</strong>g a significant change
38M.-S. Fletcher, P.I. Moreno / Quaternary International 253 (2012) 32e46with<strong>in</strong> <strong>the</strong> westerly zone of <strong>in</strong>fluence north of w50 S <strong>in</strong> westernPatagonia (e.g. Villagran, 1988; Jenny et al., 2002; Abarzúa et al.,2004; Haberle and Bennett, 2004; Moreno, 2004; Latorre et al.,2007; Markgraf et al., 2007; Abarzúa and Moreno, 2008). Thewell dated (18 AMS radiocarbon dates) pollen record from LagoCondorito (41 S; Fig. 1a) can be used to represent changes <strong>in</strong> SWWderivedmoisture <strong>in</strong> this region over <strong>the</strong> last 14,000 years. LagoCondorito is a small closed-bas<strong>in</strong> lake, located <strong>in</strong> <strong>the</strong> transitionalzone between <strong>the</strong> warm and seasonal Valdivian ra<strong>in</strong>forests and <strong>the</strong>cool, perennially wet North Patagonian ra<strong>in</strong>forests (Moreno, 2004).A pollen-based normalized Eucryphia þ Caldcluvia (Valdivian taxa)/Podocarpaceae (North Patagonian taxa) <strong>in</strong>dex calculated for thissite proxies <strong>in</strong>tensity variations and movements <strong>in</strong> <strong>the</strong> nor<strong>the</strong>rnedge of <strong>the</strong> westerlies and reveals clear multi-millennial trends <strong>in</strong>moisture balance (Fig. 4e; Moreno, 2004). Initially, above averagemoisture between w14 and 12.5 ka is evident, followed bya decl<strong>in</strong><strong>in</strong>g moisture trend with negative anomalies betweenw10.5 and 7.8 ka and characterised by strongly negative valuesbetween 9.5 and 8.5 ka, reveal<strong>in</strong>g a decrease <strong>in</strong> westerly derivedmoisture north of <strong>the</strong> modern zone of strongest westerly flowdur<strong>in</strong>g this time (Fig. 4e). The <strong>in</strong>dex suggests that moisture<strong>in</strong>creased until a maximum at 6e5 ka, reflect<strong>in</strong>g an <strong>in</strong>crease <strong>in</strong>westerly derived precipitation north of <strong>the</strong> core of <strong>the</strong> westerlies,after which a multi-millennial decrease is evident (Fig. 4e).Fig. 4. Palaeoenvironmental data from sou<strong>the</strong>rn South America plotted on a calendarage scale: (a) Lago Cardiel lake-level reconstruction (dashed l<strong>in</strong>e <strong>in</strong>dicates <strong>the</strong> modernlake-level) (Site 12, Fig. 1a; Ariztegui et al., 2009); (b) Gran Campo-2 hygrophyte curveand hydrological phase (Site 14, Fig. 1a; Fesq-Mart<strong>in</strong> et al., 2004); (c) Lago TamarMisodendron curve (Site 15, Fig. 1a; Lamy et al., 2010); (d) sou<strong>the</strong>rn South Americancharcoal curve (dashed l<strong>in</strong>e <strong>in</strong>dicates <strong>the</strong> 14 ka mean) (Power et al., 2008); (e) LagoCondorito palaeovegetation <strong>in</strong>dex (dashed l<strong>in</strong>e <strong>in</strong>dicates <strong>the</strong> 14 ka mean) (Site 11,Fig. 1a; Moreno, 2004); (f) Lago Guanaco palaeovegetation <strong>in</strong>dex (dashed l<strong>in</strong>e <strong>in</strong>dicates<strong>the</strong> 12 ka mean) (Site 13, Fig. 1a; Moreno et al., 2010); (g) Laguna Potrok Aike lake-levelreconstruction (Site 16, Fig. 1a; Anselmetti et al., 2009); (h) Laguna Aculeo precipitationreconstruction (Site 10, Fig. 1a; Jenny et al., 2003). See Fig. 1a for <strong>the</strong> location ofsites. Grey shad<strong>in</strong>g <strong>in</strong>dicates <strong>the</strong> early Holocene (11e8 ka) period of weak westerlyflow <strong>in</strong> <strong>the</strong> Sou<strong>the</strong>rn Hemisphere.<strong>in</strong> <strong>the</strong> delivery of atmospheric moisture <strong>in</strong>to <strong>the</strong> extra-Andeanregion of Central Patagonia. After 8 ka, lake-levels fell, fluctuat<strong>in</strong>grepeatedly between þ15 m and <strong>the</strong> present-day level (Markgrafet al., 2003; Ariztegui et al., 2009).Ano<strong>the</strong>r much studied lake bas<strong>in</strong> <strong>in</strong> Argent<strong>in</strong>e Patagonia,Laguna Potrok Aike (52 S; Fig. 1a), lies south of <strong>the</strong> modern core of<strong>the</strong> SWW <strong>in</strong> a region where modern precipitation displays nostatistically significant relationship with SWW speed (Fig. 1b). Apossible reason for <strong>the</strong> lack of correlation of precipitation at this sitewith SWW speed is <strong>the</strong> proximity of both <strong>the</strong> Andes and <strong>the</strong>Atlantic Ocean, provid<strong>in</strong>g precipitation spill<strong>in</strong>g eastward with <strong>the</strong>westerly w<strong>in</strong>ds and <strong>in</strong>creased humidity from <strong>the</strong> South Atlanticunder weak westerly flow, respectively. A lake-level reconstructionfrom Potrok Aike (Anselmetti et al., 2009) reveals a lake regressivephase from >8.5 ka to a lake-level m<strong>in</strong>imum at w7 ka, after whicha multi-millennial lake-level transgression started and has persisteduntil <strong>the</strong> present (Fig. 4e).4.2.2. Western Patagonian vegetation4.2.2.1. North of w50 S. A consensus exists between virtually allvegetation-based multi-millennial moisture reconstructions from4.2.2.2. South of w50 S. Recent palaeovegetation-based <strong>in</strong>terpretationsof westerly derived moisture variations s<strong>in</strong>ce 14 ka fromsouth of 50 S <strong>in</strong> western Patagonia are divided between twooppos<strong>in</strong>g models of westerly change (Lamy et al., 2010; Morenoet al., 2010; Fletcher and Moreno, 2011). Important for bothmodels is <strong>the</strong> <strong>in</strong>terpretation of a normalized Nothofagus/Poaceaepollen <strong>in</strong>dex (NPI) from Lago Guanaco, a small closed-bas<strong>in</strong> lakesituated near <strong>the</strong> modern forest-steppe ecotone (52 S; Morenoet al., 2010) <strong>in</strong> an area where local precipitation is strongly andpositively correlated with zonal w<strong>in</strong>d speed (Fig. 1b). The NPI fromLago Guanaco was <strong>in</strong>terpreted by Moreno et al. (2010) as a localsensor of past shifts of <strong>the</strong> forest-steppe ecotone and <strong>the</strong> amount ofSWW-derived precipitation spill<strong>in</strong>g eastward over <strong>the</strong> Andes. TheLago Guanaco <strong>in</strong>dex displays <strong>in</strong>creas<strong>in</strong>g woody vegetation/moistureat <strong>the</strong> site between 13 and 11 ka, steppe/decreas<strong>in</strong>g moisturebetween 11 and 8 ka and an <strong>in</strong>creas<strong>in</strong>g, albeit variable, forestexpansion/moisture <strong>in</strong>creas<strong>in</strong>g trend <strong>the</strong>reafter (Fig. 4f). Ina subsequent study, Lamy et al. (2010) offer an alternative <strong>in</strong>terpretationof <strong>the</strong> NPI, with negative/steppe (positive/forest) excursionsconsidered as evidence for <strong>in</strong>creased (decreased) evaporationat <strong>the</strong> site under enhanced (attenuated) westerly flow.The location of <strong>the</strong> forest-steppe ecotone <strong>in</strong> Patagonia isdependent on moisture balance (Paruelo et al., 1998) and is <strong>in</strong>fluencedby <strong>the</strong> amount and seasonality of westerly precipitationspill<strong>in</strong>g eastward over <strong>the</strong> Andes and <strong>the</strong> amount of evaporationresult<strong>in</strong>g from desiccat<strong>in</strong>g (westerly) foehn w<strong>in</strong>ds. Lago Guanacopresently lies with<strong>in</strong> steppe vegetation, despite an average annualra<strong>in</strong>fall (720 mm p/a; Moy et al., 2008) above <strong>the</strong> suggestedthreshold for steppe development <strong>in</strong> Sou<strong>the</strong>rn Patagonia and Tierradel Fuego (500e350 mm p/a; Tuhkanen, 1992; Tuhkanen et al.,1992), which Lamy et al. (2010) <strong>in</strong>terpret as a reflection of <strong>the</strong>dom<strong>in</strong>ant <strong>in</strong>fluence of evaporation (strongest <strong>in</strong> <strong>the</strong> summer highw<strong>in</strong>d period) over <strong>the</strong> local moisture regime and vegetation type.They consider trends toward steppe (forest) <strong>in</strong> <strong>the</strong> <strong>in</strong>dex to bedriven by stronger (weaker) westerly flow and <strong>in</strong>creased(decreased) evaporation. An important factor neglected by thoseauthors is that <strong>the</strong> modern forest-steppe ecotone <strong>in</strong> Sou<strong>the</strong>rnPatagonia is not <strong>in</strong> equilibrium with climate, but is <strong>the</strong> result ofEuropean deforestation (Veblen and Markgraf, 1988; Huber andMarkgraf, 2003). Forest covered <strong>the</strong> landscape more than more
M.-S. Fletcher, P.I. Moreno / Quaternary International 253 (2012) 32e46 39than w25 km east of Lago Guanaco prior to AD 1881 (Dixie, 1881),imply<strong>in</strong>g that evaporation does not limit forest development <strong>in</strong> <strong>the</strong>vic<strong>in</strong>ity of Lago Guanaco today, and that precipitation exerts <strong>the</strong>dom<strong>in</strong>ant control over vegetation <strong>in</strong> that area. Despite this, it ispossible that, given <strong>the</strong> location of <strong>the</strong> site east of <strong>the</strong> orographicdivide, under vary<strong>in</strong>g westerly w<strong>in</strong>d regimes, <strong>the</strong> tension zonebetween evaporation and precipitation dom<strong>in</strong>ance over vegetationshifts east or west of its present location to <strong>the</strong> east of LagoGuanaco.Sediments retrieved from <strong>the</strong> Gran Campo-2 site (52 48 0 37 00 S,73 55 0 46 0 W; Fesq-Mart<strong>in</strong> et al., 2004), a m<strong>in</strong>erotropic mire locatedwest of <strong>the</strong> Andes orographic divide where <strong>the</strong> relationshipbetween precipitation and westerly w<strong>in</strong>d strength is positive(Fig. 1b), show a transition from a lake to a mire at that site(between 11.2 and 10.9 ka), <strong>in</strong> concert with an abrupt and susta<strong>in</strong>ed<strong>in</strong>crease <strong>in</strong> “hygrophyte” pollen taxa between 11 and 8 ka (Fig. 4b)that reflects <strong>the</strong> colonisation of a former lake by <strong>the</strong> pr<strong>in</strong>cipal mireform<strong>in</strong>g plant, Marsippospermum spp., and peatland dynamics<strong>the</strong>reafter (Fesq-Mart<strong>in</strong> et al., 2004), a process known as terrestrialisation,when lakes <strong>in</strong>fill under stable or dropp<strong>in</strong>g lake-levels(Futyma and Miller, 1986; Korhola, 1995; Brugam and McCanceJohnson, 1997; Weckstrom et al., 2010), imply<strong>in</strong>g a transition todrier climate between 11.2 and 10.9 ka. After w8.5 ka, an <strong>in</strong>crease<strong>in</strong> moisture is reflected by <strong>the</strong> establishment of Magellanic Moorlandtaxa (Astelia pumila and Donatia fascicularis) at <strong>the</strong> site (Fesq-Mart<strong>in</strong> et al., 2004).A partially published pollen record from Lago Tamar (52 54.21 0 S,73 48.07 0 W; Lamy et al., 2010), located west of <strong>the</strong> Andes, showsa marked and susta<strong>in</strong>ed <strong>in</strong>crease <strong>in</strong> Misodendron pollen, a hemiparasiteon Nothofagus trees, between 11.5 and 8.5 ka (Fig. 4c; Lamyet al., 2010). The Misodendron peak is temporally synchronous with<strong>the</strong> negative moisture anomalies identified at Lago Guanaco and LagoCondorito (Fig. 4e, f). Studies of modern pollen dispersal <strong>in</strong> Sou<strong>the</strong>rnPatagonia reveal greatest Misodendron pollen content at <strong>the</strong> relativelydry and open forest-steppe ecotone (Markgraf et al.,1981; Paezet al., 2001). Numerical analysis of modern pollen data from <strong>the</strong>region reveals that Misodendron pollen content is positively correlatedwith Nothofagus and o<strong>the</strong>r forest <strong>in</strong>dicators (Dale et al., 2010).Thus, while <strong>in</strong>terpretation of <strong>the</strong> Misodendron curve is complicatedby <strong>the</strong>se factors, it is likely to reflect a trend toward canopy openness,which is consistent with a trend toward drier conditions.4.2.3. Western Patagonia firePeak charcoal activity is evident between 12.5 and 9.5 ka <strong>in</strong> siteslocated between 40 and 55 S, where ra<strong>in</strong>fall is positively correlatedwith zonal w<strong>in</strong>d speed (Heusser, 2003; Haberle and Bennett, 2004;Huber et al., 2004; Moreno, 2004; Whitlock et al., 2007; Abarzúaand Moreno, 2008; Massaferro et al., 2009; Markgraf and Huber,2010). The regional charcoal curve for SSA (Power et al., 2008)captures this trend remarkably well (Fig. 4d) and displays a clearcorrelation to <strong>the</strong> palaeovegetation <strong>in</strong>dices from Lago Guanaco andLago Condorito (Fig. 4e, f). The charcoal data <strong>in</strong>dicate <strong>in</strong>creas<strong>in</strong>gcharcoal from 12.5 to 9.5 ka; decreas<strong>in</strong>g charcoal from 9.5 to 3.5 ka;<strong>in</strong>creas<strong>in</strong>g charcoal to 2.5 ka; and little change <strong>the</strong>reafter (Fig. 4b).4.2.4. SummaryHigh relative moisture <strong>in</strong> <strong>the</strong> northwest Patagonian palaeovegetation<strong>in</strong>dex and low sou<strong>the</strong>rn South American charcoalvalues between 14 and 12 ka imply strong westerly flow that isconsistent with dry conditions and low lake-levels east of <strong>the</strong>Andes Cordillera at Lago Cardiel. The available evidence <strong>in</strong>dicatesa multi-millennial decrease (<strong>in</strong>crease) <strong>in</strong> moisture (fire) <strong>in</strong> northwestPatagonia from w12.5 ka. In southwest Patagonia, <strong>in</strong>creasedmoisture <strong>in</strong> Lago Guanaco, cool-wet conditions <strong>in</strong> Gran Campo-2(Fesq-Mart<strong>in</strong> et al., 2004) and moist conditions at Isla de losEstados (54 50S; 64 40W; Ponce et al., 2011) <strong>in</strong>dicates an asymmetryof moisture changes north and south of <strong>the</strong> modern westerlycore that implies a southward shift of <strong>the</strong> SWW at this time. After11 ka, negative moisture trends at Lago Condorito and L. Guanaco,warmer and drier conditions at Isla de los Estados (Ponce et al.,2011) and terrestrialisation of <strong>the</strong> Gran Campo-2 site <strong>in</strong>dicatea decrease <strong>in</strong> SWW-derived moisture that persists until w8 ka,reveal<strong>in</strong>g negative moisture trends across <strong>the</strong> entire zone ofwesterly <strong>in</strong>fluence, coeval with peak fire activity <strong>in</strong> high-ra<strong>in</strong>fallregions throughout Patagonia. East of <strong>the</strong> Andes, above modernlake-level at Lago Cardiel between w11 and 8 ka (Fig. 4a) anda trend toward <strong>in</strong>creased relative moisture across sites <strong>in</strong> Argent<strong>in</strong>a(Manc<strong>in</strong>i et al., 2008) are consistent with decreased SWW <strong>in</strong>fluence,reveal<strong>in</strong>g synchronous and co-variable changes <strong>in</strong> westerlyw<strong>in</strong>d behaviour north and south of <strong>the</strong> core of <strong>the</strong> SWW (rang<strong>in</strong>gbetween 41 and 52 S) that led to decreased moisture west of <strong>the</strong>Andes and less <strong>in</strong>tense foehn w<strong>in</strong>ds and <strong>in</strong>creased <strong>in</strong>cursions ofAtlantic Ocean moisture to <strong>the</strong> east.Increas<strong>in</strong>g relative moisture <strong>in</strong> <strong>the</strong> west and a concomitantdecrease <strong>in</strong> sou<strong>the</strong>rn South American charcoal is evident afterw8 ka toward an apparent ‘moisture maximum’ <strong>in</strong> northwestPatagonia between 6 and 5 ka. This pattern is consistent with<strong>in</strong>creas<strong>in</strong>g moisture <strong>in</strong> southwest Patagonia (Fig. 4e, f) anddecreased lake-levels at Lago Cardiel (Fig. 4a). Moreover, <strong>the</strong>setrends are consistent with a stepwise <strong>in</strong>crease <strong>in</strong> effective precipitation<strong>in</strong> central Chile at 8.6 ka and 5.6 ka (Fig. 4f) and a trendtoward drier climate conditions <strong>in</strong> Argent<strong>in</strong>a, east of <strong>the</strong> AndesCordillera (Manc<strong>in</strong>i et al., 2008). These regionally consistent trendsimply that <strong>the</strong> westerlies <strong>in</strong>creased <strong>in</strong> strength across <strong>the</strong>ir entirezone of <strong>in</strong>fluence. Moisture <strong>in</strong>dices diverge after 5 ka, with a slightmulti-millennial decrease <strong>in</strong> relative moisture evident <strong>in</strong> northwestPatagonia (Fig. 4e), and multi-millennial moisture <strong>in</strong>creases <strong>in</strong>southwest Patagonia and central Chile (Fig. 4f, h). Interest<strong>in</strong>gly,a lake-level regression start<strong>in</strong>g >8.7 ka at Laguna Potrok Aike(Fig. 4g), east of <strong>the</strong> Andes <strong>in</strong> a zone of zero statistical correlationbetween westerly w<strong>in</strong>d speed and precipitation (Fig. 1b), followedby a transgression w7 ka occurs <strong>in</strong> concert with <strong>the</strong> Lago Guanacopalaeovegetation (moisture) <strong>in</strong>dex located at <strong>the</strong> same latitude(52 S), suggest<strong>in</strong>g that multi-millennial scale changes <strong>in</strong> moistureat Laguna Potrok Aike have varied with similar tim<strong>in</strong>g and directionas records from areas positively correlated with westerly w<strong>in</strong>dstrength dur<strong>in</strong>g <strong>the</strong> Holocene. Charcoal values <strong>in</strong>crease after 3.5 kaand rema<strong>in</strong> stable, as does <strong>the</strong> level of Lago Cardiel (Fig. 4a, d). Theeffective precipitation curve from Laguna Aculeo shows fur<strong>the</strong>r<strong>in</strong>creases at 3.2 ka and 2 ka, reflect<strong>in</strong>g an <strong>in</strong>crease <strong>in</strong> westerlyderived moisture <strong>in</strong> that region (Fig. 4h).5. Sou<strong>the</strong>rn Africa5.1. Present environmentThe climate of sou<strong>the</strong>rn Africa is dom<strong>in</strong>ated by <strong>the</strong> sub-tropicalhigh pressure system result<strong>in</strong>g from descend<strong>in</strong>g Hadley Cell airand <strong>the</strong> region is generally dry (Tyson and Preston-Whyte, 2000).Seasonal <strong>in</strong>trusions of monsoonal ra<strong>in</strong> are important dur<strong>in</strong>gsummer <strong>in</strong> <strong>the</strong> north of <strong>the</strong> region. The SWW exert a direct <strong>in</strong>fluenceon <strong>the</strong> climate of <strong>the</strong> southwest tip (<strong>the</strong> Western Cape), impart<strong>in</strong>ga w<strong>in</strong>ter wet Mediterranean climate <strong>in</strong> that region, while <strong>the</strong> EasternCape is reliant on easterly sourced precipitation delivered dur<strong>in</strong>g <strong>the</strong>summer months when westerly flow is weak and <strong>the</strong> trade w<strong>in</strong>dsare displaced southward (Tyson and Preston-Whyte, 2000). Thiseasterly precipitation source is bolstered by <strong>the</strong> warm southwardbound Agulhas Current that flows along <strong>the</strong> east African coast,result<strong>in</strong>g <strong>in</strong> frequent mists (Eeley et al., 1999). The dom<strong>in</strong>ance of <strong>the</strong>trade w<strong>in</strong>ds and <strong>the</strong> cold north-flow<strong>in</strong>g Benguela Current (driven <strong>in</strong>
40M.-S. Fletcher, P.I. Moreno / Quaternary International 253 (2012) 32e46part by <strong>the</strong> SWW) result <strong>in</strong> a hyper-arid desert on <strong>the</strong> western coastof sou<strong>the</strong>rn Africa (Namibia) that grades to <strong>the</strong> Mediterraneanclimate zone of <strong>the</strong> Western Cape fur<strong>the</strong>r south as <strong>the</strong> SWW becomeimportant (Tyson and Preston-Whyte, 2000).Sou<strong>the</strong>rn Africa hosts one of <strong>the</strong> most diverse vegetation typeson Earth, <strong>the</strong> Fynbos (Muc<strong>in</strong>a and Ru<strong>the</strong>rford, 2006). The Fynbos iscomprised of a startl<strong>in</strong>gly diverse array of shrubs that grow on <strong>the</strong>nutrient-poor geologies of <strong>the</strong> Western Cape Mediterraneanclimate zone (Muc<strong>in</strong>a and Ru<strong>the</strong>rford, 2006). To <strong>the</strong> north andcentre of sou<strong>the</strong>rn Africa, aridity prevails and desert-adapted florapredom<strong>in</strong>ate that grade <strong>in</strong> to savannah biomes as <strong>the</strong> monsoonal<strong>in</strong>fluence <strong>in</strong>creases. The higher relative moisture <strong>in</strong> <strong>the</strong> sou<strong>the</strong>astgives rise to a slightly more woody vegetation that transitions <strong>in</strong>to<strong>the</strong> grasslands and savannah of <strong>the</strong> nor<strong>the</strong>rn <strong>in</strong>terior and humidforest patches <strong>in</strong> relatively moist areas on <strong>the</strong> east coast (Eeleyet al., 1999; Muc<strong>in</strong>a and Ru<strong>the</strong>rford, 2006).5.2. Palaeoenvironmental records5.2.1. Western Cape organic sediment accumulationThe dry environment of sou<strong>the</strong>rn Africa is preclusive to organicsediment accumulation, a facet that would have been amplified(weakened) under past climate regimes <strong>in</strong> which drier (wetter)conditions prevailed. Preserved organic beds spann<strong>in</strong>g <strong>the</strong> latePleistocene to <strong>the</strong> present are rare <strong>in</strong> <strong>the</strong> Western Cape (32e34 S;Fig. 1a), a region wholly dependent on <strong>the</strong> SWW for precipitationthat displays a positive correlation between westerly w<strong>in</strong>d speedand precipitation <strong>in</strong> <strong>the</strong> modern climate (Fig. 1b). Fig. 5b showsa plot of <strong>the</strong> number published organic profiles from <strong>the</strong> WesternCape region at 1000-year time steps (based on <strong>the</strong> studies ofSchalke, 1973; Meadows, 1988; Meadows and Sugden, 1991; Street-Perrott and Perrott, 1993; Meadows et al., 1996; Meadows andBaxter, 2001). A very low number of profiles date to <strong>the</strong> periodbetween 14 and 9 ka. While this trend may reflect non-climaticfactors, such as a lack of discovery and/or publication of records,<strong>the</strong> long history of palaeoclimatic research <strong>in</strong> this region suggeststhat <strong>the</strong> lack of organic profiles between 14 and 9 ka may reflectaridity through all or <strong>the</strong> latter part of this time-span. After 9 ka, <strong>the</strong>number of published organic sequences <strong>in</strong>creases two-fold andrema<strong>in</strong>s high until <strong>the</strong> present, possibly reflect<strong>in</strong>g more humidconditions s<strong>in</strong>ce 9 ka.Fig. 5. Palaeoenvironmental data from sou<strong>the</strong>rn Africa plotted on a calendar age scale:(a) Matputaland pollen record Podocarpus values (Site 2, Fig. 1a; F<strong>in</strong>ch and Hill, 2008);(b) Western Cape organic accumulation (Site 1, Fig. 1a; Schalke, 1973; Meadows, 1988;Meadows and Sugden, 1991; Street-Perrott and Perrott, 1993; Meadows et al., 1996;Meadows and Baxter, 2001). Timescales were developed based on calendar yearswhenever <strong>the</strong> orig<strong>in</strong>al records were published <strong>in</strong> radiocarbon age scales. Radiocarbondates were calibrated us<strong>in</strong>g Calib 6.1 (Stuiver et al., 2010) and l<strong>in</strong>ear <strong>in</strong>terpolationsdeveloped between <strong>the</strong>se calibrated dates. See Fig. 1a for <strong>the</strong> location of sites. Greyshad<strong>in</strong>g <strong>in</strong>dicates <strong>the</strong> early Holocene (11e8 ka) period of weak westerly flow <strong>in</strong> <strong>the</strong>Sou<strong>the</strong>rn Hemisphere.5.2.2. Coastal sou<strong>the</strong>ast Africa e Matputaland vegetationA pollen record from Matputaland <strong>in</strong> coastal sou<strong>the</strong>ast Africa(28 S; Fig. 1a), with<strong>in</strong> <strong>the</strong> zone of negative correlation betweenwesterly w<strong>in</strong>d speed and precipitation (Fig. 1b) and a regiondependent on easterly <strong>in</strong>cursions of moisture from <strong>the</strong> IndianOcean, tracks moisture-driven vegetation changes through <strong>the</strong> lateQuaternary (F<strong>in</strong>ch and Hill, 2008). F<strong>in</strong>ch and Hill (2008) reconstructedrelative moisture changes at <strong>the</strong>ir Matputaland site basedpredom<strong>in</strong>antly on changes <strong>in</strong> Podocarpus pollen, a humid foresttree (Eeley et al., 1999) that is absent from <strong>the</strong> site today (F<strong>in</strong>ch andHill, 2008). Based on this premise <strong>the</strong>y <strong>in</strong>ferred relatively dryconditions and low Podocarpus pollen values (70%)between 11 and 9.2 ka, after which a steady decl<strong>in</strong>e <strong>in</strong> valuesbetween 9.2 and 5.4 ka <strong>in</strong>dicates a decl<strong>in</strong>e <strong>in</strong> available moisture anda reduction of this forest type (Fig. 5a). After 5.4 ka, decreas<strong>in</strong>g andvariable Podocarpus values possibly <strong>in</strong>dicate a variable climatetrend<strong>in</strong>g toward drier conditions (Fig. 5a).5.2.3. SummaryThe pattern of multi-millennial changes <strong>in</strong> moisture regimes <strong>in</strong>sou<strong>the</strong>rn South Africa is consistent with <strong>the</strong> modern relationshipbetween westerly flow and precipitation. Little <strong>in</strong>formation ispresent for conditions <strong>in</strong> <strong>the</strong> Western Cape region between 14 and11 ka, although a review of palaeoenvironmental data from thisregion depicts <strong>the</strong> LGM and late Pleistocene as cool and wet(Meadows and Baxter, 1999). Dry conditions (low Podocarpusvalues) on <strong>the</strong> sou<strong>the</strong>ast coast at this time are consistent with <strong>the</strong>modern relationship between zonal w<strong>in</strong>d strength and precipitationunder <strong>in</strong>creased westerly flow and <strong>the</strong> evidence suggestsa streng<strong>the</strong>n<strong>in</strong>g of westerly flow across sou<strong>the</strong>rn South Africabetween 14 and 11 ka. A sharp <strong>in</strong>crease <strong>in</strong> Podocarpus pollen and<strong>the</strong> establishment of humid forest on <strong>the</strong> sou<strong>the</strong>ast coast betweenw11 and 8 ka is consistent with decreased westerly flow anda concomitant <strong>in</strong>crease <strong>in</strong> <strong>in</strong>cursions of easterly moisture sourcesand coastal mists. The Western Cape is represented by very feworganic sequences between 11 and 9 ka, with <strong>the</strong> review ofMeadows and Baxter (1999) suggest<strong>in</strong>g dry conditions through thistime, and it is possible that weak SWW flow between 11 and 9 karesulted <strong>in</strong> enhanced aridity, desiccat<strong>in</strong>g any earlier organic deposition.From 9 ka onward, stronger westerly flow and moistconditions <strong>in</strong> <strong>the</strong> Western Cape region are suggested by an <strong>in</strong>crease<strong>in</strong> <strong>the</strong> number of published organic sequences and is consistentwith a review by Meadows and Baxter (1999), while a substantialdecl<strong>in</strong>e <strong>in</strong> Podocarpus pollen toward a low at 5.5 ka reflects dry<strong>in</strong>g<strong>in</strong> <strong>the</strong> east, a pattern consistent with <strong>the</strong> effects of stronger SWWon precipitation <strong>in</strong> <strong>the</strong> modern climate (Fig. 1b), although it must benoted that this latter region lies <strong>in</strong> a summer-ra<strong>in</strong>fall region,whereas westerly w<strong>in</strong>ds predom<strong>in</strong>antly <strong>in</strong>fluence w<strong>in</strong>ter wea<strong>the</strong>rpatterns <strong>in</strong> this region. The number of organic sequences changeslittle from 9 ka to <strong>the</strong> present <strong>in</strong> <strong>the</strong> Western Cape, while a markeddrop <strong>in</strong> Podocarpus at 3 ka followed by an <strong>in</strong>crease centred on 2 kareveals variability <strong>in</strong> moisture regime on <strong>the</strong> sou<strong>the</strong>ast coast thatmay be attributable to changes <strong>in</strong> westerly flow.6. Discussion6.1. The Sou<strong>the</strong>rn Westerly W<strong>in</strong>ds s<strong>in</strong>ce 14 kaThis syn<strong>the</strong>sis, analysis, and re<strong>in</strong>terpretation of selectedSou<strong>the</strong>rn Hemisphere palaeoenvironmental records represents <strong>the</strong>first attempt at <strong>in</strong>tegrat<strong>in</strong>g data from all Sou<strong>the</strong>rn Hemispherelandmasses relevant to westerly w<strong>in</strong>d changes <strong>in</strong> <strong>the</strong> post-LGMperiod. Despite <strong>the</strong> limited chronological control of many of <strong>the</strong>
M.-S. Fletcher, P.I. Moreno / Quaternary International 253 (2012) 32e46 41records <strong>in</strong>cluded <strong>in</strong> this analysis, <strong>the</strong>re are clear near-synchronousand <strong>zonally</strong> <strong>symmetric</strong> multi-millennial trends <strong>in</strong> moisture balance<strong>in</strong> areas located with<strong>in</strong> <strong>the</strong> modern SWW zone of <strong>in</strong>fluence over <strong>the</strong>last 14,000 years (Fig. 6). The pattern of correlations betweenwesterly w<strong>in</strong>d speed and precipitation <strong>in</strong> <strong>the</strong> modern climate of allSou<strong>the</strong>rn Hemisphere landmasses (Fig. 1b; Garreaud, 2007)provides a mechanistic framework with which to <strong>in</strong>terpret longtermchanges <strong>in</strong> relative moisture <strong>in</strong> terms of westerly w<strong>in</strong>dFig. 6. Selected palaeoenvironmental data arranged <strong>in</strong> order of <strong>in</strong>creas<strong>in</strong>g latitude: (a)December <strong>in</strong>solation at 60 S(Berger, 1978); (b) Laguna Pallcacocha ENSO frequency(Moy et al., 2002); (c) Matputaland pollen record Podocarpus values (Site 1, Fig. 1a;F<strong>in</strong>ch and Hill, 2008); (d) Laguna Aculeo precipitation curve (Site 10, Fig. 1a; Jennyet al., 2003); (e) Lake Keilambete lake-level curve (Site 4, Fig. 1a; Bowler andHamada, 1971); (f) Lago Condorito palaeovegetation <strong>in</strong>dex (dashed l<strong>in</strong>e <strong>in</strong>dicates <strong>the</strong>14 ka mean) (Site 11, Fig. 1a; Moreno, 2004); (g) sou<strong>the</strong>rn South American charcoalcurve (dashed l<strong>in</strong>e <strong>in</strong>dicates <strong>the</strong> 14 ka mean) (Power et al., 2008); (h) Lake Verapalaeovegetation <strong>in</strong>dex (dashed l<strong>in</strong>e <strong>in</strong>dicates <strong>the</strong> 14 ka mean) (Site 7, Fig. 1a); (i)western Tasmanian regional charcoal curve (dashed l<strong>in</strong>e <strong>in</strong>dicates <strong>the</strong> 14 ka mean)(Site 5, Fig. 1a; Fletcher and Thomas, 2010a); (j) eastern and central Tasmanian lakelevelcurve (Site 6, Fig. 1a; Harrison and Dodson, 1993); (k) Okarito Bog aquaticpollen content (Site 8, Fig. 1a; Newnham et al., 2007); (l) Lago Cardiel lake-levelreconstruction (dashed l<strong>in</strong>e <strong>in</strong>dicates <strong>the</strong> modern lake-level) (Site 12, Fig. 1a;Ariztegui et al., 2009). Note that <strong>the</strong> axes have been <strong>in</strong>verted for records located <strong>in</strong>zones that display a negative correlation between precipitation and westerly w<strong>in</strong>dspeed. See Fig. 1a for <strong>the</strong> location of sites.<strong>in</strong>fluence. Although recognis<strong>in</strong>g that changes <strong>in</strong> <strong>the</strong> SWW mayhave been gradual and/or stepwise through time, five multimillennialphases s<strong>in</strong>ce 14 ka represent dist<strong>in</strong>ct phases of westerlyw<strong>in</strong>d strength and <strong>in</strong>fluence: 14e12, 11e8 ka, 7e5, 4e2, and2e0ka(Figs. 6 and 7).6.1.1. Late Pleistocene to early Holocene (14e8 ka)The latest Pleistocene (here 14e12 ka) represents <strong>the</strong> last stageof <strong>the</strong> global reorganisation of climate and biological systems to <strong>the</strong>rapid changes that characterised <strong>the</strong> Last Glacial Term<strong>in</strong>ation(Denton et al., 2010). Several glaciers <strong>in</strong> sou<strong>the</strong>rn South Americaand New Zealand reached <strong>the</strong>ir maxima dur<strong>in</strong>g an <strong>in</strong>terval characterisedby positive precipitation anomalies between 14 and 12 ka(Figs. 6 and 7), which <strong>in</strong> <strong>the</strong>se regions are positively correlated withSWW strength (Fig. 1b). This was followed by a trend towarddecreas<strong>in</strong>g westerly w<strong>in</strong>d <strong>in</strong>fluence at all sites (both north andsouth of <strong>the</strong> modern core of <strong>the</strong> SWW) between 11 and 8 ka across<strong>the</strong> entire westerly zone of <strong>in</strong>fluence (Figs. 6 and 7). The temporaloffset between sites north and south of <strong>the</strong> modern westerly core <strong>in</strong>sou<strong>the</strong>rn South America (Fig. 4e, f), <strong>the</strong> only landmass that <strong>in</strong>tersects<strong>the</strong> westerlies through this zone, suggests an <strong>in</strong>itial southwarddisplacement of <strong>the</strong> westerlies at w12.5 ka, followed bya weaken<strong>in</strong>g of <strong>the</strong> entire westerly w<strong>in</strong>d belt after 11 ka (Morenoet al., 2010; Fletcher and Moreno, 2011)In sou<strong>the</strong>rn South America, moisture-driven vegetation changesand peak fire activity at a sub-cont<strong>in</strong>ental scale occurs <strong>in</strong> pollensequences from <strong>the</strong> hyper-humid regions of western Patagonia andTierra del Fuego between 12.5 and 9.6 ka (Villagran, 1988; Heusser,2003; Moreno, 2004; Massaferro et al., 2005; Villa-Mart<strong>in</strong>ez andMoreno, 2007; Whitlock et al., 2007; Abarzúa and Moreno, 2008;Power et al., 2008; Ponce et al., 2011), reflect<strong>in</strong>g decreased SWWderivedmoisture and weaker westerly flow (Moreno, 2004;Whitlock et al., 2007; Moreno et al., 2010; Fletcher and Moreno,2011). Weak SWW flow over New Zealand dur<strong>in</strong>g <strong>the</strong> early Holocenehas been advocated as <strong>the</strong> driver of: (i) an expansion of frostand drought <strong>in</strong>tolerant vegetation <strong>in</strong> <strong>the</strong> North Island (Shulmeister,1999); (ii) <strong>the</strong> delayed post-glacial forest establishment on sub-Antarctic islands that lie below <strong>the</strong> modern westerly core(McGlone et al., 2000); (iii) a lack of glacial advances (Shulmeisteret al., 2004); and (iv) <strong>in</strong>creased moisture <strong>in</strong> <strong>the</strong> Otago region(Prebble and Shulmeister, 2002). Stratigraphic records from SouthAfrica’s Western Cape <strong>in</strong>dicate a switch from wet to dry conditionsdur<strong>in</strong>g <strong>the</strong> late Pleistoceneeearly Holocene <strong>in</strong>terval (Meadows andBaxter, 1999), concomitant with a change from dry to wet conditions<strong>in</strong> sou<strong>the</strong>ast sou<strong>the</strong>rn Africa (Partridge, 1997) that is consistentwith decreas<strong>in</strong>g westerly <strong>in</strong>fluence over sou<strong>the</strong>rn Africathrough this time.In contrast to <strong>the</strong> evidence presented above for decreas<strong>in</strong>g<strong>in</strong>fluence of <strong>the</strong> SWW, several studies have postulated an <strong>in</strong>crease<strong>in</strong> westerly <strong>in</strong>fluence from <strong>the</strong> late Pleistocene through to <strong>the</strong> early/mid Holocene <strong>in</strong> sou<strong>the</strong>rn Australia (Harrison and Dodson, 1993;Donders et al., 2007), with <strong>the</strong> notion of an early Holocene<strong>in</strong>crease/northward displaced westerlies entrenched <strong>in</strong> <strong>the</strong>Australian palaeoecological literature (e.g. Harrison, 1993; Dodson,1998; Donders et al., 2007; G<strong>in</strong>gele et al., 2007; Moros et al., 2009).For example, an argument has been put forward for a uniform<strong>in</strong>crease <strong>in</strong> moisture across sou<strong>the</strong>ast Australia dur<strong>in</strong>g <strong>the</strong> earlyHolocene, result<strong>in</strong>g from a shift <strong>in</strong> <strong>the</strong> mean position of <strong>the</strong> highpressure belt that was driven by a warm<strong>in</strong>g trend and whichresulted <strong>in</strong> <strong>in</strong>creased westerly w<strong>in</strong>d flow across <strong>the</strong> region(Donders et al., 2007). From first order pr<strong>in</strong>ciples, <strong>the</strong> modernrelationship between westerly w<strong>in</strong>d speed and <strong>the</strong> pattern<strong>in</strong>g ofprecipitation <strong>in</strong> sou<strong>the</strong>rn Australia (Fig. 1b) argues aga<strong>in</strong>sta uniform moisture <strong>in</strong>crease across this vast and diverse region <strong>in</strong>response to stronger westerly flow. Ra<strong>the</strong>r, multi-millennial scale
42M.-S. Fletcher, P.I. Moreno / Quaternary International 253 (2012) 32e46Fig. 7. Maps show<strong>in</strong>g <strong>the</strong> reconstructed precipitation anomaly of sites analysed (a e left panel) and <strong>the</strong> <strong>in</strong>ferred direction of SWW change (b e right panel) for <strong>the</strong> follow<strong>in</strong>g timeslices: 14e12 ka; 10e8 ka; 7e5 ka; 4e2 ka; and 2e0 ka. Red (blue) triangles <strong>in</strong> <strong>the</strong> precipitation anomaly maps <strong>in</strong>dicate positive (negative) precipitation anomalies. Red (blue)circles <strong>in</strong> <strong>the</strong> relative SWW strength maps <strong>in</strong>dicate stronger (weaker) westerly flow (For <strong>in</strong>terpretation of <strong>the</strong> references to color <strong>in</strong> this figure legend, <strong>the</strong> reader is referred to <strong>the</strong>web version of this article.).changes <strong>in</strong> westerly flow across this region would be expected toresult <strong>in</strong> <strong>the</strong> east-west anti-phas<strong>in</strong>g <strong>in</strong> moisture regimes observed<strong>in</strong> <strong>the</strong> modern climate (Fig. 1b). Fur<strong>the</strong>rmore, evidence for an<strong>in</strong>vigorated and/or southward extension of <strong>the</strong> north Australianmonsoon through <strong>the</strong> early Holocene (Johnson et al., 1999; Mageeet al., 2004; Donders et al., 2007) stands <strong>in</strong> direct contrast to <strong>the</strong>notion of a simultaneous northward displacement or streng<strong>the</strong>n<strong>in</strong>gof <strong>the</strong> westerly w<strong>in</strong>d belt.Isolat<strong>in</strong>g moisture proxies from areas with precipitationregimes positively and negatively correlated with westerly w<strong>in</strong>dspeed has revealed that <strong>the</strong> modern eastewest anti-phas<strong>in</strong>g ofprecipitation regimes over sou<strong>the</strong>rn Australia operates at multimillennialtimescales (Fig. 7) and that <strong>the</strong> period between w12and 8 ka was characterised by decreas<strong>in</strong>g westerly <strong>in</strong>fluence oversou<strong>the</strong>rn Australia. Moreover, this multi-millennial trend towarddecreas<strong>in</strong>g westerly flow between w12 and 8 ka occurred on allsou<strong>the</strong>rn landmasses, north and south of <strong>the</strong> modern core of <strong>the</strong>westerlies, display<strong>in</strong>g a clear zonal symmetry and imply<strong>in</strong>ga weaken<strong>in</strong>g and/or southward shift of atmospheric circulationthough this time.6.1.2. Mid Holocene (8e4 ka)A <strong>zonally</strong> <strong>symmetric</strong> multi-millennial <strong>in</strong>crease <strong>in</strong> westerly flowbegan by w8 ka at most sites analysed here (Fig. 6), driv<strong>in</strong>gsynchronous and <strong>zonally</strong> <strong>symmetric</strong> anti-phased moisture regimechanges across all sou<strong>the</strong>rn hemisphere landmasses, north andsouth of <strong>the</strong> current zone of maximum westerly w<strong>in</strong>d speeds(McGlone et al., 2000; Moreno et al., 2010; Fletcher and Moreno,2011; Ponce et al., 2011), reflect<strong>in</strong>g an <strong>in</strong>crease <strong>in</strong> westerly <strong>in</strong>tensity(Moreno et al., 2010). In conjunction with a trend toward lowertemperatures, this streng<strong>the</strong>n<strong>in</strong>g of <strong>the</strong> westerlies co<strong>in</strong>cides with<strong>the</strong> onset of neoglaciation <strong>in</strong> sou<strong>the</strong>rn South America and NewZealand (Moreno et al., 2009; Rojas and Moreno, 2010), bolsteredby enhanced upwell<strong>in</strong>g and northward advection of subpolarwaters off <strong>the</strong> coast of Chile dur<strong>in</strong>g <strong>the</strong> mid Holocene (Kaiser et al.,2008) and a steepen<strong>in</strong>g of <strong>the</strong> trans-Pacific SST gradient toward7e6 ka <strong>in</strong> <strong>the</strong> equatorial Pacific Ocean (Koutavas et al., 2006). Thissteepen<strong>in</strong>g of <strong>the</strong> trans-Pacific SST would, consequently, set upconditions <strong>in</strong> which an enhanced Walker Cell circulation and morefrequent ENSO events would prevail (sensu Shulmeister 1999;Koutavas et al., 2006). This scenario is consistent with a reconstructionof ENSO frequency that records an <strong>in</strong>tensification of ENSOafter w6ka(Fig. 6b; Moy et al., 2002).6.1.3. Late Holocene (w4e0 ka)The development of regional, zonal and meridional heterogeneitiesafter 5 ka was detected <strong>in</strong> all <strong>the</strong> sectors under analysis(Figs. 6 and 7). For example, an apparently <strong>in</strong>coherent pattern is
M.-S. Fletcher, P.I. Moreno / Quaternary International 253 (2012) 32e46 43evident <strong>in</strong> <strong>the</strong> multi-millennial trend toward lower moisture <strong>in</strong>northwest Patagonia (41 S), <strong>in</strong> opposition to an <strong>in</strong>crease <strong>in</strong> moisture<strong>in</strong> central Chile (33 S) and Southwest Patagonia and Tierra delFuego (52 S) after 5 ka. These trends were coeval with low lakelevels<strong>in</strong> sou<strong>the</strong>ast Australia (28 S) and southwest Victoria (35 S)and decreas<strong>in</strong>g moisture <strong>in</strong> western Tasmania (41 S), a pattern<strong>in</strong>g<strong>in</strong>consistent with <strong>the</strong> relationship between <strong>the</strong> SWW and precipitation<strong>in</strong> <strong>the</strong> modern climate of sou<strong>the</strong>rn Australia (Figs. 1b). Southof <strong>the</strong> modern core of <strong>the</strong> SWW, a multi-millennial <strong>in</strong>crease <strong>in</strong>moisture at Lago Guanaco and Laguna Potrok Aike implies<strong>in</strong>creas<strong>in</strong>g westerly <strong>in</strong>fluence <strong>in</strong> that region through <strong>the</strong> lateHolocene that is consistent with arguments for <strong>in</strong>creased westerlyflow after 5 ka over New Zealand (McGlone et al., 1993;Shulmeister, 1999; Shulmeister et al., 2004), yet is at odds with<strong>the</strong> decrease <strong>in</strong> aquatic pollen content at Okarito Bog (Figs. 6) andwhile it is possible that <strong>the</strong> Okarito Bog aquatic pollen contentreflects authigenic processes on <strong>the</strong> mire surface at this time, ra<strong>the</strong>rthan regional climate forc<strong>in</strong>g, <strong>the</strong> complex and regionally heterogeneoustrends <strong>in</strong> moisture across <strong>the</strong> Sou<strong>the</strong>rn Hemisphere afterw5 ka signals a departure from <strong>the</strong> marked zonal symmetry of <strong>the</strong>proceed<strong>in</strong>g period (14e5 ka), imply<strong>in</strong>g that multi-millennialmoisture balances were modulated by factors o<strong>the</strong>r than <strong>zonally</strong><strong>symmetric</strong> westerly changes.6.2. Possible mechanisms6.2.1. Insolation-driven westerly change?Precessional-scale changes <strong>in</strong> solar <strong>in</strong>solation are <strong>the</strong> mostcommonly <strong>in</strong>voked driver of multi-millennial scale changes <strong>in</strong>atmospheric circulation, via <strong>the</strong>ir effect on meridional temperaturegradients (e.g. Harrison and Dodson, 1993; Dodson, 1998; Mageeet al., 2004; Cruz et al., 2005; Gilli et al., 2005a, 2005b; Donderset al., 2007), although which component of <strong>in</strong>solation drivesglobal circulation is far from clear. Palaeoenvironmental data havebeen used to support hypo<strong>the</strong>ses of both <strong>in</strong>ter- and <strong>in</strong>tra-seasonal<strong>in</strong>solation gradients to expla<strong>in</strong> changes <strong>in</strong> <strong>the</strong> SWW over and s<strong>in</strong>ce<strong>the</strong> LGM (Harrison and Dodson, 1993; Dodson et al., 1998;Shulmeister et al., 2004). Our results tentatively support <strong>the</strong>notion of an <strong>in</strong>ter-seasonal driver of multi-millennial scale changes<strong>in</strong> <strong>the</strong> position and/or <strong>in</strong>tensity of <strong>the</strong> SWW over <strong>the</strong> last 14,000years, with a close relationship apparent between December<strong>in</strong>solation at 60 S (a proxy for <strong>the</strong> <strong>in</strong>ter-seasonal <strong>in</strong>solationgradient; Shulmeister et al., 2004) and trends <strong>in</strong> westerly w<strong>in</strong>ddrivenmoisture balances between 14 and 5 ka (Fig. 6a.). Theapparent breakdown <strong>in</strong> <strong>the</strong> relationship between <strong>in</strong>solation andmoisture balances after w5 ka may reflect <strong>the</strong> dom<strong>in</strong>ance ofclimate modes not directly related to precessional-scale <strong>in</strong>solation,such as ENSO, <strong>the</strong> Sou<strong>the</strong>rn Annular Mode, or <strong>the</strong> Pacific DecadalOscillation of <strong>the</strong> Pacific-South American Mode.6.2.2. A mid to late Holocene ENSO signal?Two possible explanations are proposed for <strong>the</strong> development ofregionally a<strong>symmetric</strong> trends <strong>in</strong> moisture balances of <strong>the</strong> sou<strong>the</strong>rnlandmasses after 5 ka: (1) a breakdown <strong>in</strong> <strong>the</strong> zonal symmetry of<strong>the</strong> SWW, or (2) <strong>the</strong> establishment of high-frequency precipitationvariability result<strong>in</strong>g from more frequent ENSO oscillations s<strong>in</strong>cew5ka (Figs. 6b; Moy et al. 2002). The geographic pattern<strong>in</strong>g ofmulti-millennial moisture trends after w5ka (Figs. 6 and 7) isremarkably consistent with <strong>the</strong> modern expression of ENSO <strong>in</strong> <strong>the</strong>climate of <strong>the</strong> Sou<strong>the</strong>rn Hemisphere (Power et al., 1999; Garreaudet al., 2009; Hill et al., 2009): <strong>the</strong> warm phase of ENSO (El Niño)results <strong>in</strong> <strong>the</strong> development of a strong high pressure cell below <strong>the</strong>southwest tip of sou<strong>the</strong>rn South America that deflects <strong>the</strong> zonalwesterlies north, result<strong>in</strong>g <strong>in</strong> anomalously dry conditions <strong>in</strong>northwest Patagonia and anomalously wet conditions <strong>in</strong> centralChile (Garreaud et al., 2009); while an anomalously high pressuresystem develops over sou<strong>the</strong>rn Australia result<strong>in</strong>g <strong>in</strong> dry conditionsalong <strong>the</strong> eastern seaboard of Australia and all of Tasmania (Poweret al., 1999; Hill et al., 2009). Evidence for <strong>the</strong> onset of ENSO <strong>in</strong> <strong>the</strong>western tropical Pacific after w5ka (Shulmeister and Lees, 1995;Wanner et al., 2008) and <strong>in</strong> <strong>the</strong> eastern tropical Pacific afterw6ka(Moy et al., 2002) supports this notion of ENSO driv<strong>in</strong>g <strong>the</strong>breakdown <strong>in</strong> zonal symmetry after w6e5 ka <strong>in</strong> <strong>the</strong> extra-tropicalregions analysed here.The paucity of data from sou<strong>the</strong>rn Africa <strong>in</strong> this analysisprecludes discussion of multi-millennial drivers of climate changethrough this period <strong>in</strong> that region, although evidence <strong>in</strong>dicatesenhanced climate variability <strong>in</strong> <strong>the</strong> late Holocene (Tyson et al., 2000;Lee Thorp et al., 2001). Jerard<strong>in</strong>o (1995) discusses <strong>the</strong> similaritiesbetween palaeoclimate records <strong>in</strong> sou<strong>the</strong>rn South America andsou<strong>the</strong>rn Africa over <strong>the</strong> last w5000 and <strong>the</strong>se f<strong>in</strong>d<strong>in</strong>gs, coupledwith evidence of an ENSO <strong>in</strong>fluence over modern South Africanclimate (Mason, 2001) and evidence for ENSO-like millennial-scaleclimate variability <strong>in</strong> sou<strong>the</strong>rn Africa (Holmgren et al., 2003), altoge<strong>the</strong>r,suggest that ENSO may have played a part <strong>in</strong> this region also.6.3. The Sou<strong>the</strong>rn Westerly W<strong>in</strong>ds and atmospheric CO 2Toggweiler et al. (2006) proposed that <strong>the</strong> SWW play a centralrole <strong>in</strong> govern<strong>in</strong>g global atmospheric CO 2 content via w<strong>in</strong>d-drivenupwell<strong>in</strong>g and ventilation of CO 2 -rich deep waters <strong>in</strong> <strong>the</strong>Sou<strong>the</strong>rn Ocean, a notion that has received considerable attention(e.g. Tschumi et al., 2008; Anderson et al., 2009; Sijp and England,2009; Toggweiler, 2009; Moreno et al., 2010; Sijp et al., 2010;Fletcher and Moreno, 2011). In a recent syn<strong>the</strong>sis of a number ofselected Sou<strong>the</strong>rn Hemisphere palaeoenvironmental records,Fletcher and Moreno (2011) argue for a southward displacement of<strong>the</strong> SWW at w12.5 ka that <strong>in</strong>itiated a phase of enhanced w<strong>in</strong>ddrivenoceanic upwell<strong>in</strong>g at circumpolar sites located >52 S(Anderson et al., 2009), driv<strong>in</strong>g an <strong>in</strong>crease <strong>in</strong> atmospheric CO 2 viaenhanced ventilation of <strong>the</strong> Sou<strong>the</strong>rn Ocean (Toggweiler et al.,2006; Toggweiler, 2009). This was followed by a weaken<strong>in</strong>g ofwesterly flow across <strong>the</strong> entire zone of westerly <strong>in</strong>fluence, as<strong>in</strong>dicated by a cessation of westerly driven oceanic upwell<strong>in</strong>g <strong>in</strong> <strong>the</strong>sub-polar Sou<strong>the</strong>rn Ocean (Anderson et al., 2009), a reversal of <strong>the</strong>atmospheric CO 2 trend and negative westerly derived moisturenorth (Lago Condorito) and south (Lago Guanaco) of <strong>the</strong> modernwesterly core, a notion supported by <strong>the</strong> ample evidence presented<strong>in</strong> <strong>the</strong> present paper and by palaeoenvironmental reconstructionsfrom sub-Antarctic sites (>52 S) <strong>in</strong> New Zealand (McGlone et al.,2000, 2010), Southwest Patagonia (Fesq-Mart<strong>in</strong> et al., 2004; Lamyet al. 2010), Tierra del Fuego (Heusser, 2003) and Isla de los Estados(Ponce et al., 2011) for decreased westerly flow between 11 and8 ka, and by substantial evidence that changes <strong>in</strong> SWW <strong>in</strong>tensityare at least as important as latitud<strong>in</strong>al displacements for driv<strong>in</strong>gCO 2 fluxes out of <strong>the</strong> deep ocean at high sou<strong>the</strong>rn latitudes(Tschumi et al., 2008; Sijp and England, 2009; Sijp et al., 2010). Theevidence for a multi-millennial <strong>in</strong>crease <strong>in</strong> SWW flow after w8kaisconsistent with <strong>the</strong> multi-millennial <strong>in</strong>crease <strong>in</strong> atmospheric CO 2content (EPICA, 2004) (see Moreno et al., 2010; Fletcher andMoreno, 2011) and which appears to be unaffected by <strong>the</strong> breakdown<strong>in</strong> zonal symmetry evident after w5 ka at sites located above50 S, suggest<strong>in</strong>g that <strong>the</strong> onset of ENSO variability <strong>in</strong> <strong>the</strong> tropicaland extra-tropical Pacific did not affect <strong>the</strong> SWW-Sou<strong>the</strong>rn Oceancoupled system (sensu Fletcher and Moreno, 2011).7. ConclusionThis syn<strong>the</strong>sis and analysis represents <strong>the</strong> first attempt atreconstruct<strong>in</strong>g changes <strong>in</strong> <strong>the</strong> globally important Sou<strong>the</strong>rn
44M.-S. Fletcher, P.I. Moreno / Quaternary International 253 (2012) 32e46Westerly W<strong>in</strong>ds (SWW) s<strong>in</strong>ce 14 ka based on palaeoenvironmentaldata from all Sou<strong>the</strong>rn Hemisphere landmasses. This <strong>in</strong>tervalshows a clear multi-millennial zonal symmetry of SWW, which isgreatest between 14 and 5 ka, with a strik<strong>in</strong>g degree of synchronyand co-variability that clearly mirrors <strong>the</strong> modern relationshipbetween zonal westerly w<strong>in</strong>d speed and precipitation across <strong>the</strong>Sou<strong>the</strong>rn Hemisphere. A breakdown <strong>in</strong> zonal symmetry co<strong>in</strong>cidedwith <strong>the</strong> onset of ENSO variability after w6-5 ka, possibly reflect<strong>in</strong>g<strong>the</strong> <strong>in</strong>fluence of <strong>in</strong>solation-driven changes on <strong>the</strong> pole to equator<strong>the</strong>rmal gradient on atmospheric circulation. A steepened gradientat this time would have driven stronger westerly w<strong>in</strong>ds anda general <strong>in</strong>crease <strong>in</strong> <strong>the</strong> <strong>in</strong>tensity of atmospheric circulation which,<strong>in</strong> turn, may have driven changes <strong>in</strong> oceanic circulation that alteredoceanic SST and SLP gradients, trigger<strong>in</strong>g <strong>in</strong>tensified Walker Cellcirculation and <strong>the</strong> onset of an ENSO-dom<strong>in</strong>ated climate. This<strong>in</strong>terpretation of <strong>zonally</strong> <strong>symmetric</strong> changes <strong>in</strong> <strong>the</strong> westerliesthrough much of <strong>the</strong> last 14,000 years lends significant support tonotions of a SWW driver of global atmospheric CO 2 content viaw<strong>in</strong>d-driven overturn<strong>in</strong>g and ventilation of <strong>the</strong> Sou<strong>the</strong>rn Ocean.The data analysed here only allows hemisphere-wide comparisonat multi-millennial timescales and focus now needs to be directedat develop<strong>in</strong>g high-resolution and precisely dated palaeoenvironmentalrecords targeted <strong>in</strong> areas with<strong>in</strong> <strong>the</strong> entire zone ofwesterly <strong>in</strong>fluence, north and south of w50 S, that specificallyaccounts for and addresses <strong>the</strong> heterogeneous manner <strong>in</strong> whichwesterlies impact upon <strong>the</strong> climate of sou<strong>the</strong>rn landmasses andwhich will allow comparisons of millennial and centennial scaletrends.AcknowledgementsM.-S.F. is funded by <strong>the</strong> Institute of Ecology and Biodiversity,Chile, and Fondecyt 3110180. P.I.M. is funded by Fondecyt 1080485,1110612 and Iniciativa Científica Milenio P05-002, contract PFB-23.We would like to thank René Garreaud for discussions on <strong>the</strong>mechanics of Sou<strong>the</strong>rn Hemisphere climate. Comments on anearlier draft of <strong>the</strong> manuscript by Peter Kershaw and two anonymousreferees were much appreciated.ReferencesAbarzúa, A.M., Moreno, P.I., 2008. Chang<strong>in</strong>g fire regimes <strong>in</strong> <strong>the</strong> temperate ra<strong>in</strong>forestregion of sou<strong>the</strong>rn Chile over <strong>the</strong> last 16,000 yr. Quaternary Research 69 (1),62e71.Abarzúa, A.M., Villagran, C., Moreno, P.I., 2004. Deglacial and postglacial climatehistory <strong>in</strong> east-central Isla Grande de Chiloe, sou<strong>the</strong>rn Chile (43 S). QuaternaryResearch 62, 49e59.Anderson, B., Mack<strong>in</strong>tosh, A., 2006. Temperature change is <strong>the</strong> major driver of late-Glacial and Holocene glacier fluctuations <strong>in</strong> New Zealand. Geology 34 (2), 121.Anderson, R.F., Ali, S., Bratmiller, L.I., Nielsen, S.H.H., Fleisher, M.Q., Anderson, B.E.,Burkle, L.H., 2009. W<strong>in</strong>d-driven upwell<strong>in</strong>g <strong>in</strong> <strong>the</strong> sou<strong>the</strong>rn ocean and <strong>the</strong>deglacial rise <strong>in</strong> atmospheric CO 2 . Science 323, 1443e1448.Anselmetti, F.S., Ariztegui, D., De Batist, M., Gebhardt, A.C., Haberzettl, T., Niessen, F.,Ohlendorf, C., Zolitschka, B., 2009. Environmental history of sou<strong>the</strong>rn Patagoniaunravelled by <strong>the</strong> seismic stratigraphy of Laguna Potrok Aike. Sedimentology 56(4), 873e892.Ariztegui, D., Gilli, A., Anselmetti, F.S., Goñi, R.A., Belardi, J.B., Esp<strong>in</strong>osa, S., 2009.Lake-level changes <strong>in</strong> central Patagonia (Argent<strong>in</strong>a): cross<strong>in</strong>g environmentalthresholds for Lateglacial and Holocene human occupation. Journal of QuaternaryScience. doi:10.1002/jqs.1352.Barrows, T.T., Lehman, S.J., Fifield, L.K., De Deckker, P., 2007. Absence of cool<strong>in</strong>g <strong>in</strong>New Zealand and <strong>the</strong> adjacent ocean dur<strong>in</strong>g <strong>the</strong> Younger Dryas chronozone.Science 318 (5847), 86.Berger, A.L., 1978. Long-term variations of daily <strong>in</strong>solation and Quaternary climaticchanges. Journal of <strong>the</strong> Atmospheric Sciences 35 (12), 2362e2367.Bowler, J.M., Hamada, T., 1971. Late Quaternary stratigraphy and radiocarbonchronology of water level fluctuations <strong>in</strong> Lake Keilambete, Victoria. Nature 232,330e332.Bowman, D.M.J.S., 2000. Australian Ra<strong>in</strong>forests: Islands of Green <strong>in</strong> a Land of Fire.Cambridge University Press, Cambridge.Bradbury, J.P., 1986. Late Pleistocene and Holocene palaeolimnology of twomounta<strong>in</strong> lakes <strong>in</strong> western Tasmania. Palaios 1, 318e388.Brugam, R.B., McCance Johnson, S., 1997. Holocene lake-level rise <strong>in</strong> <strong>the</strong> UpperPen<strong>in</strong>sula of Michigan, USA, as <strong>in</strong>dicated by peatland growth. The Holocene 7(3), 355e359.Cep, B., 1923. Variations <strong>in</strong> <strong>the</strong> level of Lake George, Australia. Nature 112, 918.Cruz, F.W., Burns, S.J., Karmann, I., Sharp, W.D., Vuille, M., Cardoso, A.O., Ferrari, J.A.,Dias, P.L.S., Viana, O., 2005. Insolation-driven changes <strong>in</strong> atmospheric circulationover <strong>the</strong> past 116,000 years <strong>in</strong> subtropical Brazil. Nature 434 (7029), 63e66.Dale, M.B., Allison, L., Dale, P.E.R., 2010. A model for correlation with<strong>in</strong> clusters andits use <strong>in</strong> pollen analysis. Community Ecology 11 (1), 51e58.De Deckker, P., 1982. Late Quaternary ostracods from Lake George New South Wales.Alcher<strong>in</strong>ga 6, 305e318.Denton, G.H., Anderson, R.F., Toggweiler, J.R., Edwards, R.L., Schaefer, J.M.,Putnam, A.E., 2010. The Last Glacial Term<strong>in</strong>ation. Science 328 (5986), 1652.Denton, G.H., Hendy, C.H., 1994. Younger Dryas age advance of Franz Josef glacier <strong>in</strong><strong>the</strong> sou<strong>the</strong>rn alps of New Zealand. Science 264 (5164), 1434.Dixie, L.F., 1881. Across Patagonia. R. Worth<strong>in</strong>gton, London.Dodson, J.R., 1998. Tim<strong>in</strong>g and response of vegetation change to Milankovitchforc<strong>in</strong>g <strong>in</strong> temperate Australia and New Zealand. Global and Planetary Change18 (3e4), 161e174.Dodson, J.R., Mitchell, F.J.G., Bogeholz, H., Julian, N., 1998. Dynamics of temperatera<strong>in</strong>forest from f<strong>in</strong>e resolution pollen analysis, Upper R<strong>in</strong>garooma River,nor<strong>the</strong>astern Tasmania. Australian Journal of Ecology 23, 550e561.Donders, T.H., Haberle, S., Hope, G., Wagner, F., Visscher, H., 2007. Pollen evidencefor <strong>the</strong> transition of <strong>the</strong> Eastern Australian climate system from <strong>the</strong> post-glacialto <strong>the</strong> present-day ENSO mode. Quaternary Science Reviews 26, 1621e1637.Eeley, H.A.C., Lawes, M.J., Piper, S.E., 1999. The <strong>in</strong>fluence of climate change on <strong>the</strong>distribution of <strong>in</strong>digenous forest <strong>in</strong> KwaZulu-Natal, South Africa. Journal ofBiogeography 26 (3), 595e617.EPICA, 2004. Eight glacial cycles from an Antarctic ice core. Nature 429, 623e628.Fesq-Mart<strong>in</strong>, M., Friedmann, A., Peters, M., Behrmann, J., Kilian, R., 2004. Late-glacialand Holocene vegetation history of <strong>the</strong> Magellanic ra<strong>in</strong> forest <strong>in</strong> southwesternPatagonia, Chile. Vegetation History and Archaeobotany 13 (4), 249e255.F<strong>in</strong>ch, J.M., Hill, T.R., 2008. A late Quaternary pollen sequence from Mfabeni Peatland,South Africa: reconstruct<strong>in</strong>g forest history <strong>in</strong> Maputaland. QuaternaryResearch 70 (3), 442e450.Fitzharris, B.B., Hay, J.E., Jones, P.D., 1992. Behaviour of New Zealand glaciers andatmospheric circulation changes over <strong>the</strong> past 130 years. The Holocene 2 (2),97e106.Fitzsimmons, K.E., Barrows, T.T., 2010. Holocene hydrologic variability <strong>in</strong> temperatesou<strong>the</strong>astern Australia: an example from Lake George, New South Wales. TheHolocene 20 (4), 585e597.Fitzsimons, S.J., 1997. Late-glacial and early Holocene glacier activity <strong>in</strong> <strong>the</strong> Sou<strong>the</strong>rnAlps, New Zealand. Quaternary International 38, 69e76.Fletcher, M.-S., Moreno, P.I., 2011. Zonally <strong>symmetric</strong> changes <strong>in</strong> <strong>the</strong> strength andposition of <strong>the</strong> Sou<strong>the</strong>rn <strong>Westerlies</strong> drove atmospheric CO 2 variations over <strong>the</strong>past 14 ky. Geology 39 (5), 419e422.Fletcher, M.-S., Thomas, I., 2010a. The orig<strong>in</strong> and temporal development of anancient cultural landscape. Journal of Biogeography 37 (11), 2183e2196.Fletcher, M.-S., Thomas, I., 2010b. A quantitative late Quaternary temperaturereconstruction from western Tasmania, Australia. Quaternary Science Reviews29, 2351e2361.Futyma, R.P., Miller, N.G., 1986. Stratigraphy and genesis of <strong>the</strong> Lake Sixteen peatland,nor<strong>the</strong>rn Michigan. Canadian Journal of Botany 64 (12), 3008e3019.Garreaud, R.D., 2007. Precipitation and circulation covariability <strong>in</strong> <strong>the</strong> extratropics.Journal of Climate 20 (18), 4789e4797.Garreaud, R.D., Vuille, M., Compagnucci, R., Marengo, J., 2009. Present-day SouthAmerican climate. Palaeogeography, Palaeoclimatology, Palaeoecology 281(3e4), 180e195.Gellatly, A.F., Ch<strong>in</strong>n, T.J.H., Röthlisberger, F., 1988. Holocene glacier variations <strong>in</strong> NewZealand: a review. Quaternary Science Reviews 7 (2), 227e242.Gentilli, J., 1972. Australian Climate Patterns. The Griff<strong>in</strong> Press, Adelaide.Gilli, A., Anselmetti, F.S., Ariztegui, D., Beres, M., McKenzie, J.A., Markgraf, V., 2005a.Seismic stratigraphy, buried beach ridges and contourite drifts: <strong>the</strong> lateQuaternary history of <strong>the</strong> closed Lago Cardiel bas<strong>in</strong>, Argent<strong>in</strong>a (49 S). Sedimentology52 (1), 1e23.Gilli, A., Ariztegui, D., Anselmetti, F.S., McKenzie, J.A., Markgraf, V., Hajdas, I.,McCulloch, R.D., 2005b. Mid-Holocene streng<strong>the</strong>n<strong>in</strong>g of <strong>the</strong> Sou<strong>the</strong>rn <strong>Westerlies</strong><strong>in</strong> South America e sedimentological evidences from Lago Cardiel,Argent<strong>in</strong>a (49 S). Global and Planetary Change 49 (1e2), 75e93.G<strong>in</strong>gele, F., De Deckker, P., Norman, M., 2007. Late Pleistocene and Holoceneclimate of SE Australia reconstructed from dust and river loads depositedoffshore <strong>the</strong> River Murray Mouth. Earth and Planetary Science Letters 255(3e4), 257e272.Haberle, S.G., Bennett, K.D., 2004. Postglacial formation and dynamics of NorthPatagonian ra<strong>in</strong>forest <strong>in</strong> <strong>the</strong> Chonos Archipelago, Sou<strong>the</strong>rn Chile. QuaternaryScience Reviews 23 (23e24), 2433e2452.Harrison, S.P., 1993. Late Quaternary lake-level changes and climates of Australia.Quaternary Science Reviews 12 (4), 211e231.Harrison, S.P., Dodson, J.R., 1993. Climates of Australia and New Gu<strong>in</strong>ea s<strong>in</strong>ce18,000 yr B.P. In: Wright Jr., H.E., Kutzbach, J.E., Webb III, T., Ruddiman, W.F.,Street-Perrot, F.A., Bartle<strong>in</strong>, P.J. (Eds.), Global Climates S<strong>in</strong>ce <strong>the</strong> Last GlacialMaximum. University of M<strong>in</strong>nesota Press, M<strong>in</strong>neapolis, MN, pp. 265e293.Hendon, H.H., Thompson, D.W.J., Wheeler, M.C., 2007. Australian ra<strong>in</strong>fall andsurface temperature variations associated with <strong>the</strong> Sou<strong>the</strong>rn Hemisphereannular mode. Journal of Climate 20 (11), 2452e2467.
M.-S. Fletcher, P.I. Moreno / Quaternary International 253 (2012) 32e46 45Hesse, P.P., Magee, J.W., van der Kaars, S., 2004. Late Quaternary climates of <strong>the</strong>Australian arid zone: a review. Quaternary International 118, 87e102.Heusser, C.J., 1989a. Letter to <strong>the</strong> editor: Sou<strong>the</strong>rn <strong>Westerlies</strong> dur<strong>in</strong>g <strong>the</strong> Last GlacialMaximum. Quaternary Research 31, 423e425.Heusser, C.J., 1989b. Polar perspective of late-Quaternary climates <strong>in</strong> <strong>the</strong> Sou<strong>the</strong>rnHemisphere. Quaternary Research 32 (1), 60e71.Heusser, C.J., 2003. Ice Age Sou<strong>the</strong>rn Andes: A Chronicle of Paleoecological Events.Elsevier Science.Hill, K.J., Santoso, A., England, M.H., 2009. Interannual Tasmanian ra<strong>in</strong>fall variabilityassociated with large-scale climate modes. Journal of Climate 22, 4383e4397.Holmgren, K., Lee-Thorp, J.A., Cooper, G.R.J., Lundblad, K., Partridge, T.C., Scott, L.,Sithaldeen, R., Siep Talma, A., Tyson, P.D., 2003. Persistent millennial-scaleclimatic variability over <strong>the</strong> past 25,000 years <strong>in</strong> Sou<strong>the</strong>rn Africa. QuaternaryScience Reviews 22 (21e22), 2311e2326.Huber, U.M., Markgraf, V., 2003. European impact on fire regimes and vegetationdynamics at <strong>the</strong> steppe-forest ecotone of sou<strong>the</strong>rn Patagonia. The Holocene 13(4), 567e579.Huber, U.M., Markgraf, V., Schäbitz, F., 2004. Geographical and temporal trends <strong>in</strong>late Quaternary fire histories of Fuego-Patagonia, South America. QuaternaryScience Reviews 23 (9e10), 1079e1097.Hunt<strong>in</strong>gton, M.A.M., Libbey, W., Morris, F., Brigham, A.P., Stevenson, E.L., 1908. LakeGeorge, Australia. Bullet<strong>in</strong> of <strong>the</strong> American Geographical Society 40 (4),217e220.Jenn<strong>in</strong>gs, J., 1981. The rise and fall of Lake George. Geographical Journal 53,852e858.Jenny, B., Valero-Garcés, B.L., Villa-Martínez, R., Urrutia, R., Geyh, M., Veit, H., 2002.Early to mid-Holocene aridity <strong>in</strong> Central Chile and <strong>the</strong> Sou<strong>the</strong>rn <strong>Westerlies</strong>: <strong>the</strong>Laguna Aculeo record (34 S). Quaternary Research 58 (2), 160e170.Jenny, B., Wilhem, D., Valero-Garces, B.L., 2003. The Sou<strong>the</strong>rn <strong>Westerlies</strong> <strong>in</strong> CentralChile: Holocene precipitation estimates based on a water balance model forLaguna Aculeo (33 50 0 S). Climate Dynamics 20, 269e280.Jerard<strong>in</strong>o, A., 1995. Late Holocene Neoglacial episodes <strong>in</strong> sou<strong>the</strong>rn South Americaand sou<strong>the</strong>rn Africa: a comparison. The Holocene 5, 361e368.Johnson, B.J., Miller, G.H., Fogel, M.L., Magee, J.W., Gagan, M.K., Chivas, A.R., 1999.65,000 years of vegetation change <strong>in</strong> central Australia and <strong>the</strong> Australiansummer monsoon. Science 284 (5417), 1150.Jones, R.N., Bowler, J.M., McMahon, T.A., 1998. A high resolution Holocene record ofP/E ratio from closed lakes <strong>in</strong> Western Victoria. Palaeoclimates 3, 51e82.Kaiser, J., Schefuß, E., Lamy, F., Mohtadi, M., Hebbeln, D., 2008. Glacial to Holocenechanges <strong>in</strong> sea surface temperature and coastal vegetation <strong>in</strong> north centralChile: high versus low latitude forc<strong>in</strong>g. Quaternary Science Reviews 27 (21e22),2064e2075.Korhola, A., 1995. Holocene climatic variations <strong>in</strong> sou<strong>the</strong>rn F<strong>in</strong>land reconstructedfrom peat-<strong>in</strong>itiation data. The Holocene 5 (1), 43e57.Koutavas, A., Demenocal, P.B., Olive, G.C., Lynch-Stieglitz, J., 2006. Mid-Holocene ElNiñoeSou<strong>the</strong>rn Oscillation (ENSO) attenuation revealed by <strong>in</strong>dividual foram<strong>in</strong>ifera<strong>in</strong> eastern tropical Pacific sediments. Geology 34 (12), 993e996.Lamy, F., Hebbeln, D., Wefer, G., 1999. High-resolution mar<strong>in</strong>e record of climaticchange <strong>in</strong> Mid-latitude Chile dur<strong>in</strong>g <strong>the</strong> last 28,000 years based on terrigenoussediment parameters. Quaternary Research 51 (1), 83e93.Lamy, F., Kilian, R., Arz, H.W., Francois, J.P., Kaiser, J., Prange, M., Ste<strong>in</strong>ke, T., 2010.Holocene changes <strong>in</strong> <strong>the</strong> position and <strong>in</strong>tensity of <strong>the</strong> sou<strong>the</strong>rn westerly w<strong>in</strong>dbelt. Nature Geoscience, 695e699.Latorre, C., Moreno, P.I., Vargas, G., Maldonado, A., Villa-Martínez, R., Armesto, J.J.,Villagrán, C., P<strong>in</strong>o, M., Núñez, L., Grosjean, M., 2007. Late Quaternary environmentsand palaeoclimate. In: Moreno, T., Gibbons, W. (Eds.), The Geology ofChile. The Geological Society Publish<strong>in</strong>g House, Bath, pp. 309e328.Lee Thorp, J.A., Holmgren, K., Lauritzen, S.E., L<strong>in</strong>ge, H., Moberg, A., Partridge, T.C.,Stevenson, C., Tyson, P.D., 2001. Rapid climate shifts <strong>in</strong> <strong>the</strong> sou<strong>the</strong>rn African<strong>in</strong>terior throughout <strong>the</strong> mid to late Holocene. Geophysical Research Letters 28(23), 4507e4510.Lowell, T.V., Heusser, C.J., Andersen, B.G., Moreno, P.I., Hauser, A., Heusser, L.E.,Schluchter, C., Marchant, D.R., Denton, G.H., 1995. Interhemispheric correlationof late Pleistocene glacial events. Science 269 (5230), 1541e1549.Macphail, M.K., 1979. Vegetation and climates <strong>in</strong> sou<strong>the</strong>rn Tasmania s<strong>in</strong>ce <strong>the</strong> lastglaciation. Quaternary Research 11, 306e341.Magee, J.W., Miller, G.H., Spooner, N.A., Questiaux, D., 2004. Cont<strong>in</strong>uous 150 kymonsoon record from Lake Eyre, Australia: <strong>in</strong>solation-forc<strong>in</strong>g implications andunexpected Holocene failure. Geology 32 (10), 885e888.Manc<strong>in</strong>i, M.V., Prieto, A.R., Paez, M.M., Schäbitz, F., Rabassa, J., 2008. Late Quaternaryvegetation and climate of Patagonia. In: Developments <strong>in</strong> Quaternary Science,vol. 11. Elsevier, pp. 351e367.Markgraf, V., 1987. Paleoenvironmental changes at <strong>the</strong> nor<strong>the</strong>rn limit of <strong>the</strong>subantarctic Nothofagus forest, lat 37 S, Argent<strong>in</strong>a. Quaternary Research 28 (1),119e129.Markgraf, V., 1989. Reply to CJ Heusser’s “Sou<strong>the</strong>rnwesterlies dur<strong>in</strong>g <strong>the</strong> last glacialmaximum.” Quaternary Research 31 (3), 426e432.Markgraf, V., 1993. Climatic history of Central and South America s<strong>in</strong>ce18 000 yr BP: comparison of pollen records and model simulations. In:Wright Jr., H.E., Kutzbach, J.E., Webb III, T., Ruddiman, W.F., Street-Perrot, F.A.,Bartle<strong>in</strong>, P.J. (Eds.), Global Climates S<strong>in</strong>ce <strong>the</strong> Last Glacial Maximum. Universityof M<strong>in</strong>nesota Press, M<strong>in</strong>neapolis, MN, pp. 357e385.Markgraf, V., Baumgartner, T.R., Bradbury, J.P., Diaz, H.F., 2000. Paleoclimatereconstruction along <strong>the</strong> PoleeEquatorePole transect of <strong>the</strong> Americas (PEP 1).Quaternary Science Reviews 19 (1e5), 125e140.Markgraf, V., Bradbury, J.P., Busby, J.R., 1986. Palaeoclimates <strong>in</strong> southwestern Tasmaniadur<strong>in</strong>g <strong>the</strong> last 13,000 years. Palios 1, 368e380.Markgraf, V., Bradbury, J.P., Schwalb, A., Burns, S.J., Stern, C., Ariztegui, D., Gilli, A.,Anselmetti, F.S., St<strong>in</strong>e, S., Maidana, N., 2003. Holocene palaeoclimates ofsou<strong>the</strong>rn Patagonia: limnological and environmental history of Lago Cardiel,Argent<strong>in</strong>a. The Holocene 13, 581e591.Markgraf, V., D’Antoni, H.L., Ager, T.A., 1981. Modern pollen dispersal <strong>in</strong> Argent<strong>in</strong>a.Palynology 5, 43e63.Markgraf, V., Dodson, J.R., Kershaw, P.A., McGlone, M.S., Nicholls, N., 1992. Evolutionof late Pleistocene and Holocene climates <strong>in</strong> <strong>the</strong> circum-south pacific land areas.Climate Dynamics 6 (3e4), 193e211.Markgraf, V., Huber, U.M., 2010. Late and postglacial vegetation and fire history <strong>in</strong>Sou<strong>the</strong>rn Patagonia and Tierra del Fuego. Palaeogeography, Palaeoclimatology,Palaeoecology 297 (2), 351e366.Markgraf, V., Whitlock, C., Haberle, S., 2007. Vegetation and fire history dur<strong>in</strong>g <strong>the</strong>last 18,000 cal yr BP <strong>in</strong> Sou<strong>the</strong>rn Patagonia: Mallín Pollux, Coyhaique, Prov<strong>in</strong>ceAisén (45 41 0 30 00 S, 71 50 0 30 00 W, 640 m elevation). Palaeogeography, Palaeoclimatology,Palaeoecology 254 (3e4), 492e507.Mason, S.J., 2001. El Niño, climate change, and Sou<strong>the</strong>rn African climate. Environmetrics12 (4), 327e345.Massaferro, J., Brooks, S.J., Haberle, S.G., 2005. The dynamics of chironomidassemblages and vegetation dur<strong>in</strong>g <strong>the</strong> late Quaternary at Laguna Facil, ChonosArchipelago, sou<strong>the</strong>rn Chile. Quaternary Science Reviews 24 (23e24),2510e2522.Massaferro, J.I., Moreno, P.I., Denton, G.H., Vandergoes, M., Dieffenbacher-Krall, A.,2009. Chironomid and pollen evidence for climate fluctuations dur<strong>in</strong>g <strong>the</strong> LastGlacial Term<strong>in</strong>ation <strong>in</strong> NW Patagonia. Quaternary Science Reviews 28 (5e6),517e525.McCarthy, A., Mack<strong>in</strong>tosh, A., Rieser, U., F<strong>in</strong>k, D., 2008. Mounta<strong>in</strong> glacier chronologyfrom Boulder Lake, New Zealand, Indicates MIS 4 and MIS 2 IceAdvances of Similar Extent. Arctic, Antarctic, and Alp<strong>in</strong>e Research 40 (4),695e708.McGlone, M.S., Moar, N.T., 1998. Dryland Holocene vegetation history, Central Otagoand <strong>the</strong> Mackenzie Bas<strong>in</strong>, South Island, New Zealand. New Zealand Journal ofBotany 36 (1), 91e111.McGlone, M.S., Sal<strong>in</strong>ger, M.J., Moar, N.T., Kutzbach, J.E., Webb III, T., Ruddiman, W.F.,Street-Perrott, F.A., Bartle<strong>in</strong>, P.J., 1993. Paleovegetation studies of New Zealand’sclimate s<strong>in</strong>ce <strong>the</strong> last glacial maximum. In: Wright Jr., H.E., Kutzbach, J.E.,Webb III, T., Ruddiman, W.F., Street-Perrot, F.A., Bartle<strong>in</strong>, P.J. (Eds.), GlobalClimates S<strong>in</strong>ce <strong>the</strong> Last Glacial Maximum. University of M<strong>in</strong>nesota Press,M<strong>in</strong>neapolis, MN, pp. 294e317.McGlone, M.S., Turney, C.S.M., Wilmshurst, J.M., Renwick, J., Pahnke, K., 2010.Divergent trends <strong>in</strong> land and ocean temperature <strong>in</strong> <strong>the</strong> Sou<strong>the</strong>rn Ocean over <strong>the</strong>past 18,000 years. Nature Geoscience 3 (9), 622e626.McGlone, M.S., Wilmshurst, J.M., Wiser, S.K., 2000. Lateglacial and Holocene vegetationand climatic change on Auckland Island, subantarctic New Zealand. TheHolocene 10 (6), 719e728.McWethy, D.B., Whitlock, C., Wilmshurst, J.M., McGlone, M.S., Li, X., 2009. Rapiddeforestation of South Island, New Zealand, by early Polynesian fires. TheHolocene 19 (6), 883e897.Meadows, M.E., 1988. Late Quaternary peat accumulation <strong>in</strong> sou<strong>the</strong>rn Africa. Catena15 (5), 459e472.Meadows, M.E., Baxter, A.J., 1999. Late Quaternary palaeoenvironments of <strong>the</strong>southwestern Cape, South Africa: a regional syn<strong>the</strong>sis. Quaternary International57, 193e206.Meadows, M.E., Baxter, A.J., 2001. Holocene vegetation history and palaeoenvironmentsat Klaarfonte<strong>in</strong> Spr<strong>in</strong>gs, Western Cape, South Africa. The Holocene 11 (6),699e706.Meadows, M.E., Baxter, A.J., Park<strong>in</strong>gton, J., 1996. Late Holocene environments atVerlorenvlei, Western Cape Prov<strong>in</strong>ce, South Africa. Quaternary International 33,81e95.Meadows, M.E., Sugden, J.M., 1991. A vegetation history of <strong>the</strong> last 14,000 years on<strong>the</strong> Cederberg, south-western Cape Prov<strong>in</strong>ce. South African Journal of Science87 (1), 34e43.Middleton, J.F., Bye, J.A.T., 2007. A review of <strong>the</strong> shelf-slope circulation along Australia’ssou<strong>the</strong>rn shelves: Cape Leeuw<strong>in</strong> to Portland. Progress <strong>in</strong> Oceanography75 (1), 1e41.Moreno, P.I., 2004. Millennial-scale climate variability <strong>in</strong> northwest Patagonia over<strong>the</strong> last 15000 yr. Journal of Quaternary Science 19 (1), 35e47.Moreno, P.I., Francois, J.P., Moy, C.M., Villa-Mart<strong>in</strong>ez, R., 2010. Covariability of <strong>the</strong>Sou<strong>the</strong>rn <strong>Westerlies</strong> and atmospheric CO 2 dur<strong>in</strong>g <strong>the</strong> Holocene. Geology 38 (8),727e730.Moreno, P.I., Francois, J.P., Villa-Mart<strong>in</strong>ez, R.P., Moy, C.M., 2009. Millennial-scalevariability <strong>in</strong> Sou<strong>the</strong>rn Hemisphere westerly w<strong>in</strong>d activity over <strong>the</strong> last 5000years <strong>in</strong> SW Patagonia. Quaternary Science Reviews 28 (1e2), 25e38.Moreno, P.I., Leon, A.L., 2003. Abrupt vegetation changes dur<strong>in</strong>g <strong>the</strong> last glacial toHolocene transition <strong>in</strong> mid-latitude South America. Journal of QuaternaryScience 18 (8), 787e800.Moreno, P.I., Lowell, T.V., Jacobson, G.L., Denton, G.H., 1999. Abrupt vegetation andclimate changes dur<strong>in</strong>g <strong>the</strong> last glacial maximum and last term<strong>in</strong>ation <strong>in</strong> <strong>the</strong>Chilean Lake District: A case study from Canal de la Puntilla (41 S). GeografiskaAnnaler Series A: Physical Geography 81A (2), 285e311.Moros, M., De Deckker, P., Jansen, E., Perner, K., Telford, R.J., 2009. Holocene climatevariability <strong>in</strong> <strong>the</strong> Sou<strong>the</strong>rn Ocean recorded <strong>in</strong> a deep-sea sediment core offSouth Australia. Quaternary Science Reviews 28, 1932e1940.
46M.-S. Fletcher, P.I. Moreno / Quaternary International 253 (2012) 32e46Moy, C.M., Dunbar, R.B., Moreno, P.I., Francois, J.P., Villa-Mart<strong>in</strong>ez, R.,Mucciarone, D.M., Guilderson, T.P., Garreaud, R.D., 2008. Isotopic evidence forhydrologic change related to <strong>the</strong> westerlies <strong>in</strong> SW Patagonia, Chile, dur<strong>in</strong>g <strong>the</strong>last millennium. Quaternary Science Reviews 27 (13e14), 1335e1349.Moy, C.M., Seltzer, G.O., Rodbell, D.T., Anderson, D.M., 2002. Variability of El N<strong>in</strong>o/Sou<strong>the</strong>rn Oscillation activity at millennial timescales dur<strong>in</strong>g <strong>the</strong> Holocene.Nature 420, 162e165.Muc<strong>in</strong>a, L., Ru<strong>the</strong>rford, M.C., 2006. The Vegetation of South Africa, Lesotho andSwaziland.Newnham, R.M., Vandergoes, M.J., Hendy, C.H., Lowe, D.J., Preusser, F., 2007.A terrestrial palynological record for <strong>the</strong> last two glacial cycles from southwesternNew Zealand. Quaternary Science Reviews 26 (3e4), 517e535.Nicholson, S.E., Flohn, H., 1980. African environmental and climatic changes and <strong>the</strong>general atmospheric circulation <strong>in</strong> late Pleistocene and Holocene. ClimaticChange 2 (4), 313e348.Ono, Y., Shulmeister, J., Lehmkuhl, F., Asahi, K., Aoki, T., 2004. Tim<strong>in</strong>gs and causes ofglacial advances across <strong>the</strong> PEP-II transect (East-Asia to Antarctica) dur<strong>in</strong>g <strong>the</strong>last glaciation cycle. Quaternary International 118e119, 55e68.Paez, M.M., Schäbitz, F., Stutz, S., 2001. Modern pollen-vegetation and isopoll maps<strong>in</strong> sou<strong>the</strong>rn Argent<strong>in</strong>a. Journal of Biogeography 28 (8), 997e1021.Partridge, T.C., 1997. Ca<strong>in</strong>ozoic environmental change <strong>in</strong> sou<strong>the</strong>rn Africa, withspecial emphasis on <strong>the</strong> last 200 000 years. Progress <strong>in</strong> Physical Geography 21(1), 3e22.Paruelo, J.M., Beltran, A., Jobbagy, E., Sala, O.E., Golluscio, R.A., 1998. The climate ofPatagonia: general patterns and controls on biotic processes. Ecología Austral 8(2), 85e101.Ponce, J.F., Borromei, A.M., Rabassa, J.O., Mart<strong>in</strong>ez, O., 2011. Late Quaternarypalaeoenvironmental change <strong>in</strong> western Staaten Island (54.5 S, 64 W), FuegianArchipelago. Quaternary International 233, 89e100.Power, M.J., Marlon, J., Ortiz, N., Bartle<strong>in</strong>, P.J., Harrison, S.P., Mayle, F.E., Ballouche, A.,Bradshaw, R.H.W., Carcaillet, C., Cordova, C., Mooney, S., Moreno, P.I.,Prentice, I.C., Thonicke, K., T<strong>in</strong>ner, W., Whitlock, C., Zhang, Y., Zhao, Y., Ali, A.A.,Anderson, R.S., Beer, R., Behl<strong>in</strong>g, H., Briles, C., Brown, K.J., Brunelle, A., Bush, M.,Camill, P., Chu, G.Q., Clark, J., Colombaroli, D., Connor, S., Daniau, A.L.,Daniels, M., Dodson, J., Doughty, E., Edwards, M.E., F<strong>in</strong>s<strong>in</strong>ger, W., Foster, D.,Frechette, J., Gaillard, M.J., Gav<strong>in</strong>, D.G., Gobet, E., Haberle, S., Hallett, D.J.,Higuera, P., Hope, G., Horn, S., Inoue, J., Kaltenrieder, P., Kennedy, L., Kong, Z.C.,Larsen, C., Long, C.J., Lynch, J., Lynch, E.A., McGlone, M., Meeks, S., Mens<strong>in</strong>g, S.,Meyer, G., M<strong>in</strong>ckley, T., Mohr, J., Nelson, D.M., New, J., Newnham, R., Noti, R.,Oswald, W., Pierce, J., Richard, P.J.H., Rowe, C., Goni, M.F.S., Shuman, B.N.,Takahara, H., Toney, J., Turney, C., Urrego-Sanchez, D.H., Umbanhowar, C.,Vandergoes, M., Vanniere, B., Vescovi, E., Walsh, M., Wang, X., Williams, N.,Wilmshurst, J., Zhang, J.H., 2008. Changes <strong>in</strong> fire regimes s<strong>in</strong>ce <strong>the</strong> Last GlacialMaximum: an assessment based on a global syn<strong>the</strong>sis and analysis of charcoaldata. Climate Dynamics 30 (7e8), 887e907.Power, S., Casey, T., Folland, C., Colman, A., Mehta, V., 1999. Inter-decadal modulationof <strong>the</strong> impact of ENSO on Australia. Climate Dynamics 15 (5), 319e324.Prebble, M., Shulmeister, J., 2002. An analysis of phytolith assemblages for <strong>the</strong>quantitative reconstruction of late Quaternary environments of <strong>the</strong> Lower TaieriPla<strong>in</strong>, Otago, South Island, New Zealand. II: paleoenvironmental reconstruction.Journal of Paleolimnology 27 (4), 415e427.Purdie, H., Mack<strong>in</strong>tosh, A., Lawson, W., Anderson, B., 2011. Synoptic <strong>in</strong>fluences onsnow accumulation on glaciers east and west of a topographic divide: Sou<strong>the</strong>rnAlps, New Zealand. Arctic, Antarctic, and Alp<strong>in</strong>e Research 43 (1), 82e94.Read, J., Busby, J.R., 1990. Comparative responses to temperature of <strong>the</strong> majorcanopy species of Tasmanian cool temperate ra<strong>in</strong>forest and <strong>the</strong>ir ecologicalsignificance. II. Net photosyn<strong>the</strong>sis and climate analysis. Australian Journal ofBotany 38 (2), 185e205.Rojas, M., Moreno, P.I., 2010. Atmospheric circulation changes and neoglacialconditions <strong>in</strong> <strong>the</strong> Sou<strong>the</strong>rn Hemisphere mid-latitudes: <strong>in</strong>sights from PMIP2simulations at 6 kyr. Climate Dynamics. doi:10.1007/s00382-010-0866-3.Rojas, M., Moreno, P.I., Kageyama, M., Crucifix, M., Hewitt, C., Abe-Ouchi, A.,Ohgaito, R., Brady, E.C., Hope, P., 2009. The Sou<strong>the</strong>rn <strong>Westerlies</strong> dur<strong>in</strong>g <strong>the</strong>Last Glacial Maximum <strong>in</strong> PMIP2 simulations. Climate Dynamics 32 (4),525e548.Schaefer, J.M., Denton, G.H., Kaplan, M., Putnam, A., F<strong>in</strong>kel, R.C., Barrell, D.J.A.,Andersen, B.G., Schwartz, R., Mack<strong>in</strong>tosh, A., Ch<strong>in</strong>n, T., Schluchter, C., 2009.High-frequency Holocene glacier fluctuations <strong>in</strong> New Zealand differ from <strong>the</strong>nor<strong>the</strong>rn signature. Science 324 (5927), 622e625.Schalke, H., 1973. The upper Quaternary of <strong>the</strong> Cape Flats area (Cape Prov<strong>in</strong>ce, SouthAfrica). Scripta Geologica 15, 1e57.Shulmeister, J., 1999. Australasian evidence for mid-Holocene climate changeimplies precessional control of Walker Circulation <strong>in</strong> <strong>the</strong> Pacific. QuaternaryInternational 57, 81e91.Shulmeister, J., F<strong>in</strong>k, D., Hyatt, O.M., Thackray, G.D., Ro<strong>the</strong>r, H., 2010. Cosmogenic Be-10 and Al-26 exposure ages of mora<strong>in</strong>es <strong>in</strong> <strong>the</strong> Rakaia Valley, New Zealand and<strong>the</strong> nature of <strong>the</strong> last term<strong>in</strong>ation <strong>in</strong> New Zealand glacial systems. Earth andPlanetary Science Letters 297 (3e4), 558e566.Shulmeister, J., Goodw<strong>in</strong>, I., Renwick, J., Harle, K., Armand, L., McGlone, M.S.,Cook, E.J., Dodson, J.R., Mayewski, P., Curran, M., 2004. The Sou<strong>the</strong>rn Hemispherewesterlies <strong>in</strong> <strong>the</strong> Australasian sector over <strong>the</strong> last glacial cycle:a syn<strong>the</strong>sis. Quaternary International 118e119, 23e53.Shulmeister, J., Lees, B.G., 1995. Pollen evidence from tropical Australia for <strong>the</strong> onsetof an ENSO-dom<strong>in</strong>ated climate at c. 4000 BP. The Holocene 5 (1), 10e18.Sijp, W.P., England, M.H., 2009. Sou<strong>the</strong>rn Hemisphere westerly w<strong>in</strong>d control over<strong>the</strong> ocean’s <strong>the</strong>rmohal<strong>in</strong>e circulation. Journal of Climate 22 (5), 1277e1286.Sijp, W.P., England, M.H., Meissner, K.J., 2010. On <strong>the</strong> control of glaciale<strong>in</strong>terglacialatmospheric CO 2 variations by <strong>the</strong> Sou<strong>the</strong>rn Hemisphere westerlies. GeophysicalResearch Letters 37 (21), L21703.S<strong>in</strong>gh, G., Geissler, E.A., 1985. Late Ca<strong>in</strong>ozoic history of vegetation, fire, lake levelsand climate, at Lake George, New South Wales, Australia. Philosophical Transactionsof <strong>the</strong> Royal Society of London. Series B: Biological Sciences 311 (1151),379e447.S<strong>in</strong>gh, G., Kershaw, P., Clark, R.L., 1981. Quaternary vegetation and fire history <strong>in</strong>Australia. In: Gill, A.M., Groves, R.H., Noble, I.R. (Eds.), Fire and <strong>the</strong> AustralianBiota. Australian Academy of Science, Canberra, pp. 23e54.Street-Perrott, F.A., Perrott, R.A., 1993. Holocene vegetation, lake levels and climateof Africa. In: Wright Jr., H.E., Kutzbach, J.E., Webb III, T., Ruddiman, W.F., Street-Perrot, F.A., Bartle<strong>in</strong>, P.J. (Eds.), Global Climates S<strong>in</strong>ce <strong>the</strong> Last Glacial Maximum.University of M<strong>in</strong>nesota Press, M<strong>in</strong>neapolis, MN, pp. 318e356.Stuiver, M., Reimer, P.J., Reimer, R., 2010. CALIB Radiocarbon Calibration Version6.0.1 Available Onl<strong>in</strong>e.Sturman, A.P., Tapper, N.J., 2006. The Wea<strong>the</strong>r and Climate of Australia and NewZealand. Oxford University Press, USA.Toggweiler, J.R., 2009. Climate change: shift<strong>in</strong>g westerlies. Science 323 (5920), 1434.Toggweiler, J.R., Russell, J.L., Carson, S.R., 2006. Midlatitude westerlies, atmosphericCO 2 , and climate change dur<strong>in</strong>g <strong>the</strong> ice ages. Paleoceanography 21, PA2005.Tschumi, T., Joos, F., Parekh, P., 2008. How important are Sou<strong>the</strong>rn Hemispherew<strong>in</strong>d changes for low glacial carbon dioxide? A model study. Paleoceanography23 (26), 4208.Tuhkanen, S., 1992. The climate of Tierra del Fuego from a vegetation geographicalpo<strong>in</strong>t of view and its ecoclimatic counterparts elsewhere. Acta Botanica Fennica145, 1e64.Tuhkanen, S., Kuokka, I., Hyvönen, J., Stenroos, S., Niemelä, J., 1992. Tierra del Fuegoas a target for biogeographical research <strong>in</strong> <strong>the</strong> past and present. Anales delInstituto de la Patagonia. Serie Ciencias Naturales 19, 1e107.Turney, C.M., Kershaw, P., Lowe, J.J., van Der Kaars, S., Johnson, R., Rule, S., Moss, P.,Radke, L., Tibby, J., McGlone, M.S., Wilmshurst, J.M., Vandergoes, M.J.,Fitzsimons, S.J., Bryant, C., James, S., Branch, N.P., Cowley, J., Kal<strong>in</strong>, R.M., Ogle, N.,Jacobsen, G., Fifield, L.K., 2006a. Climatic variability <strong>in</strong> <strong>the</strong> southwest Pacificdur<strong>in</strong>g <strong>the</strong> Last Term<strong>in</strong>ation (20e10 kyr BP). Quaternary Science Reviews 25,886e903.Turney, C.S.M., Haberle, S., F<strong>in</strong>k, D., Kershaw, A.P., Barbetti, M., Barrows, T.T.,Black, M., Cohen, T.J., Correge, T., Hesse, P.P., 2006b. Integration of ice-core,mar<strong>in</strong>e and terrestrial records for <strong>the</strong> Australian Last Glacial Maximum andTerm<strong>in</strong>ation: a contribution from <strong>the</strong> OZ INTIMATE group. Journal of QuaternaryScience 21 (7), 751e761.Tyson, P.D., Karlén, W., Holmgren, K., Heiss, G.A., 2000. The Little Ice Age andmedieval warm<strong>in</strong>g <strong>in</strong> South Africa. South African Journal of Science 96 (3),121e126.Tyson, P.D., Preston-Whyte, R.A., 2000. The Wea<strong>the</strong>r and Climate of Sou<strong>the</strong>rn Africa.Oxford Univ Press.Ummenhofer, C.C., England, M.H., 2007. Interannual extremes <strong>in</strong> New Zealandprecipitation l<strong>in</strong>ked to modes of Sou<strong>the</strong>rn Hemisphere climate variability.Journal of Climate 20 (21), 5418e5440.Veblen, T.T., Markgraf, V., 1988. Steppe expansion <strong>in</strong> Patagonia. Quaternary Research30, 331e338.Veit, H., 1996. Sou<strong>the</strong>rn <strong>Westerlies</strong> dur<strong>in</strong>g <strong>the</strong> Holocene deduced from geomorphologicaland pedological studies <strong>in</strong> <strong>the</strong> Norte Chico, Nor<strong>the</strong>rn Chile (27e33 S). Palaeogeography, Palaeoclimatology, Palaeoecology 123 (1e4), 107e119.Villa-Mart<strong>in</strong>ez, R., Moreno, P.I., 2007. Pollen evidence for variations <strong>in</strong> <strong>the</strong> sou<strong>the</strong>rnmarg<strong>in</strong> of <strong>the</strong> westerly w<strong>in</strong>ds <strong>in</strong> SW Patagonia over <strong>the</strong> last 12,600 years.Quaternary Research 68 (3), 400e409.Villagran, C., 1988. Late Quaternary vegetation of sou<strong>the</strong>rn Isla Grande de Chiloé,Chile. Quaternary Research 29 (3), 294e306.Wanner, H., Beer, J., Bütikofer, J., Crowley, T.J., Cubasch, U., Flückiger, J., Goosse, H.,Grosjean, M., Joos, F., Kaplan, J.O., 2008. mid- to late Holocene climate change:an overview. Quaternary Science Reviews 27 (19e20), 1791e1828.Wardle, P., 1991. Vegetation of New Zealand. Cambridge Univ Press.Weaver, A.J., Middleton, J.H., 1989. On <strong>the</strong> dynamics of <strong>the</strong> Leeuw<strong>in</strong> Current. Journalof Physical Oceanography 19 (5), 626e648.Weckstrom, J.A.N., Seppä, H., Korhola, A., 2010. Climatic <strong>in</strong>fluence on peatlandformation and lateral expansion <strong>in</strong> subarctic Fennoscandia. Boreas 39 (4),761e769.Whitlock, C., Moreno, P.I., Bartle<strong>in</strong>, P., 2007. Climatic controls of Holocene firepatterns <strong>in</strong> sou<strong>the</strong>rn South America. Quaternary Research 68 (1), 28e36.Wilmshurst, J.M., Anderson, A.J., Higham, T.F.G., Worthy, T.H., 2008. Dat<strong>in</strong>g <strong>the</strong> lateprehistoric dispersal of Polynesians to New Zealand us<strong>in</strong>g <strong>the</strong> commensalPacific rat. Proceed<strong>in</strong>gs of <strong>the</strong> National Academy of Sciences of United States ofAmerica 105 (22), 7676e7680.Wyrwoll, K.H., Dong, B., Valdes, P., 2000. On <strong>the</strong> position of sou<strong>the</strong>rn hemispherewesterlies at <strong>the</strong> Last Glacial Maximum: an outl<strong>in</strong>e of AGCM simulation resultsand evaluation of <strong>the</strong>ir implications. Quaternary Science Reviews 19 (9),881e898.