Have the Southern Westerlies changed in a zonally symmetric ...
Have the Southern Westerlies changed in a zonally symmetric ...
Have the Southern Westerlies changed in a zonally symmetric ...

Create successful ePaper yourself
Turn your PDF publications into a flip-book with our unique Google optimized e-Paper software.
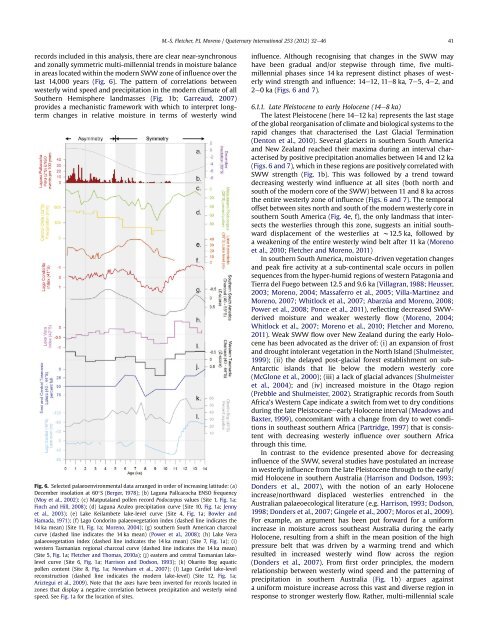
M.-S. Fletcher, P.I. Moreno / Quaternary International 253 (2012) 32e46 41records <strong>in</strong>cluded <strong>in</strong> this analysis, <strong>the</strong>re are clear near-synchronousand <strong>zonally</strong> <strong>symmetric</strong> multi-millennial trends <strong>in</strong> moisture balance<strong>in</strong> areas located with<strong>in</strong> <strong>the</strong> modern SWW zone of <strong>in</strong>fluence over <strong>the</strong>last 14,000 years (Fig. 6). The pattern of correlations betweenwesterly w<strong>in</strong>d speed and precipitation <strong>in</strong> <strong>the</strong> modern climate of allSou<strong>the</strong>rn Hemisphere landmasses (Fig. 1b; Garreaud, 2007)provides a mechanistic framework with which to <strong>in</strong>terpret longtermchanges <strong>in</strong> relative moisture <strong>in</strong> terms of westerly w<strong>in</strong>dFig. 6. Selected palaeoenvironmental data arranged <strong>in</strong> order of <strong>in</strong>creas<strong>in</strong>g latitude: (a)December <strong>in</strong>solation at 60 S(Berger, 1978); (b) Laguna Pallcacocha ENSO frequency(Moy et al., 2002); (c) Matputaland pollen record Podocarpus values (Site 1, Fig. 1a;F<strong>in</strong>ch and Hill, 2008); (d) Laguna Aculeo precipitation curve (Site 10, Fig. 1a; Jennyet al., 2003); (e) Lake Keilambete lake-level curve (Site 4, Fig. 1a; Bowler andHamada, 1971); (f) Lago Condorito palaeovegetation <strong>in</strong>dex (dashed l<strong>in</strong>e <strong>in</strong>dicates <strong>the</strong>14 ka mean) (Site 11, Fig. 1a; Moreno, 2004); (g) sou<strong>the</strong>rn South American charcoalcurve (dashed l<strong>in</strong>e <strong>in</strong>dicates <strong>the</strong> 14 ka mean) (Power et al., 2008); (h) Lake Verapalaeovegetation <strong>in</strong>dex (dashed l<strong>in</strong>e <strong>in</strong>dicates <strong>the</strong> 14 ka mean) (Site 7, Fig. 1a); (i)western Tasmanian regional charcoal curve (dashed l<strong>in</strong>e <strong>in</strong>dicates <strong>the</strong> 14 ka mean)(Site 5, Fig. 1a; Fletcher and Thomas, 2010a); (j) eastern and central Tasmanian lakelevelcurve (Site 6, Fig. 1a; Harrison and Dodson, 1993); (k) Okarito Bog aquaticpollen content (Site 8, Fig. 1a; Newnham et al., 2007); (l) Lago Cardiel lake-levelreconstruction (dashed l<strong>in</strong>e <strong>in</strong>dicates <strong>the</strong> modern lake-level) (Site 12, Fig. 1a;Ariztegui et al., 2009). Note that <strong>the</strong> axes have been <strong>in</strong>verted for records located <strong>in</strong>zones that display a negative correlation between precipitation and westerly w<strong>in</strong>dspeed. See Fig. 1a for <strong>the</strong> location of sites.<strong>in</strong>fluence. Although recognis<strong>in</strong>g that changes <strong>in</strong> <strong>the</strong> SWW mayhave been gradual and/or stepwise through time, five multimillennialphases s<strong>in</strong>ce 14 ka represent dist<strong>in</strong>ct phases of westerlyw<strong>in</strong>d strength and <strong>in</strong>fluence: 14e12, 11e8 ka, 7e5, 4e2, and2e0ka(Figs. 6 and 7).6.1.1. Late Pleistocene to early Holocene (14e8 ka)The latest Pleistocene (here 14e12 ka) represents <strong>the</strong> last stageof <strong>the</strong> global reorganisation of climate and biological systems to <strong>the</strong>rapid changes that characterised <strong>the</strong> Last Glacial Term<strong>in</strong>ation(Denton et al., 2010). Several glaciers <strong>in</strong> sou<strong>the</strong>rn South Americaand New Zealand reached <strong>the</strong>ir maxima dur<strong>in</strong>g an <strong>in</strong>terval characterisedby positive precipitation anomalies between 14 and 12 ka(Figs. 6 and 7), which <strong>in</strong> <strong>the</strong>se regions are positively correlated withSWW strength (Fig. 1b). This was followed by a trend towarddecreas<strong>in</strong>g westerly w<strong>in</strong>d <strong>in</strong>fluence at all sites (both north andsouth of <strong>the</strong> modern core of <strong>the</strong> SWW) between 11 and 8 ka across<strong>the</strong> entire westerly zone of <strong>in</strong>fluence (Figs. 6 and 7). The temporaloffset between sites north and south of <strong>the</strong> modern westerly core <strong>in</strong>sou<strong>the</strong>rn South America (Fig. 4e, f), <strong>the</strong> only landmass that <strong>in</strong>tersects<strong>the</strong> westerlies through this zone, suggests an <strong>in</strong>itial southwarddisplacement of <strong>the</strong> westerlies at w12.5 ka, followed bya weaken<strong>in</strong>g of <strong>the</strong> entire westerly w<strong>in</strong>d belt after 11 ka (Morenoet al., 2010; Fletcher and Moreno, 2011)In sou<strong>the</strong>rn South America, moisture-driven vegetation changesand peak fire activity at a sub-cont<strong>in</strong>ental scale occurs <strong>in</strong> pollensequences from <strong>the</strong> hyper-humid regions of western Patagonia andTierra del Fuego between 12.5 and 9.6 ka (Villagran, 1988; Heusser,2003; Moreno, 2004; Massaferro et al., 2005; Villa-Mart<strong>in</strong>ez andMoreno, 2007; Whitlock et al., 2007; Abarzúa and Moreno, 2008;Power et al., 2008; Ponce et al., 2011), reflect<strong>in</strong>g decreased SWWderivedmoisture and weaker westerly flow (Moreno, 2004;Whitlock et al., 2007; Moreno et al., 2010; Fletcher and Moreno,2011). Weak SWW flow over New Zealand dur<strong>in</strong>g <strong>the</strong> early Holocenehas been advocated as <strong>the</strong> driver of: (i) an expansion of frostand drought <strong>in</strong>tolerant vegetation <strong>in</strong> <strong>the</strong> North Island (Shulmeister,1999); (ii) <strong>the</strong> delayed post-glacial forest establishment on sub-Antarctic islands that lie below <strong>the</strong> modern westerly core(McGlone et al., 2000); (iii) a lack of glacial advances (Shulmeisteret al., 2004); and (iv) <strong>in</strong>creased moisture <strong>in</strong> <strong>the</strong> Otago region(Prebble and Shulmeister, 2002). Stratigraphic records from SouthAfrica’s Western Cape <strong>in</strong>dicate a switch from wet to dry conditionsdur<strong>in</strong>g <strong>the</strong> late Pleistoceneeearly Holocene <strong>in</strong>terval (Meadows andBaxter, 1999), concomitant with a change from dry to wet conditions<strong>in</strong> sou<strong>the</strong>ast sou<strong>the</strong>rn Africa (Partridge, 1997) that is consistentwith decreas<strong>in</strong>g westerly <strong>in</strong>fluence over sou<strong>the</strong>rn Africathrough this time.In contrast to <strong>the</strong> evidence presented above for decreas<strong>in</strong>g<strong>in</strong>fluence of <strong>the</strong> SWW, several studies have postulated an <strong>in</strong>crease<strong>in</strong> westerly <strong>in</strong>fluence from <strong>the</strong> late Pleistocene through to <strong>the</strong> early/mid Holocene <strong>in</strong> sou<strong>the</strong>rn Australia (Harrison and Dodson, 1993;Donders et al., 2007), with <strong>the</strong> notion of an early Holocene<strong>in</strong>crease/northward displaced westerlies entrenched <strong>in</strong> <strong>the</strong>Australian palaeoecological literature (e.g. Harrison, 1993; Dodson,1998; Donders et al., 2007; G<strong>in</strong>gele et al., 2007; Moros et al., 2009).For example, an argument has been put forward for a uniform<strong>in</strong>crease <strong>in</strong> moisture across sou<strong>the</strong>ast Australia dur<strong>in</strong>g <strong>the</strong> earlyHolocene, result<strong>in</strong>g from a shift <strong>in</strong> <strong>the</strong> mean position of <strong>the</strong> highpressure belt that was driven by a warm<strong>in</strong>g trend and whichresulted <strong>in</strong> <strong>in</strong>creased westerly w<strong>in</strong>d flow across <strong>the</strong> region(Donders et al., 2007). From first order pr<strong>in</strong>ciples, <strong>the</strong> modernrelationship between westerly w<strong>in</strong>d speed and <strong>the</strong> pattern<strong>in</strong>g ofprecipitation <strong>in</strong> sou<strong>the</strong>rn Australia (Fig. 1b) argues aga<strong>in</strong>sta uniform moisture <strong>in</strong>crease across this vast and diverse region <strong>in</strong>response to stronger westerly flow. Ra<strong>the</strong>r, multi-millennial scale