Have the Southern Westerlies changed in a zonally symmetric ...
Have the Southern Westerlies changed in a zonally symmetric ...
Have the Southern Westerlies changed in a zonally symmetric ...

You also want an ePaper? Increase the reach of your titles
YUMPU automatically turns print PDFs into web optimized ePapers that Google loves.
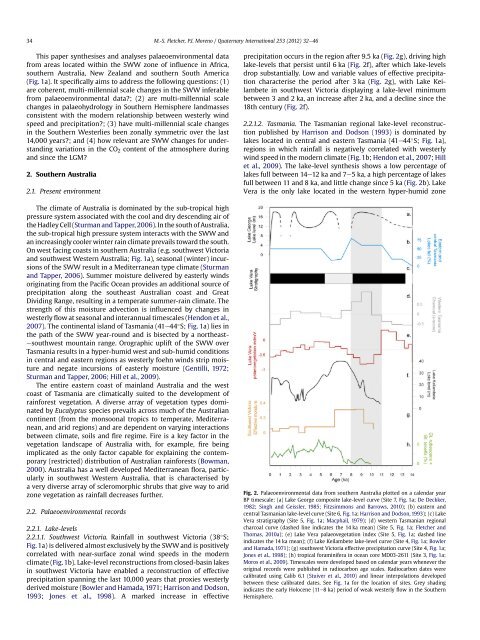
34M.-S. Fletcher, P.I. Moreno / Quaternary International 253 (2012) 32e46This paper syn<strong>the</strong>sises and analyses palaeoenvironmental datafrom areas located with<strong>in</strong> <strong>the</strong> SWW zone of <strong>in</strong>fluence <strong>in</strong> Africa,sou<strong>the</strong>rn Australia, New Zealand and sou<strong>the</strong>rn South America(Fig. 1a). It specifically aims to address <strong>the</strong> follow<strong>in</strong>g questions: (1)are coherent, multi-millennial scale changes <strong>in</strong> <strong>the</strong> SWW <strong>in</strong>ferablefrom palaeoenvironmental data?; (2) are multi-millennial scalechanges <strong>in</strong> palaeohydrology <strong>in</strong> Sou<strong>the</strong>rn Hemisphere landmassesconsistent with <strong>the</strong> modern relationship between westerly w<strong>in</strong>dspeed and precipitation?; (3) have multi-millennial scale changes<strong>in</strong> <strong>the</strong> Sou<strong>the</strong>rn <strong>Westerlies</strong> been <strong>zonally</strong> <strong>symmetric</strong> over <strong>the</strong> last14,000 years?; and (4) how relevant are SWW changes for understand<strong>in</strong>gvariations <strong>in</strong> <strong>the</strong> CO 2 content of <strong>the</strong> atmosphere dur<strong>in</strong>gand s<strong>in</strong>ce <strong>the</strong> LGM?2. Sou<strong>the</strong>rn Australia2.1. Present environmentThe climate of Australia is dom<strong>in</strong>ated by <strong>the</strong> sub-tropical highpressure system associated with <strong>the</strong> cool and dry descend<strong>in</strong>g air of<strong>the</strong> Hadley Cell (Sturman and Tapper, 2006). In <strong>the</strong> south of Australia,<strong>the</strong> sub-tropical high pressure system <strong>in</strong>teracts with <strong>the</strong> SWW andan <strong>in</strong>creas<strong>in</strong>gly cooler w<strong>in</strong>ter ra<strong>in</strong> climate prevails toward <strong>the</strong> south.On west fac<strong>in</strong>g coasts <strong>in</strong> sou<strong>the</strong>rn Australia (e.g. southwest Victoriaand southwest Western Australia; Fig. 1a), seasonal (w<strong>in</strong>ter) <strong>in</strong>cursionsof <strong>the</strong> SWW result <strong>in</strong> a Mediterranean type climate (Sturmanand Tapper, 2006). Summer moisture delivered by easterly w<strong>in</strong>dsorig<strong>in</strong>at<strong>in</strong>g from <strong>the</strong> Pacific Ocean provides an additional source ofprecipitation along <strong>the</strong> sou<strong>the</strong>ast Australian coast and GreatDivid<strong>in</strong>g Range, result<strong>in</strong>g <strong>in</strong> a temperate summer-ra<strong>in</strong> climate. Thestrength of this moisture advection is <strong>in</strong>fluenced by changes <strong>in</strong>westerly flow at seasonal and <strong>in</strong>terannual timescales (Hendon et al.,2007). The cont<strong>in</strong>ental island of Tasmania (41e44 S; Fig. 1a) lies <strong>in</strong><strong>the</strong> path of <strong>the</strong> SWW year-round and is bisected by a nor<strong>the</strong>astesouthwestmounta<strong>in</strong> range. Orographic uplift of <strong>the</strong> SWW overTasmania results <strong>in</strong> a hyper-humid west and sub-humid conditions<strong>in</strong> central and eastern regions as westerly foehn w<strong>in</strong>ds strip moistureand negate <strong>in</strong>cursions of easterly moisture (Gentilli, 1972;Sturman and Tapper, 2006; Hill et al., 2009).The entire eastern coast of ma<strong>in</strong>land Australia and <strong>the</strong> westcoast of Tasmania are climatically suited to <strong>the</strong> development ofra<strong>in</strong>forest vegetation. A diverse array of vegetation types dom<strong>in</strong>atedby Eucalyptus species prevails across much of <strong>the</strong> Australiancont<strong>in</strong>ent (from <strong>the</strong> monsoonal tropics to temperate, Mediterranean,and arid regions) and are dependent on vary<strong>in</strong>g <strong>in</strong>teractionsbetween climate, soils and fire regime. Fire is a key factor <strong>in</strong> <strong>the</strong>vegetation landscape of Australia with, for example, fire be<strong>in</strong>gimplicated as <strong>the</strong> only factor capable for expla<strong>in</strong><strong>in</strong>g <strong>the</strong> contemporary(restricted) distribution of Australian ra<strong>in</strong>forests (Bowman,2000). Australia has a well developed Mediterranean flora, particularly<strong>in</strong> southwest Western Australia, that is characterised bya very diverse array of scleromorphic shrubs that give way to aridzone vegetation as ra<strong>in</strong>fall decreases fur<strong>the</strong>r.2.2. Palaeoenvironmental records2.2.1. Lake-levels2.2.1.1. Southwest Victoria. Ra<strong>in</strong>fall <strong>in</strong> southwest Victoria (38 S;Fig. 1a) is delivered almost exclusively by <strong>the</strong> SWW and is positivelycorrelated with near-surface zonal w<strong>in</strong>d speeds <strong>in</strong> <strong>the</strong> modernclimate (Fig. 1b). Lake-level reconstructions from closed-bas<strong>in</strong> lakes<strong>in</strong> southwest Victoria have enabled a reconstruction of effectiveprecipitation spann<strong>in</strong>g <strong>the</strong> last 10,000 years that proxies westerlyderived moisture (Bowler and Hamada, 1971; Harrison and Dodson,1993; Jones et al., 1998). A marked <strong>in</strong>crease <strong>in</strong> effectiveprecipitation occurs <strong>in</strong> <strong>the</strong> region after 9.5 ka (Fig. 2g), driv<strong>in</strong>g highlake-levels that persist until 6 ka (Fig. 2f), after which lake-levelsdrop substantially. Low and variable values of effective precipitationcharacterise <strong>the</strong> period after 3 ka (Fig. 2g), with Lake Keilambete<strong>in</strong> southwest Victoria display<strong>in</strong>g a lake-level m<strong>in</strong>imumbetween 3 and 2 ka, an <strong>in</strong>crease after 2 ka, and a decl<strong>in</strong>e s<strong>in</strong>ce <strong>the</strong>18th century (Fig. 2f).2.2.1.2. Tasmania. The Tasmanian regional lake-level reconstructionpublished by Harrison and Dodson (1993) is dom<strong>in</strong>ated bylakes located <strong>in</strong> central and eastern Tasmania (41e44 S; Fig. 1a),regions <strong>in</strong> which ra<strong>in</strong>fall is negatively correlated with westerlyw<strong>in</strong>d speed <strong>in</strong> <strong>the</strong> modern climate (Fig. 1b; Hendon et al., 2007; Hillet al., 2009). The lake-level syn<strong>the</strong>sis shows a low percentage oflakes full between 14e12 ka and 7e5 ka, a high percentage of lakesfull between 11 and 8 ka, and little change s<strong>in</strong>ce 5 ka (Fig. 2b). LakeVera is <strong>the</strong> only lake located <strong>in</strong> <strong>the</strong> western hyper-humid zoneFig. 2. Palaeoenvironmental data from sou<strong>the</strong>rn Australia plotted on a calendar yearBP timescale: (a) Lake George composite lake-level curve (Site 7, Fig. 1a; De Deckker,1982; S<strong>in</strong>gh and Geissler, 1985; Fitzsimmons and Barrows, 2010); (b) eastern andcentral Tasmanian lake-level curve (Site 6, Fig. 1a; Harrison and Dodson, 1993); (c) LakeVera stratigraphy (Site 5, Fig. 1a; Macphail, 1979); (d) western Tasmanian regionalcharcoal curve (dashed l<strong>in</strong>e <strong>in</strong>dicates <strong>the</strong> 14 ka mean) (Site 5, Fig. 1a; Fletcher andThomas, 2010a); (e) Lake Vera palaeovegetation <strong>in</strong>dex (Site 5, Fig. 1a; dashed l<strong>in</strong>e<strong>in</strong>dicates <strong>the</strong> 14 ka mean); (f) Lake Keilambete lake-level curve (Site 4, Fig. 1a; Bowlerand Hamada, 1971); (g) southwest Victoria effective precipitation curve (Site 4, Fig. 1a;Jones et al., 1998); (h) tropical foram<strong>in</strong>ifera <strong>in</strong> ocean core MD03-2611 (Site 3, Fig. 1a;Moros et al., 2009). Timescales were developed based on calendar years whenever <strong>the</strong>orig<strong>in</strong>al records were published <strong>in</strong> radiocarbon age scales. Radiocarbon dates werecalibrated us<strong>in</strong>g Calib 6.1 (Stuiver et al., 2010) and l<strong>in</strong>ear <strong>in</strong>terpolations developedbetween <strong>the</strong>se calibrated dates. See Fig. 1a for <strong>the</strong> location of sites. Grey shad<strong>in</strong>g<strong>in</strong>dicates <strong>the</strong> early Holocene (11e8 ka) period of weak westerly flow <strong>in</strong> <strong>the</strong> Sou<strong>the</strong>rnHemisphere.