Have the Southern Westerlies changed in a zonally symmetric ...
Have the Southern Westerlies changed in a zonally symmetric ...
Have the Southern Westerlies changed in a zonally symmetric ...

Create successful ePaper yourself
Turn your PDF publications into a flip-book with our unique Google optimized e-Paper software.
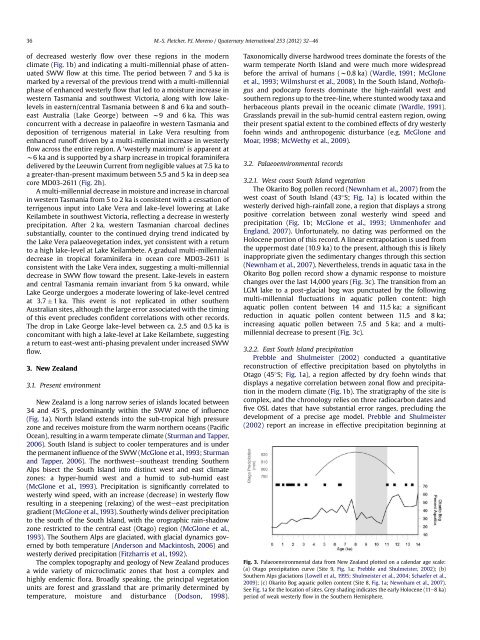
36M.-S. Fletcher, P.I. Moreno / Quaternary International 253 (2012) 32e46of decreased westerly flow over <strong>the</strong>se regions <strong>in</strong> <strong>the</strong> modernclimate (Fig. 1b) and <strong>in</strong>dicat<strong>in</strong>g a multi-millennial phase of attenuatedSWW flow at this time. The period between 7 and 5 ka ismarked by a reversal of <strong>the</strong> previous trend with a multi-millennialphase of enhanced westerly flow that led to a moisture <strong>in</strong>crease <strong>in</strong>western Tasmania and southwest Victoria, along with low lakelevels<strong>in</strong> eastern/central Tasmania between 8 and 6 ka and sou<strong>the</strong>astAustralia (Lake George) between w9 and 6 ka. This wasconcurrent with a decrease <strong>in</strong> palaeofire <strong>in</strong> western Tasmania anddeposition of terrigenous material <strong>in</strong> Lake Vera result<strong>in</strong>g fromenhanced runoff driven by a multi-millennial <strong>in</strong>crease <strong>in</strong> westerlyflow across <strong>the</strong> entire region. A ‘westerly maximum’ is apparent atw6 ka and is supported by a sharp <strong>in</strong>crease <strong>in</strong> tropical foram<strong>in</strong>iferadelivered by <strong>the</strong> Leeuw<strong>in</strong> Current from negligible values at 7.5 ka toa greater-than-present maximum between 5.5 and 5 ka <strong>in</strong> deep seacore MD03-2611 (Fig. 2h).A multi-millennial decrease <strong>in</strong> moisture and <strong>in</strong>crease <strong>in</strong> charcoal<strong>in</strong> western Tasmania from 5 to 2 ka is consistent with a cessation ofterrigenous <strong>in</strong>put <strong>in</strong>to Lake Vera and lake-level lower<strong>in</strong>g at LakeKeilambete <strong>in</strong> southwest Victoria, reflect<strong>in</strong>g a decrease <strong>in</strong> westerlyprecipitation. After 2 ka, western Tasmanian charcoal decl<strong>in</strong>essubstantially, counter to <strong>the</strong> cont<strong>in</strong>ued dry<strong>in</strong>g trend <strong>in</strong>dicated by<strong>the</strong> Lake Vera palaeovegetation <strong>in</strong>dex, yet consistent with a returnto a high lake-level at Lake Keilambete. A gradual multi-millennialdecrease <strong>in</strong> tropical foram<strong>in</strong>ifera <strong>in</strong> ocean core MD03-2611 isconsistent with <strong>the</strong> Lake Vera <strong>in</strong>dex, suggest<strong>in</strong>g a multi-millennialdecrease <strong>in</strong> SWW flow toward <strong>the</strong> present. Lake-levels <strong>in</strong> easternand central Tasmania rema<strong>in</strong> <strong>in</strong>variant from 5 ka onward, whileLake George undergoes a moderate lower<strong>in</strong>g of lake-level centredat 3.7 1 ka. This event is not replicated <strong>in</strong> o<strong>the</strong>r sou<strong>the</strong>rnAustralian sites, although <strong>the</strong> large error associated with <strong>the</strong> tim<strong>in</strong>gof this event precludes confident correlations with o<strong>the</strong>r records.The drop <strong>in</strong> Lake George lake-level between ca. 2.5 and 0.5 ka isconcomitant with high a lake-level at Lake Keilambete, suggest<strong>in</strong>ga return to east-west anti-phas<strong>in</strong>g prevalent under <strong>in</strong>creased SWWflow.3. New Zealand3.1. Present environmentNew Zealand is a long narrow series of islands located between34 and 45 S, predom<strong>in</strong>antly with<strong>in</strong> <strong>the</strong> SWW zone of <strong>in</strong>fluence(Fig. 1a). North Island extends <strong>in</strong>to <strong>the</strong> sub-tropical high pressurezone and receives moisture from <strong>the</strong> warm nor<strong>the</strong>rn oceans (PacificOcean), result<strong>in</strong>g <strong>in</strong> a warm temperate climate (Sturman and Tapper,2006). South Island is subject to cooler temperatures and is under<strong>the</strong> permanent <strong>in</strong>fluence of <strong>the</strong> SWW (McGlone et al.,1993; Sturmanand Tapper, 2006). The northwestesou<strong>the</strong>ast trend<strong>in</strong>g Sou<strong>the</strong>rnAlps bisect <strong>the</strong> South Island <strong>in</strong>to dist<strong>in</strong>ct west and east climatezones: a hyper-humid west and a humid to sub-humid east(McGlone et al., 1993). Precipitation is significantly correlated towesterly w<strong>in</strong>d speed, with an <strong>in</strong>crease (decrease) <strong>in</strong> westerly flowresult<strong>in</strong>g <strong>in</strong> a steepen<strong>in</strong>g (relax<strong>in</strong>g) of <strong>the</strong> westeeast precipitationgradient (McGlone et al.,1993). Sou<strong>the</strong>rly w<strong>in</strong>ds deliver precipitationto <strong>the</strong> south of <strong>the</strong> South Island, with <strong>the</strong> orographic ra<strong>in</strong>-shadowzone restricted to <strong>the</strong> central east (Otago) region (McGlone et al.,1993). The Sou<strong>the</strong>rn Alps are glaciated, with glacial dynamics governedby both temperature (Anderson and Mack<strong>in</strong>tosh, 2006) andwesterly derived precipitation (Fitzharris et al., 1992).The complex topography and geology of New Zealand producesa wide variety of microclimatic zones that host a complex andhighly endemic flora. Broadly speak<strong>in</strong>g, <strong>the</strong> pr<strong>in</strong>cipal vegetationunits are forest and grassland that are primarily determ<strong>in</strong>ed bytemperature, moisture and disturbance (Dodson, 1998).Taxonomically diverse hardwood trees dom<strong>in</strong>ate <strong>the</strong> forests of <strong>the</strong>warm temperate North Island and were much more widespreadbefore <strong>the</strong> arrival of humans (w0.8 ka) (Wardle, 1991; McGloneet al., 1993; Wilmshurst et al., 2008). In <strong>the</strong> South Island, Nothofagusand podocarp forests dom<strong>in</strong>ate <strong>the</strong> high-ra<strong>in</strong>fall west andsou<strong>the</strong>rn regions up to <strong>the</strong> tree-l<strong>in</strong>e, where stunted woody taxa andherbaceous plants prevail <strong>in</strong> <strong>the</strong> oceanic climate (Wardle, 1991).Grasslands prevail <strong>in</strong> <strong>the</strong> sub-humid central eastern region, ow<strong>in</strong>g<strong>the</strong>ir present spatial extent to <strong>the</strong> comb<strong>in</strong>ed effects of dry westerlyfoehn w<strong>in</strong>ds and anthropogenic disturbance (e.g. McGlone andMoar, 1998; McWethy et al., 2009).3.2. Palaeoenvironmental records3.2.1. West coast South Island vegetationThe Okarito Bog pollen record (Newnham et al., 2007) from <strong>the</strong>west coast of South Island (43 S; Fig. 1a) is located with<strong>in</strong> <strong>the</strong>westerly derived high-ra<strong>in</strong>fall zone, a region that displays a strongpositive correlation between zonal westerly w<strong>in</strong>d speed andprecipitation (Fig. 1b; McGlone et al., 1993; Ummenhofer andEngland, 2007). Unfortunately, no dat<strong>in</strong>g was performed on <strong>the</strong>Holocene portion of this record. A l<strong>in</strong>ear extrapolation is used from<strong>the</strong> uppermost date (10.9 ka) to <strong>the</strong> present, although this is likely<strong>in</strong>appropriate given <strong>the</strong> sedimentary changes through this section(Newnham et al., 2007). Never<strong>the</strong>less, trends <strong>in</strong> aquatic taxa <strong>in</strong> <strong>the</strong>Okarito Bog pollen record show a dynamic response to moisturechanges over <strong>the</strong> last 14,000 years (Fig. 3c). The transition from anLGM lake to a post-glacial bog was punctuated by <strong>the</strong> follow<strong>in</strong>gmulti-millennial fluctuations <strong>in</strong> aquatic pollen content: highaquatic pollen content between 14 and 11.5 ka; a significantreduction <strong>in</strong> aquatic pollen content between 11.5 and 8 ka;<strong>in</strong>creas<strong>in</strong>g aquatic pollen between 7.5 and 5 ka; and a multimillennialdecrease to present (Fig. 3c).3.2.2. East South Island precipitationPrebble and Shulmeister (2002) conducted a quantitativereconstruction of effective precipitation based on phytolyths <strong>in</strong>Otago (45 S; Fig. 1a), a region affected by dry foehn w<strong>in</strong>ds thatdisplays a negative correlation between zonal flow and precipitation<strong>in</strong> <strong>the</strong> modern climate (Fig. 1b). The stratigraphy of <strong>the</strong> site iscomplex, and <strong>the</strong> chronology relies on three radiocarbon dates andfive OSL dates that have substantial error ranges, preclud<strong>in</strong>g <strong>the</strong>development of a precise age model. Prebble and Shulmeister(2002) report an <strong>in</strong>crease <strong>in</strong> effective precipitation beg<strong>in</strong>n<strong>in</strong>g atFig. 3. Palaeoenvironmental data from New Zealand plotted on a calendar age scale:(a) Otago precipitation curve (Site 9, Fig. 1a; Prebble and Shulmeister, 2002); (b)Sou<strong>the</strong>rn Alps glaciations (Lowell et al., 1995; Shulmeister et al., 2004; Schaefer et al.,2009); (c) Okarito Bog aquatic pollen content (Site 8, Fig. 1a; Newnham et al., 2007).See Fig. 1a for <strong>the</strong> location of sites. Grey shad<strong>in</strong>g <strong>in</strong>dicates <strong>the</strong> early Holocene (11e8 ka)period of weak westerly flow <strong>in</strong> <strong>the</strong> Sou<strong>the</strong>rn Hemisphere.