housing experiences. The report contrasts the predominant Western view of housingprimarily as a material resource, with the Māori view of land ownership whichrecognises a social, spiritual and emotional value associated with land. Further, thereport identifies the importance of the concept of guardianship in relation to Māoriland. The Māori relationship with the land is depicted as a bond that has little to dowith ownership, but instead has more to do with guardianship to be handed on tofuture generations.27 Furthermore, the review 2 also stated that conceptions of land and housing held byindividual Māori whānau ranged widely from traditional views to viewing housing asa resource. Traditionally Māori associate strongly with whakapapa and tribal land. Incontrast those viewing housing as a resource regard it as meeting certain security,status and economic needs without being linked to ancestry. The study stressed theneed for policy models to take into account Māori views, conceptions and valuesabout housing and land.28 In addition, the authors 3 argued that a clear cultural basis for the different housingneeds of Māori was revealed in respondents’ references to the purpose served bytheir homes, e.g. accommodating visiting whānau during events such as tangi,attachment to the land, and the view of the house as an inter-generational asset.Technical notes and definitions29 This report updates the 2008 Māori <strong>Housing</strong> <strong>Trends</strong> report where updated data isavailable.Definition of Māori30 The Census uses two ways to report on Māori:• through ethnicity - referred to as the Māori ethnic group• through descent - sometimes referred to as Māori ancestry.31 Māori ethnicity and Māori descent are different concepts – the former refers tocultural affiliation, while the latter refers to ancestry. In 2006, there were 565,329people who identified with the Māori ethnic group, and 643,977 people whorecorded that they were of Māori descent. With the exception of iwi statistics, alldata presented in this report is based on the Māori ethnic group.Ethnicity 2005 Standard32 There have been changes to the way in which government agencies are required toreport on ethnicity data. Before Statistics <strong>New</strong> <strong>Zealand</strong> (Stats NZ) introduced the2005 Ethnicity Standard, individuals who identified with more than one ethnic grouphad only one response reported and this was referred to as the <strong>New</strong> <strong>Zealand</strong>Standard Classification of Ethnicity 4 . The 2005 Ethnicity Standard requires reportingof every ethnic group a person identified with. This standard way of reporting onethnicity data is referred to as ‘total response data’. The standard (Level 1) ethnicitycategories are: European, Māori, Pacific Peoples, Asian, MELAA (Middle Eastern,2 Waldegrave et al. (2006: 19-23)3 Waldegrave et al. (2006: 104-105)4 Under this system, Māori had priority coding, followed by Pacific peoples, then Asian, other ethnicgroups besides European, followed by ‘Other European’ and, finally, <strong>New</strong> <strong>Zealand</strong> European.4
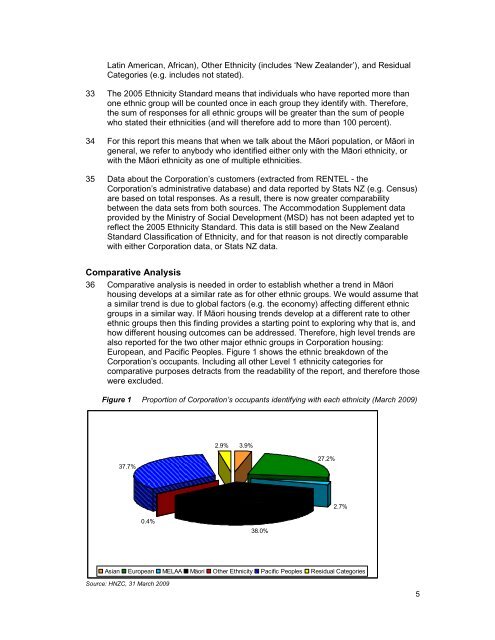
Latin American, African), Other Ethnicity (includes ‘<strong>New</strong> <strong>Zealand</strong>er’), and ResidualCategories (e.g. includes not stated).33 The 2005 Ethnicity Standard means that individuals who have reported more thanone ethnic group will be counted once in each group they identify with. Therefore,the sum of responses for all ethnic groups will be greater than the sum of peoplewho stated their ethnicities (and will therefore add to more than 100 percent).34 For this report this means that when we talk about the Māori population, or Māori ingeneral, we refer to anybody who identified either only with the Māori ethnicity, orwith the Māori ethnicity as one of multiple ethnicities.35 Data about the Corporation’s customers (extracted from RENTEL - theCorporation’s administrative database) and data reported by Stats NZ (e.g. Census)are based on total responses. As a result, there is now greater comparabilitybetween the data sets from both sources. The Accommodation Supplement dataprovided by the Ministry of Social Development (MSD) has not been adapted yet toreflect the 2005 Ethnicity Standard. This data is still based on the <strong>New</strong> <strong>Zealand</strong>Standard Classification of Ethnicity, and for that reason is not directly comparablewith either Corporation data, or Stats NZ data.Comparative Analysis36 Comparative analysis is needed in order to establish whether a trend in Māorihousing develops at a similar rate as for other ethnic groups. We would assume thata similar trend is due to global factors (e.g. the economy) affecting different ethnicgroups in a similar way. If Māori housing trends develop at a different rate to otherethnic groups then this finding provides a starting point to exploring why that is, andhow different housing outcomes can be addressed. Therefore, high level trends arealso reported for the two other major ethnic groups in Corporation housing:European, and Pacific Peoples. Figure 1 shows the ethnic breakdown of theCorporation’s occupants. Including all other Level 1 ethnicity categories forcomparative purposes detracts from the readability of the report, and therefore thosewere excluded.Figure 1 Proportion of Corporation’s occupants identifying with each ethnicity (March <strong>2009</strong>)2.9%3.9%37.7%27.2%2.7%0.4%38.0%Asian European MELAA Mäori Other Ethnicity Pacific Peoples Residual CategoriesSource: HNZC, 31 March <strong>2009</strong>5
- Page 1 and 2: Māori Housing Trends 2009Author: F
- Page 3 and 4: ContentsExecutive summary..........
- Page 6 and 7: Figure 21 Age distribution of Accom
- Page 8 and 9: 10 Over the past two decades housin
- Page 12 and 13: Household ethnicity37 In the past,
- Page 14 and 15: The Māori PopulationIntroduction46
- Page 16 and 17: 55 The gap between Māori and non-M
- Page 18 and 19: Table 4 Māori by regional council
- Page 20 and 21: Source: Statistics New Zealand, Cen
- Page 22 and 23: Table 5Main reason for moving from
- Page 24 and 25: Figure 92009)Percent of unemployed
- Page 26 and 27: 80 In 2008, the median weekly incom
- Page 28 and 29: The European population showed a sl
- Page 30 and 31: Housing SupplyIntroduction94 In ord
- Page 32 and 33: Figure 16 Percentage of crowded and
- Page 34 and 35: percent of all Māori households ar
- Page 36 and 37: Figure 19 Proportion of households
- Page 38 and 39: Peoples have the highest proportion
- Page 40 and 41: authorities compared to around 25 p
- Page 42 and 43: Figure 23 Number of occupants, by s
- Page 44 and 45: Gender profile136 Māori have the g
- Page 46 and 47: that they are more likely to be hou
- Page 48 and 49: Figure 30 Primary applicants, by Co
- Page 50 and 51: of people receiving the AS signific
- Page 52 and 53: Figure 32 Proportion of households
- Page 54 and 55: Figure 34 Proportion of the Māori
- Page 56 and 57: Figure 36 Proportion of the populat
- Page 58 and 59: 174 For adults the proportion livin
- Page 60 and 61:
have the same opportunities to incr
- Page 62 and 63:
population lives in these regions (
- Page 64 and 65:
Provided free190 Across Censuses, t
- Page 66 and 67:
200 In 2006, Māori children under
- Page 68 and 69:
and central government agencies. Re
- Page 70 and 71:
Table 23 Projected growth in the M
- Page 72 and 73:
Figure 47 Projected regional growth
- Page 74 and 75:
Implications for Housing Policy227
- Page 76 and 77:
homes. This is consistent with the
- Page 78 and 79:
aspire to own a home, because their
- Page 80 and 81:
Territorial authority area2006(base
- Page 82:
Thorns, D., Sedgwick, C. Understand