MÄori Housing Trends 2009 - Housing New Zealand
MÄori Housing Trends 2009 - Housing New Zealand
MÄori Housing Trends 2009 - Housing New Zealand

You also want an ePaper? Increase the reach of your titles
YUMPU automatically turns print PDFs into web optimized ePapers that Google loves.
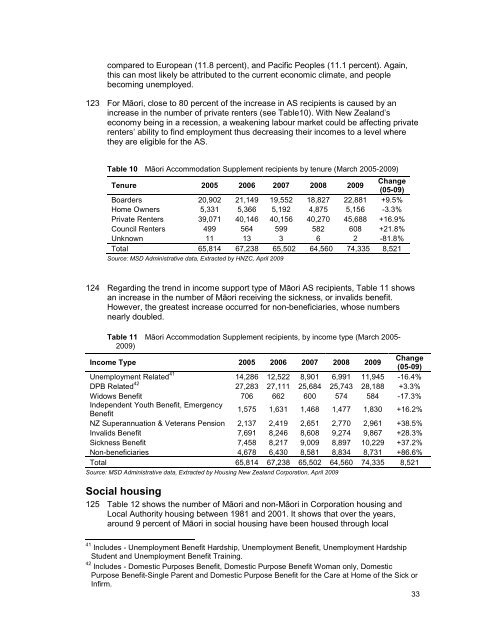
compared to European (11.8 percent), and Pacific Peoples (11.1 percent). Again,this can most likely be attributed to the current economic climate, and peoplebecoming unemployed.123 For Māori, close to 80 percent of the increase in AS recipients is caused by anincrease in the number of private renters (see Table10). With <strong>New</strong> <strong>Zealand</strong>’seconomy being in a recession, a weakening labour market could be affecting privaterenters’ ability to find employment thus decreasing their incomes to a level wherethey are eligible for the AS.Table 10 Māori Accommodation Supplement recipients by tenure (March 2005-<strong>2009</strong>)Tenure 2005 2006 2007 2008 <strong>2009</strong>Change(05-09)Boarders 20,902 21,149 19,552 18,827 22,881 +9.5%Home Owners 5,331 5,366 5,192 4,875 5,156 -3.3%Private Renters 39,071 40,146 40,156 40,270 45,688 +16.9%Council Renters 499 564 599 582 608 +21.8%Unknown 11 13 3 6 2 -81.8%Total 65,814 67,238 65,502 64,560 74,335 8,521Source: MSD Administrative data, Extracted by HNZC, April <strong>2009</strong>124 Regarding the trend in income support type of Māori AS recipients, Table 11 showsan increase in the number of Māori receiving the sickness, or invalids benefit.However, the greatest increase occurred for non-beneficiaries, whose numbersnearly doubled.Table 11 Māori Accommodation Supplement recipients, by income type (March 2005-<strong>2009</strong>)Income Type 2005 2006 2007 2008 <strong>2009</strong>Change(05-09)Unemployment Related 41 14,286 12,522 8,901 6,991 11,945 -16.4%DPB Related 42 27,283 27,111 25,684 25,743 28,188 +3.3%Widows Benefit 706 662 600 574 584 -17.3%Independent Youth Benefit, EmergencyBenefit1,575 1,631 1,468 1,477 1,830 +16.2%NZ Superannuation & Veterans Pension 2,137 2,419 2,651 2,770 2,961 +38.5%Invalids Benefit 7,691 8,246 8,608 9,274 9,867 +28.3%Sickness Benefit 7,458 8,217 9,009 8,897 10,229 +37.2%Non-beneficiaries 4,678 6,430 8,581 8,834 8,731 +86.6%Total 65,814 67,238 65,502 64,560 74,335 8,521Source: MSD Administrative data, Extracted by <strong>Housing</strong> <strong>New</strong> <strong>Zealand</strong> Corporation, April <strong>2009</strong>Social housing125 Table 12 shows the number of Māori and non-Māori in Corporation housing andLocal Authority housing between 1981 and 2001. It shows that over the years,around 9 percent of Māori in social housing have been housed through local41 Includes - Unemployment Benefit Hardship, Unemployment Benefit, Unemployment HardshipStudent and Unemployment Benefit Training.42 Includes - Domestic Purposes Benefit, Domestic Purpose Benefit Woman only, DomesticPurpose Benefit-Single Parent and Domestic Purpose Benefit for the Care at Home of the Sick orInfirm.33