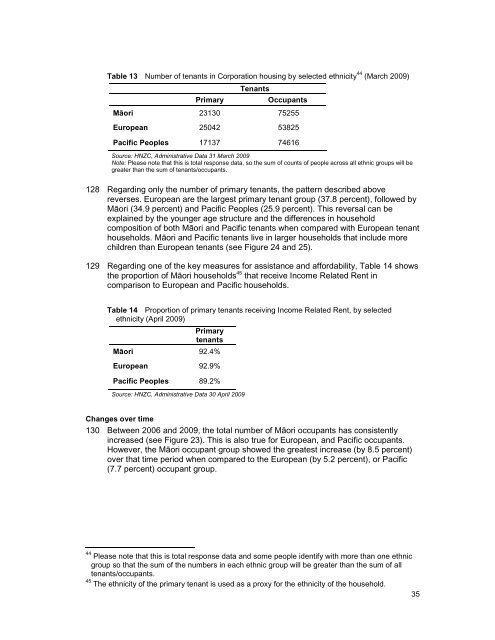
authorities compared to around 25 percent for non-Māori. This could reflect theyounger age structure of the Māori population with much of local authority housingdesigned for pensioners.MāoriTable 12 Number of Māori and non-Māori households in social housing 1981-2001 431981 1986 1991 1996 2001HNZC 12,522 14,520 18,324 16,632 15,216Local Authority 1,254 1,491 1,446 1,605 1,581Total Social <strong>Housing</strong> 13,776 16,011 19,770 18,237 16,797Māori in local authorityhousing as a percent of totalsocial housingNon-Māori9.1 9.3 7.3 8.8 9.4HNZC 44,457 41,478 45,156 35,889 36,534Local Authority 14,907 15,144 13,968 13,164 12,495Total Social <strong>Housing</strong> 59,364 56,622 59,124 49,053 49,029Māori in local authorityhousing as a percent of totalsocial housing 25.1 26.7 23.6 26.8 25.5Source: CHRANZ (2004) Changes in the Structure of the <strong>New</strong> <strong>Zealand</strong> <strong>Housing</strong> Market Vol 1, pp 339-340Corporation housingDefinitions126 When interpreting the data presented in this section, readers should note that tenantand applicant numbers are counted in two ways: as the primary tenant/applicant andas total occupants/applicants. The concept of a primary tenant/applicant of aCorporation tenancy/application is similar to Stats NZ’s reference person for ahousehold. The primary tenant is a signatory to the tenancy agreement, but therecan be more than one signatory in a household. The term totaloccupants/applicants, refers to the total number of household members.The Corporation’s tenants127 In <strong>2009</strong>, Māori represented the largest occupant group with a total of 75,255 Māorioccupants accounting for 38 percent of all people living in houses provided by theCorporation (see Table 13). Pacific Peoples were the second largest occupantgroup accounting for 37.7 percent, and were European the third largest occupantgroup, accounting for 27.2 percent of all Corporation occupants.43Readers should note that these figures are derived from the Census which consistently undercount people in social housing.34
Table 13 Number of tenants in Corporation housing by selected ethnicity 44 (March <strong>2009</strong>)PrimaryTenantsOccupantsMāori 23130 75255European 25042 53825Pacific Peoples 17137 74616Source: HNZC, Administrative Data 31 March <strong>2009</strong>Note: Please note that this is total response data, so the sum of counts of people across all ethnic groups will begreater than the sum of tenants/occupants.128 Regarding only the number of primary tenants, the pattern described abovereverses. European are the largest primary tenant group (37.8 percent), followed byMāori (34.9 percent) and Pacific Peoples (25.9 percent). This reversal can beexplained by the younger age structure and the differences in householdcomposition of both Māori and Pacific tenants when compared with European tenanthouseholds. Māori and Pacific tenants live in larger households that include morechildren than European tenants (see Figure 24 and 25).129 Regarding one of the key measures for assistance and affordability, Table 14 showsthe proportion of Māori households 45 that receive Income Related Rent incomparison to European and Pacific households.Table 14 Proportion of primary tenants receiving Income Related Rent, by selectedethnicity (April <strong>2009</strong>)PrimarytenantsMāori 92.4%European 92.9%Pacific Peoples 89.2%Source: HNZC, Administrative Data 30 April <strong>2009</strong>Changes over time130 Between 2006 and <strong>2009</strong>, the total number of Māori occupants has consistentlyincreased (see Figure 23). This is also true for European, and Pacific occupants.However, the Māori occupant group showed the greatest increase (by 8.5 percent)over that time period when compared to the European (by 5.2 percent), or Pacific(7.7 percent) occupant group.44 Please note that this is total response data and some people identify with more than one ethnicgroup so that the sum of the numbers in each ethnic group will be greater than the sum of alltenants/occupants.45 The ethnicity of the primary tenant is used as a proxy for the ethnicity of the household.35
- Page 1 and 2: Māori Housing Trends 2009Author: F
- Page 3 and 4: ContentsExecutive summary..........
- Page 6 and 7: Figure 21 Age distribution of Accom
- Page 8 and 9: 10 Over the past two decades housin
- Page 10 and 11: housing experiences. The report con
- Page 12 and 13: Household ethnicity37 In the past,
- Page 14 and 15: The Māori PopulationIntroduction46
- Page 16 and 17: 55 The gap between Māori and non-M
- Page 18 and 19: Table 4 Māori by regional council
- Page 20 and 21: Source: Statistics New Zealand, Cen
- Page 22 and 23: Table 5Main reason for moving from
- Page 24 and 25: Figure 92009)Percent of unemployed
- Page 26 and 27: 80 In 2008, the median weekly incom
- Page 28 and 29: The European population showed a sl
- Page 30 and 31: Housing SupplyIntroduction94 In ord
- Page 32 and 33: Figure 16 Percentage of crowded and
- Page 34 and 35: percent of all Māori households ar
- Page 36 and 37: Figure 19 Proportion of households
- Page 38 and 39: Peoples have the highest proportion
- Page 42 and 43: Figure 23 Number of occupants, by s
- Page 44 and 45: Gender profile136 Māori have the g
- Page 46 and 47: that they are more likely to be hou
- Page 48 and 49: Figure 30 Primary applicants, by Co
- Page 50 and 51: of people receiving the AS signific
- Page 52 and 53: Figure 32 Proportion of households
- Page 54 and 55: Figure 34 Proportion of the Māori
- Page 56 and 57: Figure 36 Proportion of the populat
- Page 58 and 59: 174 For adults the proportion livin
- Page 60 and 61: have the same opportunities to incr
- Page 62 and 63: population lives in these regions (
- Page 64 and 65: Provided free190 Across Censuses, t
- Page 66 and 67: 200 In 2006, Māori children under
- Page 68 and 69: and central government agencies. Re
- Page 70 and 71: Table 23 Projected growth in the M
- Page 72 and 73: Figure 47 Projected regional growth
- Page 74 and 75: Implications for Housing Policy227
- Page 76 and 77: homes. This is consistent with the
- Page 78 and 79: aspire to own a home, because their
- Page 80 and 81: Territorial authority area2006(base
- Page 82: Thorns, D., Sedgwick, C. Understand