The Māori PopulationIntroduction46 This section presents an overview of the socio-demographic profile of the Māoripopulation, providing a context for the consideration of trends in Māori housing. Itbegins by reviewing growth in the Māori population, including patterns of Māorifertility and life expectancy, and the changing age structure of the Māori population.It then outlines the household composition, and geographic distribution of the Māoripopulation. The next section provides an overview of patterns of Māori mobility,including a profile of Māori who recently moved and Māori who did not, followed byan analysis of Māori motivations for migration. The final section in this chapterprovides an overview of recent changes in Māori socio-economic outcomes, with aparticular focus on recent changes in the education, employment, and income statusof the Māori population. This section also introduces two new 8 indicators, theproportion of the Māori population that lives in Corporation housing, and the Māorioccupancy rate.Population growth47 Over the past four Censuses, the Māori population living in <strong>New</strong> <strong>Zealand</strong> hasincreased by 30 percent, from 434,847 in 1991 to 565,329 in 2006 (see Table 1).Despite immigration of other ethnic groups and emigration of Māori, Māori continueto make up a growing proportion of the <strong>New</strong> <strong>Zealand</strong> population, accounting for 14.6percent of the total population in 2006 (accounted for just under 13 percent in 1991)In comparison, the European population accounted for 67.6 percent, and the Pacificpopulation for 6.8 percent of the total <strong>New</strong> <strong>Zealand</strong> population in 2006.Table 1 Growth in the Māori ethnic group and descent populations 1991-2006Census year Māori ethnic group 1 Māori descent 21991 434,847 511,2781996 523,371 579,7142001 526,281 604,1102006 565,329 643,977Source: Statistics <strong>New</strong> <strong>Zealand</strong>, Quick Stats about Māori (March 2007 revised)1 Includes people who stated Māori as their sole ethnic group or one of several ethnic groups.2 Includes those people that identify they are of Māori ancestry48 Regarding the diversity of the Māori population in 2006, just under half (47.2percent) identified with more than one ethnicity. Of those, just under 90 percentidentified with European ethnic groups, and just under 15 percent identified withPacific ethnic groups as one of their ethnic groups.49 In line with the growth in the Māori population, the number of people who claimMāori ancestry in 2006 has increased by around 26 percent since 1991. In 2006,643,977 people identified as having Māori ancestry accounting for nearly 18 percentof the total <strong>New</strong> <strong>Zealand</strong> population.50 Table 2 shows the 10 largest iwi with which Māori affiliate. With the exception ofWaikato, the number of people identifying with each of the 10 largest iwi has grownin the five years between the 2001 and 2006 Census.8 Have not been in previous Maori <strong>Housing</strong> <strong>Trends</strong> reports.8
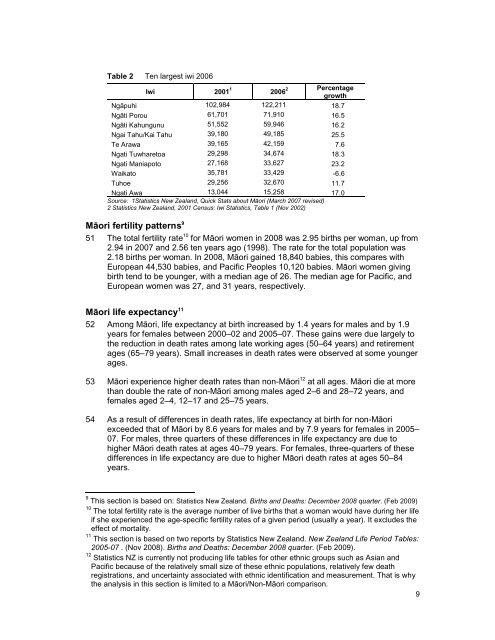
Table 2 Ten largest iwi 2006Iwi 2001 1 2006 2 PercentagegrowthNgāpuhi 102,984 122,211 18.7Ngāti Porou 61,701 71,910 16.5Ngāti Kahungunu 51,552 59,946 16.2Ngai Tahu/Kai Tahu 39,180 49,185 25.5Te Arawa 39,165 42,159 7.6Ngati Tuwharetoa 29,298 34,674 18.3Ngati Maniapoto 27,168 33,627 23.2Waikato 35,781 33,429 -6.6Tuhoe 29,256 32,670 11.7Ngati Awa 13,044 15,258 17.0Source: 1Statistics <strong>New</strong> <strong>Zealand</strong>, Quick Stats about Māori (March 2007 revised)2 Statistics <strong>New</strong> <strong>Zealand</strong>, 2001 Census: Iwi Statistics, Table 1 (Nov 2002)Māori fertility patterns 951 The total fertility rate 10 for Māori women in 2008 was 2.95 births per woman, up from2.94 in 2007 and 2.56 ten years ago (1998). The rate for the total population was2.18 births per woman. In 2008, Māori gained 18,840 babies, this compares withEuropean 44,530 babies, and Pacific Peoples 10,120 babies. Māori women givingbirth tend to be younger, with a median age of 26. The median age for Pacific, andEuropean women was 27, and 31 years, respectively.Māori life expectancy 1152 Among Māori, life expectancy at birth increased by 1.4 years for males and by 1.9years for females between 2000–02 and 2005–07. These gains were due largely tothe reduction in death rates among late working ages (50–64 years) and retirementages (65–79 years). Small increases in death rates were observed at some youngerages.53 Māori experience higher death rates than non-Māori 12 at all ages. Māori die at morethan double the rate of non-Māori among males aged 2–6 and 28–72 years, andfemales aged 2–4, 12–17 and 25–75 years.54 As a result of differences in death rates, life expectancy at birth for non-Māoriexceeded that of Māori by 8.6 years for males and by 7.9 years for females in 2005–07. For males, three quarters of these differences in life expectancy are due tohigher Māori death rates at ages 40–79 years. For females, three-quarters of thesedifferences in life expectancy are due to higher Māori death rates at ages 50–84years.9 This section is based on: Statistics <strong>New</strong> <strong>Zealand</strong>. Births and Deaths: December 2008 quarter. (Feb <strong>2009</strong>)10 The total fertility rate is the average number of live births that a woman would have during her lifeif she experienced the age-specific fertility rates of a given period (usually a year). It excludes theeffect of mortality.11 This section is based on two reports by Statistics <strong>New</strong> <strong>Zealand</strong>. <strong>New</strong> <strong>Zealand</strong> Life Period Tables:2005-07 . (Nov 2008). Births and Deaths: December 2008 quarter. (Feb <strong>2009</strong>).12 Statistics NZ is currently not producing life tables for other ethnic groups such as Asian andPacific because of the relatively small size of these ethnic populations, relatively few deathregistrations, and uncertainty associated with ethnic identification and measurement. That is whythe analysis in this section is limited to a Māori/Non-Māori comparison.9
- Page 1 and 2: Māori Housing Trends 2009Author: F
- Page 3 and 4: ContentsExecutive summary..........
- Page 6 and 7: Figure 21 Age distribution of Accom
- Page 8 and 9: 10 Over the past two decades housin
- Page 10 and 11: housing experiences. The report con
- Page 12 and 13: Household ethnicity37 In the past,
- Page 16 and 17: 55 The gap between Māori and non-M
- Page 18 and 19: Table 4 Māori by regional council
- Page 20 and 21: Source: Statistics New Zealand, Cen
- Page 22 and 23: Table 5Main reason for moving from
- Page 24 and 25: Figure 92009)Percent of unemployed
- Page 26 and 27: 80 In 2008, the median weekly incom
- Page 28 and 29: The European population showed a sl
- Page 30 and 31: Housing SupplyIntroduction94 In ord
- Page 32 and 33: Figure 16 Percentage of crowded and
- Page 34 and 35: percent of all Māori households ar
- Page 36 and 37: Figure 19 Proportion of households
- Page 38 and 39: Peoples have the highest proportion
- Page 40 and 41: authorities compared to around 25 p
- Page 42 and 43: Figure 23 Number of occupants, by s
- Page 44 and 45: Gender profile136 Māori have the g
- Page 46 and 47: that they are more likely to be hou
- Page 48 and 49: Figure 30 Primary applicants, by Co
- Page 50 and 51: of people receiving the AS signific
- Page 52 and 53: Figure 32 Proportion of households
- Page 54 and 55: Figure 34 Proportion of the Māori
- Page 56 and 57: Figure 36 Proportion of the populat
- Page 58 and 59: 174 For adults the proportion livin
- Page 60 and 61: have the same opportunities to incr
- Page 62 and 63: population lives in these regions (
- Page 64 and 65:
Provided free190 Across Censuses, t
- Page 66 and 67:
200 In 2006, Māori children under
- Page 68 and 69:
and central government agencies. Re
- Page 70 and 71:
Table 23 Projected growth in the M
- Page 72 and 73:
Figure 47 Projected regional growth
- Page 74 and 75:
Implications for Housing Policy227
- Page 76 and 77:
homes. This is consistent with the
- Page 78 and 79:
aspire to own a home, because their
- Page 80 and 81:
Territorial authority area2006(base
- Page 82:
Thorns, D., Sedgwick, C. Understand