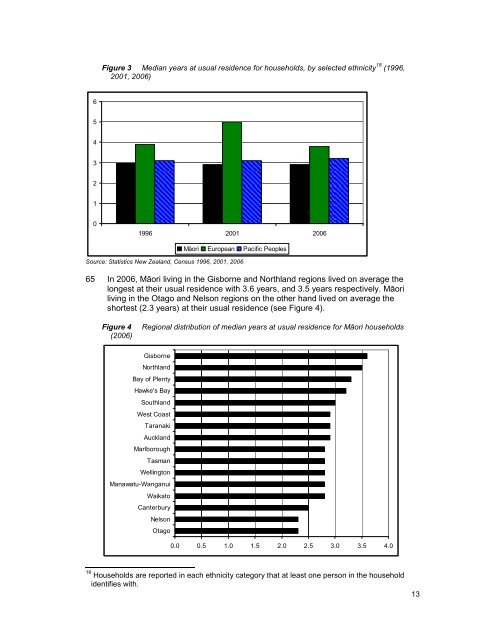
Table 4 Māori by regional council area 2001 and 2006Regional councilPercent of the MāoriNumber of Māoripopulation2001 2006 2001 2006Percent change2001-2006Northland 40,734 43,527 7.7 7.7 6.9Auckland 127,626 137,136 24.3 24.3 7.5Waikato 72,822 76,572 13.8 13.5 5.1Bay of Plenty 63,654 67,662 12.1 12.0 6.3Gisborne 19,362 17,758 3.7 3.5 2.0Hawke's Bay 32,088 33,555 6.1 5.9 4.6Taranaki 14,562 15,801 2.8 2.8 8.5Manawatu-Wanganui 39,267 42,288 7.5 7.5 7.7Wellington 51,120 55,434 9.7 9.8 8.4North Island 461,235 491,733 87.6 87.0 6.6Tasman 2,778 3,063 0.5 0.5 10.3Nelson 3,219 3,615 0.6 0.6 12.3Marlborough 3,894 4,275 0.7 0.8 9.8West Coast 2,547 2,916 0.5 0.5 14.5Canterbury 31,632 36,669 6.0 6.5 15.9Otago 10,542 12,270 2.0 2.2 16.4Southland 10,038 10,422 1.9 1.8 3.8South Island 64,650 73,230 12.3 13.0 13.3Area Outside Region 393 366 0.1 0.1 -6.9<strong>New</strong> <strong>Zealand</strong> 526,281 565,329 100.0 100.0 7.4Source: Statistics <strong>New</strong> <strong>Zealand</strong>, Quick Stats about Māori (March 2007 revised)Māori mobility62 The Māori population is characterised by relatively high rates of mobility. In 2006,people identifying as Māori were most likely to have lived somewhere else in <strong>New</strong><strong>Zealand</strong> five years earlier 16 .63 In 2006 on average (using the median 17 ), Māori had lived at their usual residence for2.9 years. When compared with the same measure in 1996 (3.0 years), Māori havebecome slightly more mobile since then.64 Through 1996 to 2006, Māori have consistently lived the shortest average time attheir current residence when compared with European (3.9 years in 1996, 5 years in2001, and 3.8 years in 2006), or Pacific (3.1 years in 1996, 3.1 in 2001, 3.2 in 2006).Figure 3 shows this.16 Statistics <strong>New</strong> <strong>Zealand</strong>. Quick Stats about Population Mobility – 2006 Census, (Feb 2007: 3).17 The median means that half of the population lived longer, and half shorter at their usualresidence than this number.12
Figure 3 Median years at usual residence for households, by selected ethnicity 18 (1996,2001, 2006)65432101996 2001 2006Mäori European Pacific PeoplesSource: Statistics <strong>New</strong> <strong>Zealand</strong>, Census 1996, 2001, 200665 In 2006, Māori living in the Gisborne and Northland regions lived on average thelongest at their usual residence with 3.6 years, and 3.5 years respectively. Māoriliving in the Otago and Nelson regions on the other hand lived on average theshortest (2.3 years) at their usual residence (see Figure 4).Figure 4(2006)Regional distribution of median years at usual residence for Māori householdsGisborneNorthlandBay of PlentyHawke's BaySouthlandWest CoastTaranakiAucklandMarlboroughTasmanWellingtonManawatu-WanganuiWaikatoCanterburyNelsonOtago0.0 0.5 1.0 1.5 2.0 2.5 3.0 3.5 4.018 Households are reported in each ethnicity category that at least one person in the householdidentifies with.13
- Page 1 and 2: Māori Housing Trends 2009Author: F
- Page 3 and 4: ContentsExecutive summary..........
- Page 6 and 7: Figure 21 Age distribution of Accom
- Page 8 and 9: 10 Over the past two decades housin
- Page 10 and 11: housing experiences. The report con
- Page 12 and 13: Household ethnicity37 In the past,
- Page 14 and 15: The Māori PopulationIntroduction46
- Page 16 and 17: 55 The gap between Māori and non-M
- Page 20 and 21: Source: Statistics New Zealand, Cen
- Page 22 and 23: Table 5Main reason for moving from
- Page 24 and 25: Figure 92009)Percent of unemployed
- Page 26 and 27: 80 In 2008, the median weekly incom
- Page 28 and 29: The European population showed a sl
- Page 30 and 31: Housing SupplyIntroduction94 In ord
- Page 32 and 33: Figure 16 Percentage of crowded and
- Page 34 and 35: percent of all Māori households ar
- Page 36 and 37: Figure 19 Proportion of households
- Page 38 and 39: Peoples have the highest proportion
- Page 40 and 41: authorities compared to around 25 p
- Page 42 and 43: Figure 23 Number of occupants, by s
- Page 44 and 45: Gender profile136 Māori have the g
- Page 46 and 47: that they are more likely to be hou
- Page 48 and 49: Figure 30 Primary applicants, by Co
- Page 50 and 51: of people receiving the AS signific
- Page 52 and 53: Figure 32 Proportion of households
- Page 54 and 55: Figure 34 Proportion of the Māori
- Page 56 and 57: Figure 36 Proportion of the populat
- Page 58 and 59: 174 For adults the proportion livin
- Page 60 and 61: have the same opportunities to incr
- Page 62 and 63: population lives in these regions (
- Page 64 and 65: Provided free190 Across Censuses, t
- Page 66 and 67: 200 In 2006, Māori children under
- Page 68 and 69:
and central government agencies. Re
- Page 70 and 71:
Table 23 Projected growth in the M
- Page 72 and 73:
Figure 47 Projected regional growth
- Page 74 and 75:
Implications for Housing Policy227
- Page 76 and 77:
homes. This is consistent with the
- Page 78 and 79:
aspire to own a home, because their
- Page 80 and 81:
Territorial authority area2006(base
- Page 82:
Thorns, D., Sedgwick, C. Understand