Chapter 4: Affected Environment - Aitkin County Government
Chapter 4: Affected Environment - Aitkin County Government
Chapter 4: Affected Environment - Aitkin County Government
- No tags were found...

Create successful ePaper yourself
Turn your PDF publications into a flip-book with our unique Google optimized e-Paper software.
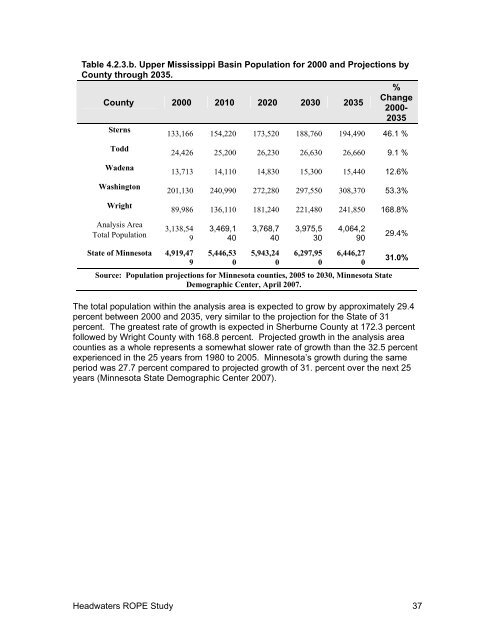
Table 4.2.3.b. Upper Mississippi Basin Population for 2000 and Projections by<strong>County</strong> through 2035.%<strong>County</strong> 2000 2010 2020 2030 2035Change2000-2035Sterns133,166 154,220 173,520 188,760 194,490 46.1 %ToddWadenaWashingtonWright24,426 25,200 26,230 26,630 26,660 9.1 %13,713 14,110 14,830 15,300 15,440 12.6%201,130 240,990 272,280 297,550 308,370 53.3%89,986 136,110 181,240 221,480 241,850 168.8%Analysis AreaTotal Population3,138,5493,469,1403,768,7403,975,5304,064,29029.4%State of Minnesota 4,919,4795,446,5305,943,2406,297,9506,446,270Source: Population projections for Minnesota counties, 2005 to 2030, Minnesota StateDemographic Center, April 2007.31.0%The total population within the analysis area is expected to grow by approximately 29.4percent between 2000 and 2035, very similar to the projection for the State of 31percent. The greatest rate of growth is expected in Sherburne <strong>County</strong> at 172.3 percentfollowed by Wright <strong>County</strong> with 168.8 percent. Projected growth in the analysis areacounties as a whole represents a somewhat slower rate of growth than the 32.5 percentexperienced in the 25 years from 1980 to 2005. Minnesota’s growth during the sameperiod was 27.7 percent compared to projected growth of 31. percent over the next 25years (Minnesota State Demographic Center 2007).Headwaters ROPE Study 37