Chapter 4: Affected Environment - Aitkin County Government
Chapter 4: Affected Environment - Aitkin County Government
Chapter 4: Affected Environment - Aitkin County Government
- No tags were found...

You also want an ePaper? Increase the reach of your titles
YUMPU automatically turns print PDFs into web optimized ePapers that Google loves.
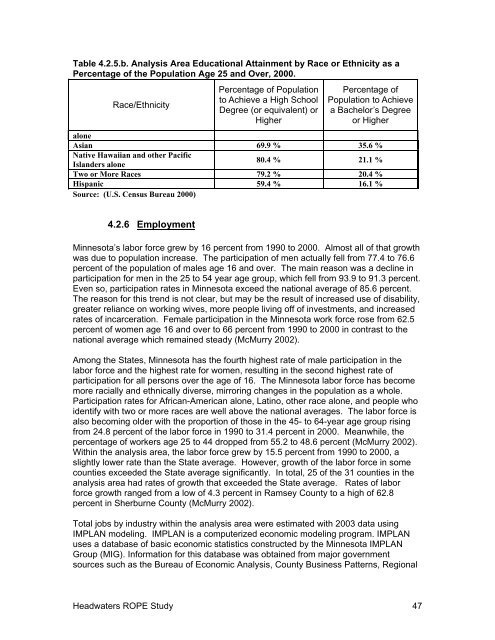
Table 4.2.5.b. Analysis Area Educational Attainment by Race or Ethnicity as aPercentage of the Population Age 25 and Over, 2000.Race/EthnicityPercentage of Populationto Achieve a High SchoolDegree (or equivalent) orHigherPercentage ofPopulation to Achievea Bachelor’s Degreeor HigheraloneAsian 69.9 % 35.6 %Native Hawaiian and other PacificIslanders alone80.4 % 21.1 %Two or More Races 79.2 % 20.4 %Hispanic 59.4 % 16.1 %Source: (U.S. Census Bureau 2000)4.2.6 EmploymentMinnesota’s labor force grew by 16 percent from 1990 to 2000. Almost all of that growthwas due to population increase. The participation of men actually fell from 77.4 to 76.6percent of the population of males age 16 and over. The main reason was a decline inparticipation for men in the 25 to 54 year age group, which fell from 93.9 to 91.3 percent.Even so, participation rates in Minnesota exceed the national average of 85.6 percent.The reason for this trend is not clear, but may be the result of increased use of disability,greater reliance on working wives, more people living off of investments, and increasedrates of incarceration. Female participation in the Minnesota work force rose from 62.5percent of women age 16 and over to 66 percent from 1990 to 2000 in contrast to thenational average which remained steady (McMurry 2002).Among the States, Minnesota has the fourth highest rate of male participation in thelabor force and the highest rate for women, resulting in the second highest rate ofparticipation for all persons over the age of 16. The Minnesota labor force has becomemore racially and ethnically diverse, mirroring changes in the population as a whole.Participation rates for African-American alone, Latino, other race alone, and people whoidentify with two or more races are well above the national averages. The labor force isalso becoming older with the proportion of those in the 45- to 64-year age group risingfrom 24.8 percent of the labor force in 1990 to 31.4 percent in 2000. Meanwhile, thepercentage of workers age 25 to 44 dropped from 55.2 to 48.6 percent (McMurry 2002).Within the analysis area, the labor force grew by 15.5 percent from 1990 to 2000, aslightly lower rate than the State average. However, growth of the labor force in somecounties exceeded the State average significantly. In total, 25 of the 31 counties in theanalysis area had rates of growth that exceeded the State average. Rates of laborforce growth ranged from a low of 4.3 percent in Ramsey <strong>County</strong> to a high of 62.8percent in Sherburne <strong>County</strong> (McMurry 2002).Total jobs by industry within the analysis area were estimated with 2003 data usingIMPLAN modeling. IMPLAN is a computerized economic modeling program. IMPLANuses a database of basic economic statistics constructed by the Minnesota IMPLANGroup (MIG). Information for this database was obtained from major governmentsources such as the Bureau of Economic Analysis, <strong>County</strong> Business Patterns, RegionalHeadwaters ROPE Study 47