2 Z.S. Saad, R.C. Reynolds / <strong>NeuroImage</strong> xxx (2011) xxx–xxx1996) voxelwise programs can handle surface-based data, while spatialoperations such as smoothing, clustering, and regions-<strong>of</strong>-interest drawinghave <strong>the</strong>ir own implementation in <strong>SUMA</strong>. The visualization part <strong>of</strong><strong>SUMA</strong> allows for very fast and simultaneous display <strong>of</strong> multiple surfacemodels and corresponding multitudes <strong>of</strong> datasets, all while maintaininga direct two-way link to volumetric data from which surface modelsand data originated.In this retrospective article, we touch briefly on <strong>the</strong> motivation for<strong>the</strong> use <strong>of</strong> surface models and <strong>the</strong> circumstances prompting <strong>the</strong> creation<strong>of</strong> <strong>SUMA</strong> a little less than 10 years ago, and expand on a few aspects<strong>of</strong> data analysis and presentation that are particular to <strong>SUMA</strong>.To keep <strong>the</strong> tedium <strong>of</strong> s<strong>of</strong>tware descriptions to a minimum, we includelinks to downloadable self-executing interactive demonstrations<strong>of</strong> some features described herein.Why surfaces?The cortical surface is a highly convoluted sheet comprised <strong>of</strong> gyriand deeply buried sulci that make it difficult to appreciate its topographicorganization. Mapping such data onto cortical surface modelsis <strong>the</strong> natural way to view organizations such as retinotopy, somatotopy,and tonotopy. More recently, cortical resting state FMRI correlationpatterns were used to define functional areas (Cohen et al.,2008). Anatomists who sought to understand <strong>the</strong> cortical layout bystudying nonhuman primates first appreciated <strong>the</strong> value <strong>of</strong> cortical surfacemodels. In <strong>the</strong> early days, brain contours <strong>of</strong> each slice were outlinedmanually with flexible wires which were <strong>the</strong>n painstaking streng<strong>the</strong>ned,or with pencil and tracing paper (Van Essen and Maunsell,1980)—tasks reserved for <strong>the</strong> most patient and meticulously organizedamong us. Fortunately, computational approaches arrived to make thisprocess simpler. The group <strong>of</strong> Van Essen, long a pioneer <strong>of</strong> <strong>the</strong> use <strong>of</strong>surface models, produced s<strong>of</strong>tware known as SureFit/CARET to createcortical surface models from MRI data (Van Essen et al., 2001). About<strong>the</strong> same time, Anders Dale, Martin Sereno, Bruce Fischl (Dale et al.,1999) and colleagues produced <strong>the</strong> FreeSurfer s<strong>of</strong>tware (http://surfer.nmr.mgh.harvard.edu), which also created high-quality surfacesfrom MRI data. A multitude <strong>of</strong> surface creation s<strong>of</strong>tware followed; famousamong <strong>the</strong>m are BrainVoyager (http://www.brainvoyager.com),BrainVisa (http://brainvisa.info), and mrVista (http://white.stanford.edu/s<strong>of</strong>tware).Although surface-based analysis is restricted to <strong>the</strong> cortex, it <strong>of</strong>fersadvantages with imaging data: 1—The preservation, enhancement,and visualization <strong>of</strong> topological detail in FMRI volumes. Neighboringvoxels in <strong>the</strong> volume are not necessarily sampling <strong>the</strong> signal <strong>of</strong> neighboringregions <strong>of</strong> <strong>the</strong> cortex. This <strong>of</strong>ten leads to a spatial aliasing <strong>of</strong><strong>the</strong> FMRI signal, that gets more pronounced when one isotropicallysmoo<strong>the</strong>s <strong>the</strong> data in <strong>the</strong> volume. By mapping data from <strong>the</strong> volumedomain onto <strong>the</strong> surface domain, one can <strong>the</strong>n smooth along <strong>the</strong> surface,<strong>the</strong>reby preserving and enhancing topological detail present in<strong>the</strong> brain. An example <strong>of</strong> this would be <strong>the</strong> analysis <strong>of</strong> retinotopicdata, where isotropic smoothing in <strong>the</strong> volume can destroy <strong>the</strong> finetopology <strong>of</strong> <strong>the</strong> activation pattern. 2—Increase in statistical power.Multiple studies have shown increases in statistical power whengroup statistics (level-2) are carried out on <strong>the</strong> cortical surface comparedto <strong>the</strong> volume domain (Anticevic et al., 2008; Fischl et al.,1999b). This appears to be <strong>the</strong> case whe<strong>the</strong>r or not nonlinear warpingis utilized (Argall et al., 2006). The increase in power is likely due toimproved smoothing and domain matching across subjects. In o<strong>the</strong>rwords, <strong>the</strong> data at each node in <strong>the</strong> surface comes from gray mattervoxels (assuming proper alignment between surfaces and volumesand neglecting partial volume effects), even if nonlinear warping isnot used. The same is not true <strong>of</strong> affine registered volumes. Proper domainmatching is important, especially when comparing data fromgroups with consistent differences in <strong>the</strong> anatomy, e.g. young vs. oldsubjects. Without proper alignment and relevant tissue matching, <strong>the</strong>same voxel in volume template space from a young subject group willlikely reflect different brain tissue than in <strong>the</strong> elderly group, potentiallyleading to artificial differences in FMRI measures between <strong>the</strong> twogroups. 3—Cortical thickness. Using two surfaces modeling <strong>the</strong> innerand outer layers <strong>of</strong> gray matter, cortical thickness estimates can readilybe obtained and compared across subjects. 4—Beautiful renditions <strong>of</strong>cortex and data.To be sure, all <strong>the</strong>se advantages can be achieved in volume-basedapproaches, but at a greater computational complexity. For exampledomain matching in <strong>the</strong> volume can be improved under highly nonlinearwarps, but that is still rarely done despite marked improvementsin registration s<strong>of</strong>tware (Ashburner, 2007; Klein et al., 2009).It remains easier to deform <strong>the</strong> surface for <strong>the</strong> purposes <strong>of</strong> alignmentbecause <strong>the</strong>re is simply less to align than in <strong>the</strong> volume.And <strong>the</strong>n came <strong>SUMA</strong>In <strong>the</strong> early days <strong>of</strong> FMRI surface-based analysis, much <strong>of</strong> <strong>the</strong> effortwent into creating <strong>the</strong> surfaces out <strong>of</strong> MRI volumes—a complex taskto be sure—but manipulating surfaces or data, or relating <strong>the</strong> surfacesto <strong>the</strong> volumetric data from which <strong>the</strong>y originated was cumbersomeat best. In <strong>the</strong> mid to late nineties, by <strong>the</strong> time one got done analyzingretinotopic data on a flattened version <strong>of</strong> <strong>the</strong> cortical surface, multiplesteps were needed to find out where a particular node on <strong>the</strong> flat (orinflated) map came from in <strong>the</strong> volume. Even surface display was difficultand sluggish: one moved a slider bar to set viewing angles and<strong>the</strong>n clicked a button to refresh <strong>the</strong> display. Now <strong>the</strong> user simplyclicks on <strong>the</strong> brain and moves it around until <strong>the</strong> desired view isachieved, or with a mouse flick sends <strong>the</strong> brain twirling gently inspace—a task particularly mesmerizing for toddlers and grizzled scientistsalike. This interactivity requires high-performance graphicshardware that is now readily available on handheld devices. However,in <strong>the</strong> early days displaying surface models was only available on expensivehigh-end Silicon Graphics Incorporated machines, and interactivitywas very limited. For instance, as a graduate student in <strong>the</strong> midnineties, where home-grown tools were <strong>the</strong> norm for creating andmapping data onto cortical surfaces, I (author ZSS) was asked to compareFMRI signal properties in visual areas that had been delineatedby FMRI retinotopy on flattened models <strong>of</strong> <strong>the</strong> occipital cortex. To mychagrin, <strong>the</strong> only way to read <strong>the</strong> data values <strong>of</strong>f <strong>of</strong> <strong>the</strong> flattened occipitalmaps was by reverse mapping node colors back to data values per<strong>the</strong> color scale! That was because a colorized rendering <strong>of</strong> <strong>the</strong> datawas <strong>the</strong> end point <strong>of</strong> <strong>the</strong> mapping process; data values were not preservedin <strong>the</strong> process. Needless to say, that project did not go far. Suchdifficulties in relating surfaces to <strong>the</strong> volume made it harder to detectanomalies in <strong>the</strong> segmentation, or in <strong>the</strong> functional data. It was also difficultto view in detail <strong>the</strong> meshes modeling <strong>the</strong> cortical surfaces, aproblem particularly vexing when trying to understand <strong>the</strong> source <strong>of</strong>errors in <strong>the</strong> geometry or <strong>the</strong> triangulation <strong>of</strong> dense surface meshes.Such frustrations, coupled with an interest in <strong>the</strong> spatial properties<strong>of</strong> <strong>the</strong> BOLD response and <strong>the</strong> irresistible lure <strong>of</strong> beautiful 3D corticalrenderings begat <strong>SUMA</strong> and shaped its structure and features.<strong>SUMA</strong> was first released on <strong>the</strong> 4th <strong>of</strong> March 2002, about 1 yearafter I joined Bob Cox at <strong>the</strong> Scientific and Statistical ComputingCore at NIMH. Unencumbered by <strong>the</strong> task <strong>of</strong> creating surface modelsand <strong>the</strong>ir myriad derivates, <strong>SUMA</strong>'s design focus was on controlling<strong>the</strong> mapping between volume and surface domains, concurrent display<strong>of</strong> all geometric variants <strong>of</strong> <strong>the</strong> same surface and maintainingan interactive and direct link between <strong>the</strong> surface and volume domains.Initially <strong>SUMA</strong> used surface models created by Caret (VanEssen et al., 2001), FreeSurfer, and BrainVoyager. With <strong>the</strong> adventand adoption <strong>of</strong> GIFTI http://www.nitrc.org/projects/gifti, surfacesand data from o<strong>the</strong>r platforms such as BrainVisa are now readily utilized.The rapid development and <strong>the</strong> high level <strong>of</strong> interactivity <strong>of</strong><strong>SUMA</strong> at <strong>the</strong> first release were due to multiple factors: 1—A firsthandexperience with what was missing in surface-based analysis:<strong>the</strong> ability to see and access <strong>the</strong> data on <strong>the</strong> surface and relate surfacePlease cite this article as: Saad, Z.S., Reynolds, R.C., <strong>SUMA</strong>, <strong>NeuroImage</strong> (2011), doi:10.1016/j.neuroimage.2011.09.016
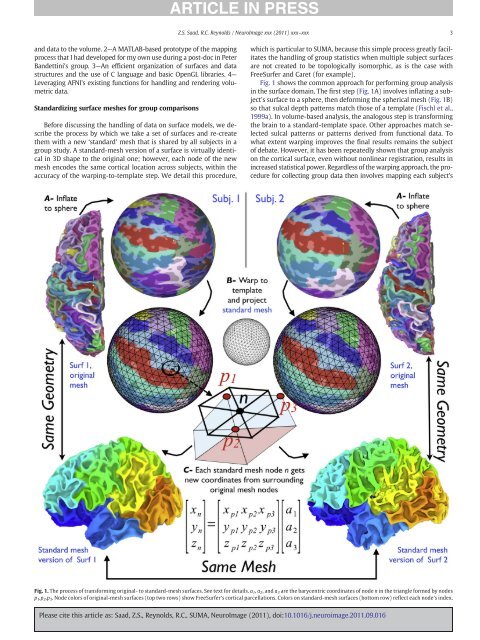
Z.S. Saad, R.C. Reynolds / <strong>NeuroImage</strong> xxx (2011) xxx–xxx3and data to <strong>the</strong> volume. 2—A MATLAB-based prototype <strong>of</strong> <strong>the</strong> mappingprocess that I had developed for my own use during a post-doc in PeterBandettini's group. 3—An efficient organization <strong>of</strong> surfaces and datastructures and <strong>the</strong> use <strong>of</strong> C language and basic OpenGL libraries. 4—Leveraging <strong>AFNI</strong>'s existing functions for handling and rendering volumetricdata.Standardizing surface meshes for group comparisonsBefore discussing <strong>the</strong> handling <strong>of</strong> data on surface models, we describe<strong>the</strong> process by which we take a set <strong>of</strong> surfaces and re-create<strong>the</strong>m with a new ‘standard’ mesh that is shared by all subjects in agroup study. A standard-mesh version <strong>of</strong> a surface is virtually identicalin 3D shape to <strong>the</strong> original one; however, each node <strong>of</strong> <strong>the</strong> newmesh encodes <strong>the</strong> same cortical location across subjects, within <strong>the</strong>accuracy <strong>of</strong> <strong>the</strong> warping-to-template step. We detail this procedure,which is particular to <strong>SUMA</strong>, because this simple process greatly facilitates<strong>the</strong> handling <strong>of</strong> group statistics when multiple subject surfacesare not created to be topologically isomorphic, as is <strong>the</strong> case withFreeSurfer and Caret (for example).Fig. 1 shows <strong>the</strong> common approach for performing group analysisin <strong>the</strong> surface domain. The first step (Fig. 1A) involves inflating a subject'ssurface to a sphere, <strong>the</strong>n deforming <strong>the</strong> spherical mesh (Fig. 1B)so that sulcal depth patterns match those <strong>of</strong> a template (Fischl et al.,1999a). In volume-based analysis, <strong>the</strong> analogous step is transforming<strong>the</strong> brain to a standard-template space. O<strong>the</strong>r approaches match selectedsulcal patterns or patterns derived from functional data. Towhat extent warping improves <strong>the</strong> final results remains <strong>the</strong> subject<strong>of</strong> debate. However, it has been repeatedly shown that group analysison <strong>the</strong> cortical surface, even without nonlinear registration, results inincreased statistical power. Regardless <strong>of</strong> <strong>the</strong> warping approach, <strong>the</strong> procedurefor collecting group data <strong>the</strong>n involves mapping each subject'sFig. 1. The process <strong>of</strong> transforming original- to standard-mesh surfaces. See text for details. a 1 , a 2 ,anda 3 are <strong>the</strong> barycentric coordinates <strong>of</strong> node n in <strong>the</strong> triangle formed by nodesp 1 ,p 2 ,p 3 . Node colors <strong>of</strong> original-mesh surfaces (top two rows) show FreeSurfer's cortical parcellations. Colors on standard-mesh surfaces (bottom row) reflect each node's index.Please cite this article as: Saad, Z.S., Reynolds, R.C., <strong>SUMA</strong>, <strong>NeuroImage</strong> (2011), doi:10.1016/j.neuroimage.2011.09.016