SUMA NeuroImage - the AFNI/NIfTI Server - National Institutes of ...
SUMA NeuroImage - the AFNI/NIfTI Server - National Institutes of ...
SUMA NeuroImage - the AFNI/NIfTI Server - National Institutes of ...

You also want an ePaper? Increase the reach of your titles
YUMPU automatically turns print PDFs into web optimized ePapers that Google loves.
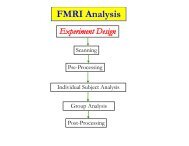
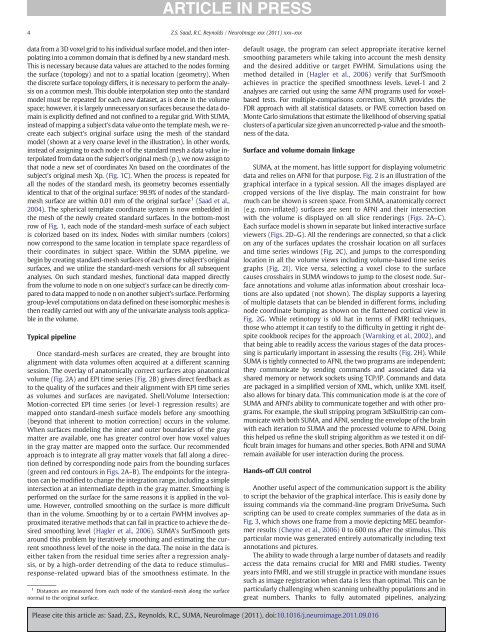
4 Z.S. Saad, R.C. Reynolds / <strong>NeuroImage</strong> xxx (2011) xxx–xxxdata from a 3D voxel grid to his individual surface model, and <strong>the</strong>n interpolatinginto a common domain that is defined by a new standard mesh.This is necessary because data values are attached to <strong>the</strong> nodes forming<strong>the</strong> surface (topology) and not to a spatial location (geometry). When<strong>the</strong> discrete surface topology differs, it is necessary to perform <strong>the</strong> analysison a common mesh. This double interpolation step onto <strong>the</strong> standardmodel must be repeated for each new dataset, as is done in <strong>the</strong> volumespace; however, it is largely unnecessary on surfaces because <strong>the</strong> data domainis explicitly defined and not confined to a regular grid. With <strong>SUMA</strong>,instead <strong>of</strong> mapping a subject's data value onto <strong>the</strong> template mesh, we recreateeach subject's original surface using <strong>the</strong> mesh <strong>of</strong> <strong>the</strong> standardmodel (shown at a very coarse level in <strong>the</strong> illustration). In o<strong>the</strong>r words,instead <strong>of</strong> assigning to each node n <strong>of</strong> <strong>the</strong> standard mesh a data value interpolatedfrom data on <strong>the</strong> subject's original mesh (p . ), we now assign tothat node a new set <strong>of</strong> coordinates Xn based on <strong>the</strong> coordinates <strong>of</strong> <strong>the</strong>subject's original mesh Xp. (Fig. 1C). When <strong>the</strong> process is repeated forall <strong>the</strong> nodes <strong>of</strong> <strong>the</strong> standard mesh, its geometry becomes essentiallyidentical to that <strong>of</strong> <strong>the</strong> original surface: 99.9% <strong>of</strong> nodes <strong>of</strong> <strong>the</strong> standardmeshsurface are within 0.01 mm <strong>of</strong> <strong>the</strong> original surface 1 (Saad et al.,2004). The spherical template coordinate system is now embedded in<strong>the</strong> mesh <strong>of</strong> <strong>the</strong> newly created standard surfaces. In <strong>the</strong> bottom-mostrow <strong>of</strong> Fig. 1, each node <strong>of</strong> <strong>the</strong> standard-mesh surface <strong>of</strong> each subjectis colorized based on its index. Nodes with similar numbers (colors)now correspond to <strong>the</strong> same location in template space regardless <strong>of</strong><strong>the</strong>ir coordinates in subject space. Within <strong>the</strong> <strong>SUMA</strong> pipeline, webegin by creating standard-mesh surfaces <strong>of</strong> each <strong>of</strong> <strong>the</strong> subject's originalsurfaces, and we utilize <strong>the</strong> standard-mesh versions for all subsequentanalyses. On such standard meshes, functional data mapped directlyfrom <strong>the</strong> volume to node n on one subject's surface can be directly comparedto data mapped to node n on ano<strong>the</strong>r subject's surface. Performinggroup-level computations on data defined on <strong>the</strong>se isomorphic meshes is<strong>the</strong>n readily carried out with any <strong>of</strong> <strong>the</strong> univariate analysis tools applicablein <strong>the</strong> volume.Typical pipelineOnce standard-mesh surfaces are created, <strong>the</strong>y are brought intoalignment with data volumes <strong>of</strong>ten acquired at a different scanningsession. The overlay <strong>of</strong> anatomically correct surfaces atop anatomicalvolume (Fig. 2A) and EPI time series (Fig. 2B) gives direct feedback asto <strong>the</strong> quality <strong>of</strong> <strong>the</strong> surfaces and <strong>the</strong>ir alignment with EPI time seriesas volumes and surfaces are navigated. Shell/Volume Intersection:Motion-corrected EPI time series (or level-1 regression results) aremapped onto standard-mesh surface models before any smoothing(beyond that inherent to motion correction) occurs in <strong>the</strong> volume.When surfaces modeling <strong>the</strong> inner and outer boundaries <strong>of</strong> <strong>the</strong> graymatter are available, one has greater control over how voxel valuesin <strong>the</strong> gray matter are mapped onto <strong>the</strong> surface. Our recommendedapproach is to integrate all gray matter voxels that fall along a directiondefined by corresponding node pairs from <strong>the</strong> bounding surfaces(green and red contours in Figs. 2A–B). The endpoints for <strong>the</strong> integrationcan be modified to change <strong>the</strong> integration range, including a simpleintersection at an intermediate depth in <strong>the</strong> gray matter. Smoothing isperformed on <strong>the</strong> surface for <strong>the</strong> same reasons it is applied in <strong>the</strong> volume.However, controlled smoothing on <strong>the</strong> surface is more difficultthan in <strong>the</strong> volume. Smoothing by or to a certain FWHM involves approximatediterative methods that can fail in practice to achieve <strong>the</strong> desiredsmoothing level (Hagler et al., 2006). <strong>SUMA</strong>'s SurfSmooth getsaround this problem by iteratively smoothing and estimating <strong>the</strong> currentsmoothness level <strong>of</strong> <strong>the</strong> noise in <strong>the</strong> data. The noise in <strong>the</strong> data isei<strong>the</strong>r taken from <strong>the</strong> residual time series after a regression analysis,or by a high-order detrending <strong>of</strong> <strong>the</strong> data to reduce stimulus–response-related upward bias <strong>of</strong> <strong>the</strong> smoothness estimate. In <strong>the</strong>1 Distances are measured from each node <strong>of</strong> <strong>the</strong> standard-mesh along <strong>the</strong> surfacenormal to <strong>the</strong> original surface.default usage, <strong>the</strong> program can select appropriate iterative kernelsmoothing parameters while taking into account <strong>the</strong> mesh densityand <strong>the</strong> desired additive or target FWHM. Simulations using <strong>the</strong>method detailed in (Hagler et al., 2006) verify that SurfSmoothachieves in practice <strong>the</strong> specified smoothness levels. Level-1 and 2analyses are carried out using <strong>the</strong> same <strong>AFNI</strong> programs used for voxelbasedtests. For multiple-comparisons correction, <strong>SUMA</strong> provides <strong>the</strong>FDR approach with all statistical datasets, or FWE correction based onMonte Carlo simulations that estimate <strong>the</strong> likelihood <strong>of</strong> observing spatialclusters <strong>of</strong> a particular size given an uncorrected p-value and <strong>the</strong> smoothness<strong>of</strong> <strong>the</strong> data.Surface and volume domain linkage<strong>SUMA</strong>, at <strong>the</strong> moment, has little support for displaying volumetricdata and relies on <strong>AFNI</strong> for that purpose. Fig. 2 is an illustration <strong>of</strong> <strong>the</strong>graphical interface in a typical session. All <strong>the</strong> images displayed arecropped versions <strong>of</strong> <strong>the</strong> live display. The main constraint for howmuch can be shown is screen space. From <strong>SUMA</strong>, anatomically correct(e.g. non-inflated) surfaces are sent to <strong>AFNI</strong> and <strong>the</strong>ir intersectionwith <strong>the</strong> volume is displayed on all slice renderings (Figs. 2A–C).Each surface model is shown in separate but linked interactive surfaceviewers (Figs. 2D–G). All <strong>the</strong> renderings are connected, so that a clickon any <strong>of</strong> <strong>the</strong> surfaces updates <strong>the</strong> crosshair location on all surfacesand time series windows (Fig. 2C), and jumps to <strong>the</strong> correspondinglocation in all <strong>the</strong> volume views including volume-based time seriesgraphs (Fig. 2I). Vice versa, selecting a voxel close to <strong>the</strong> surfacecauses crosshairs in <strong>SUMA</strong> windows to jump to <strong>the</strong> closest node. Surfaceannotations and volume atlas information about crosshair locationsare also updated (not shown). The display supports a layering<strong>of</strong> multiple datasets that can be blended in different forms, includingnode coordinate bumping as shown on <strong>the</strong> flattened cortical view inFig. 2G. While retinotopy is old hat in terms <strong>of</strong> FMRI techniques,those who attempt it can testify to <strong>the</strong> difficulty in getting it right despitecookbook recipes for <strong>the</strong> approach (Warnking et al., 2002), andthat being able to readily access <strong>the</strong> various stages <strong>of</strong> <strong>the</strong> data processingis particularly important in assessing <strong>the</strong> results (Fig. 2H). While<strong>SUMA</strong> is tightly connected to <strong>AFNI</strong>, <strong>the</strong> two programs are independent;<strong>the</strong>y communicate by sending commands and associated data viashared memory or network sockets using TCP/IP. Commands and dataare packaged in a simplified version <strong>of</strong> XML, which, unlike XML itself,also allows for binary data. This communication mode is at <strong>the</strong> core <strong>of</strong><strong>SUMA</strong> and <strong>AFNI</strong>'s ability to communicate toge<strong>the</strong>r and with o<strong>the</strong>r programs.For example, <strong>the</strong> skull stripping program 3dSkullStrip can communicatewith both <strong>SUMA</strong>, and <strong>AFNI</strong>, sending <strong>the</strong> envelope <strong>of</strong> <strong>the</strong> brainwith each iteration to <strong>SUMA</strong> and <strong>the</strong> processed volume to <strong>AFNI</strong>. Doingthis helped us refine <strong>the</strong> skull striping algorithm as we tested it on difficultbrain images for humans and o<strong>the</strong>r species. Both <strong>AFNI</strong> and <strong>SUMA</strong>remain available for user interaction during <strong>the</strong> process.Hands-<strong>of</strong>f GUI controlAno<strong>the</strong>r useful aspect <strong>of</strong> <strong>the</strong> communication support is <strong>the</strong> abilityto script <strong>the</strong> behavior <strong>of</strong> <strong>the</strong> graphical interface. This is easily done byissuing commands via <strong>the</strong> command-line program DriveSuma. Suchscripting can be used to create complex summaries <strong>of</strong> <strong>the</strong> data as inFig. 3, which shows one frame from a movie depicting MEG beamformerresults (Cheyne et al., 2006) 0 to 600 ms after <strong>the</strong> stimulus. Thisparticular movie was generated entirely automatically including textannotations and pictures.The ability to wade through a large number <strong>of</strong> datasets and readilyaccess <strong>the</strong> data remains crucial for MRI and FMRI studies. Twentyyears into FMRI, and we still struggle in practice with mundane issuessuch as image registration when data is less than optimal. This can beparticularly challenging when scanning unhealthy populations and ingreat numbers. Thanks to fully automated pipelines, analyzingPlease cite this article as: Saad, Z.S., Reynolds, R.C., <strong>SUMA</strong>, <strong>NeuroImage</strong> (2011), doi:10.1016/j.neuroimage.2011.09.016