Housing Land Availability Schedule 2012 - Fylde Borough Council
Housing Land Availability Schedule 2012 - Fylde Borough Council
Housing Land Availability Schedule 2012 - Fylde Borough Council

Create successful ePaper yourself
Turn your PDF publications into a flip-book with our unique Google optimized e-Paper software.
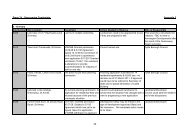
<strong>Fylde</strong> <strong>Housing</strong> Monitoring Report 2011 - <strong>2012</strong>HOUSING SUPPLY NO. OF NEW DWELLINGS PROVIDED IN FYLDE BOROUGH COUNCILTable 1 - Total New Dwellings (Net) new build and conversion's completed by areaALL SITES 91/92 92/93 93/94 94/95 95/96 96/97 97/98 98/99 99/00 00/0125%00/01** 01/02* 02/03 03/04 04/05 05/06 06/07 07/08 08/09 09/10 10/11 11/12TOTALfrom2001Lytham St. Annes 122 158 91 77 54 88 100 100 170 202 50 145 276 133 229 90 144 280 235 92 69 28 1771Freckleton/Warton 14 41 54 25 36 64 49 59 22 7 2 2 8 0 7 5 8 3 0 17 1 1 54Kirkham/Wesham 139 135 64 69 116 45 60 40 1 13 3 21 14 3 13 6 5 81 51 29 31 99 356Rural Areas 34 168 105 139 37 95 59 58 22 18 5 17 47 6 36 29 11 30 19 7 14 13 234<strong>Borough</strong> Total 309 502 314 310 243 292 268 257 215 240 60 185 345 142 285 130 168 394 305 145 115 141 241525%00/01TOTALfromSMALL SITES 91/92 92/93 93/94 94/95 95/96 96/97 97/98 98/99 99/00 00/01 ** 01/02* 02/03 03/04 04/05 05/06 06/07 07/08 08/09 09/10 10/11 11/12 2001Lytham St. Annes 27 67 40 48 38 28 14 72 45 92 23 56 114 39 127 26 26 53 16 12 11 1 504Freckleton/Warton 10 21 5 5 6 3 2 17 17 7 2 2 8 0 7 5 8 3 0 17 0 1 53Kirkham/Wesham 25 8 20 14 41 6 5 20 1 13 3 21 14 3 13 0 2 0 0 5 1 17 79Rural Areas 13 31 9 32 15 28 26 34 21 3 1 15 39 5 34 6 11 10 4 7 14 1 147<strong>Borough</strong> Total 75 127 74 99 100 65 47 143 84 115 29 94 175 47 181 37 47 66 20 41 26 20 78325%00/01TOTALfromFLATS 1991/1995 95/96 96/97 97/98 98/99 99/00 00/01 ** 01/02* 02/03 03/04 04/05 05/06 06/07 07/08 08/09 09/10 10/11 11/12 2001Lytham St. Annes /////// 197 //////// 48 35 71 71 25 84 21 47 140 131 79 49 126 171 149 39 84 16 1052Freckleton/Warton /////// 11 //////// 0 2 2 1 0 0 0 0 0 0 0 0 0 0 0 0 1 0 1Kirkham/Wesham /////// 32 //////// 11 2 4 18 0 13 3 6 0 4 4 0 0 0 14 1 0 15 47Rural Areas /////// 146 //////// 13 4 2 2 1 0 0 1 3 0 0 0 0 1 0 0 0 0 5<strong>Borough</strong> Total /////// 386 //////// 72 43 79 92 26 97 24 54 143 135 83 49 126 172 163 40 85 31 110525%00/01TOTALfromCONVERSIONS 1991/1995 95/96 96/97 97/98 98/99 99/00 00/01 ** 01/02* 02/03 03/04 04/05 05/06 06/07 07/08 08/09 09/10 10/11 11/12 2001Lytham St. Annes //////// 72 //////// 36 16 12 19 18 19 4 31 22 11 26 8 5 50 0 6 21 5 189Freckleton/Warton //////// 5 //////// 0 0 0 2 0 0 0 1 6 0 0 1 0 1 0 1 0 0 10Kirkham/Wesham //////// 8 //////// 7 2 4 0 0 3 1 4 4 2 6 0 2 0 0 1 0 3 23Rural Areas //////// 60 //////// 7 11 10 9 10 3 1 11 13 3 24 4 1 12 18 8 4 0 99<strong>Borough</strong> Total //////// 145 //////// 50 29 26 30 28 25 6 47 45 16 56 13 8 63 18 16 25 8 321Notes: All figures are net allowing for dwelling losses through conversions and replacements apart from flats which are gross figures.* Nine Month period only 1 July 01 - 31 March 02. ** Total includes an assumed amount of 25% of 00/01 completions to represent completions from1 April 01 - 30 June 01, not to be inluded in final total. Adjusted 31 March <strong>2012</strong>Source: Planning Policy Records.1