- Page 1:
TechnicalManual
- Page 4 and 5:
Copyright © 2009 NCS Pearson, Inc.
- Page 6 and 7:
ivTable of ContentsPilot Stage . .
- Page 8 and 9:
viTable of ContentsTablesTable 2.1
- Page 11:
Table of Contents ixTable H.5 Criti
- Page 14 and 15:
2 Chapter 1Goals of the RevisionThe
- Page 16 and 17:
4 Chapter 1Oral ExpressionThe Expre
- Page 18 and 19:
6 Chapter 1does not provide a compr
- Page 20 and 21:
8 Chapter 1The Essay Composition su
- Page 23 and 24:
2.ChapterWIAT-III Research Procedur
- Page 25 and 26:
WIAT-III Research Procedures, Stand
- Page 27 and 28:
WIAT-III Research Procedures, Stand
- Page 29 and 30:
WIAT-III Research Procedures, Stand
- Page 31 and 32:
WIAT-III Research Procedures, Stand
- Page 33 and 34:
WIAT-III Research Procedures, Stand
- Page 35 and 36:
WIAT-III Research Procedures, Stand
- Page 37 and 38:
WIAT-III Research Procedures, Stand
- Page 39 and 40:
3.ChapterReliability and ValidityTh
- Page 41 and 42:
Reliability and Validity 29Table 3.
- Page 43 and 44:
Reliability and Validity 31Across t
- Page 45 and 46:
Reliability and Validity 33Table 3.
- Page 47 and 48:
Reliability and Validity 35The SEM
- Page 49 and 50:
Reliability and Validity 37Table 3.
- Page 51 and 52:
Evidence of Interscorer AgreementRe
- Page 53 and 54:
Reliability and Validity 41Table 3.
- Page 55 and 56:
Reliability and Validity 43Table 3.
- Page 57 and 58:
Reliability and Validity 45WAIS-IVA
- Page 59 and 60:
Reliability and Validity 4770707060
- Page 61 and 62:
Reliability and Validity 49Table 3.
- Page 63 and 64:
Reliability and Validity 51Students
- Page 65 and 66:
Reliability and Validity 53For the
- Page 67 and 68:
Reliability and Validity 55Disorder
- Page 69 and 70:
Reliability and Validity 57Table 3.
- Page 71:
Reliability and Validity 59The subt
- Page 74 and 75:
62 Appendix ATable A.1Total Raw Sco
- Page 76 and 77:
64 Appendix ATable A.2Total Raw Sco
- Page 78 and 79:
66 Appendix ATable A.2Total Raw Sco
- Page 80 and 81:
68 Appendix ATable A.3Total Raw Sco
- Page 82 and 83:
70 Appendix ATable A.4Total Raw Sco
- Page 84 and 85:
72 Appendix ATable A.4Total Raw Sco
- Page 87 and 88:
.AppendixBGrade-Based Norms Tables7
- Page 89 and 90:
Appendix B 77Table B.1Grade-Based S
- Page 91 and 92:
Appendix B 79Table B.1Grade-Based S
- Page 93 and 94:
Appendix B 81Table B.1Grade-Based S
- Page 95 and 96:
Appendix B 83Table B.1Grade-Based S
- Page 97 and 98:
Appendix B 85Table B.1Grade-Based S
- Page 99 and 100:
Appendix B 87Table B.1Grade-Based S
- Page 101 and 102:
Appendix B 89Table B.1Grade-Based S
- Page 103 and 104:
Appendix B 91Table B.1Grade-Based S
- Page 105 and 106:
Appendix B 93Table B.1Grade-Based S
- Page 107 and 108:
Appendix B 95Table B.1Grade-Based S
- Page 109 and 110:
Appendix B 97Table B.1Grade-Based S
- Page 111 and 112:
Appendix B 99Table B.1Grade-Based S
- Page 113 and 114:
Appendix B 101Table B.1Grade-Based
- Page 115 and 116:
Appendix B 103Table B.1Grade-Based
- Page 117 and 118:
Appendix B 105Table B.1Grade-Based
- Page 119 and 120:
Appendix B 107Table B.1Grade-Based
- Page 121 and 122:
Appendix B 109Table B.1Grade-Based
- Page 123 and 124:
Appendix B 111Table B.1Grade-Based
- Page 125 and 126:
Appendix B 113Table B.1Grade-Based
- Page 127 and 128:
Appendix B 115Table B.1Grade-Based
- Page 129 and 130:
Appendix B 117Table B.1Grade-Based
- Page 131 and 132:
Appendix B 119Table B.1Grade-Based
- Page 133 and 134:
Appendix B 121Table B.1Grade-Based
- Page 135 and 136:
Appendix B 123Table B.1Grade-Based
- Page 137 and 138:
Appendix B 125Table B.1Grade-Based
- Page 139 and 140:
Appendix B 127Table B.1Grade-Based
- Page 141 and 142:
Appendix B 129Table B.1Grade-Based
- Page 143 and 144:
Appendix B 131Table B.1Grade-Based
- Page 145 and 146:
Appendix B 133Table B.1Grade-Based
- Page 147 and 148:
Appendix B 135Table B.1Grade-Based
- Page 149 and 150:
Appendix B 137Table B.1Grade-Based
- Page 151 and 152:
Appendix B 139Table B.1Grade-Based
- Page 153 and 154:
Appendix B 141Table B.1Grade-Based
- Page 155 and 156:
Appendix B 143Table B.1Grade-Based
- Page 157 and 158:
Appendix B 145Table B.1Grade-Based
- Page 159 and 160:
Appendix B 147Table B.1Grade-Based
- Page 161 and 162:
Appendix B 149Table B.1Grade-Based
- Page 163 and 164:
Appendix B 151Table B.1Grade-Based
- Page 165 and 166:
Appendix B 153Table B.1Grade-Based
- Page 167 and 168:
Appendix B 155Table B.1Grade-Based
- Page 169 and 170:
Appendix B 157Table B.1Grade-Based
- Page 171 and 172:
Appendix B 159Table B.1Grade-Based
- Page 173 and 174:
Appendix B 161Table B.1Grade-Based
- Page 175 and 176:
Appendix B 163Table B.1Grade-Based
- Page 177 and 178:
Appendix B 165Table B.1Grade-Based
- Page 179 and 180:
Appendix B 167Table B.1Grade-Based
- Page 181 and 182:
Appendix B 169Table B.1Grade-Based
- Page 183 and 184:
Appendix B 171Table B.1Grade-Based
- Page 185 and 186:
Appendix B 173Table B.1Grade-Based
- Page 187 and 188:
Appendix B 175Table B.1Grade-Based
- Page 189 and 190:
Appendix B 177Table B.1Grade-Based
- Page 191 and 192:
Appendix B 179Table B.1Grade-Based
- Page 193 and 194:
Appendix B 181Table B.1Grade-Based
- Page 195 and 196:
Appendix B 183Table B.1Grade-Based
- Page 197 and 198:
Appendix B 185Table B.1Grade-Based
- Page 199 and 200:
Appendix B 187Table B.1Grade-Based
- Page 201 and 202:
Appendix B 189Table B.1Grade-Based
- Page 203 and 204:
Appendix B 191Table B.1Grade-Based
- Page 205 and 206:
Appendix B 193Table B.1Grade-Based
- Page 207 and 208:
Appendix B 195Table B.1Grade-Based
- Page 209 and 210:
Appendix B 197Table B.1Grade-Based
- Page 211 and 212:
Appendix B 199Table B.1Grade-Based
- Page 213 and 214:
Appendix B 201Table B.1Grade-Based
- Page 215 and 216:
Appendix B 203Table B.1Grade-Based
- Page 217 and 218:
Appendix B 205Table B.1Grade-Based
- Page 219 and 220:
Appendix B 207Table B.1Grade-Based
- Page 221 and 222:
Appendix B 209Table B.1Grade-Based
- Page 223 and 224:
Appendix B 211Table B.1Grade-Based
- Page 225 and 226:
Appendix B 213Table B.1Grade-Based
- Page 227 and 228:
Appendix B 215Table B.1Grade-Based
- Page 229 and 230:
Appendix B 217Table B.1Grade-Based
- Page 231 and 232:
Appendix B 219Table B.1Grade-Based
- Page 233 and 234:
Appendix B 221Table B.1Grade-Based
- Page 235 and 236:
Appendix B 223Table B.1Grade-Based
- Page 237 and 238:
Appendix B 225Table B.1Grade-Based
- Page 239 and 240:
Appendix B 227Table B.1Grade-Based
- Page 241 and 242:
Appendix B 229Table B.1Grade-Based
- Page 243 and 244:
Appendix B 231Table B.1Grade-Based
- Page 245 and 246:
Appendix B 233Table B.1Grade-Based
- Page 247 and 248:
Appendix B 235Table B.1Grade-Based
- Page 249 and 250:
Appendix B 237Table B.1Grade-Based
- Page 251 and 252:
Appendix B 239Table B.1Grade-Based
- Page 253 and 254:
Appendix B 241Table B.1Grade-Based
- Page 255 and 256:
Appendix B 243Table B.1Grade-Based
- Page 257 and 258:
Appendix B 245Table B.2 Grade-Based
- Page 259 and 260:
Appendix B 247Table B.2 Grade-Based
- Page 261 and 262:
Appendix B 249Table B.4Confidence I
- Page 263 and 264:
.AppendixCAge-Based Norms Tables251
- Page 265 and 266:
Appendix C 253Table C.1Age-Based St
- Page 267 and 268:
Appendix C 255Table C.1Age-Based St
- Page 269 and 270:
Appendix C 257Table C.1Age-Based St
- Page 271 and 272:
Appendix C 259Table C.1Age-Based St
- Page 273 and 274:
Appendix C 261Table C.1Age-Based St
- Page 275 and 276:
Appendix C 263Table C.1Age-Based St
- Page 277 and 278:
Appendix C 265Table C.1Age-Based St
- Page 279 and 280:
Appendix C 267Table C.1Age-Based St
- Page 281 and 282:
Appendix C 269Table C.1Age-Based St
- Page 283 and 284:
Appendix C 271Table C.1Age-Based St
- Page 285 and 286:
Appendix C 273Table C.1Age-Based St
- Page 287 and 288:
Appendix C 275Table C.1Age-Based St
- Page 289 and 290:
Appendix C 277Table C.1Age-Based St
- Page 291 and 292:
Appendix C 279Table C.1Age-Based St
- Page 293 and 294:
Appendix C 281Table C.1Age-Based St
- Page 295 and 296:
Appendix C 283Table C.1Age-Based St
- Page 297 and 298:
Appendix C 285Table C.1Age-Based St
- Page 299 and 300:
Appendix C 287Table C.1Age-Based St
- Page 301 and 302:
Appendix C 289Table C.1Age-Based St
- Page 303 and 304:
Appendix C 291Table C.1Age-Based St
- Page 305 and 306:
Appendix C 293Table C.1Age-Based St
- Page 307 and 308:
Appendix C 295Table C.1Age-Based St
- Page 309 and 310:
Appendix C 297Table C.1Age-Based St
- Page 311 and 312:
Appendix C 299Table C.1Age-Based St
- Page 313 and 314:
Appendix C 301Table C.1Age-Based St
- Page 315 and 316:
Appendix C 303Table C.1Age-Based St
- Page 317 and 318:
Appendix C 305Table C.1Age-Based St
- Page 319 and 320:
Appendix C 307Table C.1Age-Based St
- Page 321 and 322:
Appendix C 309Table C.1Age-Based St
- Page 323 and 324:
Appendix C 311Table C.1Age-Based St
- Page 325 and 326:
Appendix C 313Table C.1Age-Based St
- Page 327 and 328:
Appendix C 315Table C.1Age-Based St
- Page 329 and 330:
Appendix C 317Table C.1Age-Based St
- Page 331 and 332:
Appendix C 319Table C.1Age-Based St
- Page 333 and 334:
Appendix C 321Table C.1Age-Based St
- Page 335 and 336:
Appendix C 323Table C.1Age-Based St
- Page 337 and 338:
Appendix C 325Table C.1Age-Based St
- Page 339 and 340:
Appendix C 327Table C.1Age-Based St
- Page 341 and 342:
Appendix C 329Table C.1Age-Based St
- Page 343 and 344:
Appendix C 331Table C.1Age-Based St
- Page 345 and 346:
Appendix C 333Table C.1Age-Based St
- Page 347 and 348:
Appendix C 335Table C.1Age-Based St
- Page 349 and 350:
Appendix C 337Table C.1Age-Based St
- Page 351 and 352:
Appendix C 339Table C.1Age-Based St
- Page 353 and 354:
Appendix C 341Table C.1Age-Based St
- Page 355 and 356:
Appendix C 343Table C.1Age-Based St
- Page 357 and 358:
Appendix C 345Table C.1Age-Based St
- Page 359 and 360:
Appendix C 347Table C.1Age-Based St
- Page 361 and 362:
Appendix C 349Table C.1Age-Based St
- Page 363 and 364:
Appendix C 351Table C.1Age-Based St
- Page 365 and 366:
Appendix C 353Table C.1Age-Based St
- Page 367 and 368:
Appendix C 355Table C.1Age-Based St
- Page 369 and 370: Appendix C 357Table C.1Age-Based St
- Page 371 and 372: Appendix C 359Table C.1Age-Based St
- Page 373 and 374: Appendix C 361Table C.1Age-Based St
- Page 375 and 376: Appendix C 363Table C.1Age-Based St
- Page 377 and 378: Appendix C 365Table C.1Age-Based St
- Page 379 and 380: Appendix C 367Table C.1Age-Based St
- Page 381 and 382: Appendix C 369Table C.1Age-Based St
- Page 383 and 384: Appendix C 371Table C.1Age-Based St
- Page 385 and 386: Appendix C 373Table C.1Age-Based St
- Page 387 and 388: Appendix C 375Table C.1Age-Based St
- Page 389 and 390: Appendix C 377Table C.1Age-Based St
- Page 391 and 392: Appendix C 379Table C.1Age-Based St
- Page 393 and 394: Appendix C 381Table C.1Age-Based St
- Page 395 and 396: Appendix C 383Table C.1Age-Based St
- Page 397 and 398: Appendix C 385Table C.1Age-Based St
- Page 399 and 400: Appendix C 387Table C.1Age-Based St
- Page 401 and 402: Appendix C 389Table C.2 Age-Based C
- Page 403 and 404: Appendix C 391Table C.2 Age-Based C
- Page 405 and 406: Appendix C 393Table C.4Confidence I
- Page 407: .AppendixDAdditional Scores395Copyr
- Page 410 and 411: 398 Appendix DTable D.2Grade Equiva
- Page 412 and 413: 400 Appendix DTable D.2Grade Equiva
- Page 414 and 415: 402 Appendix DTable D.2Grade Equiva
- Page 416 and 417: 404 Appendix DTable D.2Grade Equiva
- Page 418 and 419: 406 Appendix DTable D.3Age Equivale
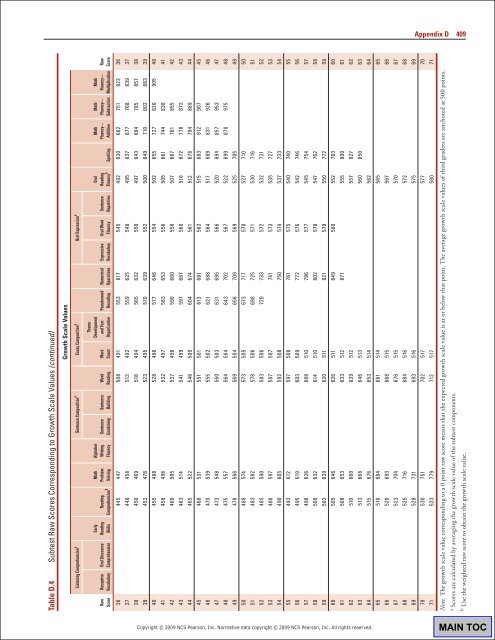
- Page 422 and 423: 410 Appendix DTable D.4 Subtest Raw
- Page 424 and 425: 412 Appendix DTable D.4 Subtest Raw
- Page 426 and 427: 414 Appendix DTable D.4 Subtest Raw
- Page 428 and 429: 416 Appendix DTable D.4 Subtest Raw
- Page 430 and 431: 418 Appendix ETable E.1WIAT-III Sub
- Page 432 and 433: 420 Appendix ETable E.1WIAT-III Sub
- Page 434 and 435: 422 Appendix ETable E.2WIAT-III Sub
- Page 436 and 437: 424 Appendix ETable E.2WIAT-III Sub
- Page 438 and 439: 426 Appendix ETable E.3WIAT-III Sub
- Page 440 and 441: 428 Appendix ETable E.3WIAT-III Sub
- Page 442 and 443: 430 Appendix ETable E.4WIAT-III Sub
- Page 444 and 445: 432 Appendix ETable E.4WIAT-III Sub
- Page 446 and 447: 434 Appendix ETable E.5WIAT-III Sub
- Page 448 and 449: 436 Appendix ETable E.5WIAT-III Sub
- Page 450 and 451: 438 Appendix ETable E.6WIAT-III Sub
- Page 452 and 453: 440 Appendix ETable E.6WIAT-III Sub
- Page 454 and 455: 442 Appendix ETable E.7WIAT-III Sub
- Page 456 and 457: 444 Appendix ETable E.7WIAT-III Sub
- Page 458 and 459: 446 Appendix ETable E.8WIAT-III Sub
- Page 460 and 461: 448 Appendix ETable E.8WIAT-III Sub
- Page 462 and 463: 450 Appendix ETable E.9WIAT-III Sub
- Page 464 and 465: 452 Appendix ETable E.9WIAT-III Sub
- Page 466 and 467: 454 Appendix ETable E.10WIAT-III Su
- Page 468 and 469: 456 Appendix ETable E.10WIAT-III Su
- Page 470 and 471:
458 Appendix ETable E.11WIAT-III Su
- Page 472 and 473:
460 Appendix ETable E.11WIAT-III Su
- Page 474 and 475:
462 Appendix ETable E.12WIAT-III Su
- Page 476 and 477:
464 Appendix ETable E.12WIAT-III Su
- Page 478 and 479:
466 Appendix ETable E.13WIAT-III Su
- Page 480 and 481:
468 Appendix ETable E.13WIAT-III Su
- Page 482 and 483:
470 Appendix ETable E.14WIAT-III Su
- Page 484 and 485:
472 Appendix ETable E.14WIAT-III Su
- Page 487 and 488:
.AppendixFPredicted-Achievement Met
- Page 489 and 490:
Appendix F 477Table F.1WPPSI-III Cr
- Page 491 and 492:
Appendix F 479Table F.2WISC-IV Crit
- Page 493 and 494:
Appendix F 481Table F.3WAIS-IV Crit
- Page 495 and 496:
Appendix F 483Table F.5DAS-II Criti
- Page 497 and 498:
.AppendixGSimple-Difference Method:
- Page 499 and 500:
Appendix G 487Table G.1WPPSI-III Cr
- Page 501 and 502:
Appendix G 489Table G.2WISC-IV Crit
- Page 503 and 504:
Appendix G 491Table G.3WAIS-IV Crit
- Page 505 and 506:
Appendix G 493Table G.5DAS-II Criti
- Page 507 and 508:
.AppendixHWIAT-III Score Difference
- Page 509 and 510:
Appendix H 497Table H.2CompositesOr
- Page 511 and 512:
Appendix H 499Table H.3Critical Val
- Page 513 and 514:
Appendix H 501Table H.3Critical Val
- Page 515 and 516:
Appendix H 503Table H.3Critical Val
- Page 517 and 518:
Appendix H 505Table H.3Critical Val
- Page 519 and 520:
Appendix H 507Table H.4Critical Val
- Page 521 and 522:
Appendix H 509Table H.4Critical Val
- Page 523 and 524:
Appendix H 511Table H.4Critical Val
- Page 525 and 526:
Appendix H 513Table H.4Critical Val
- Page 527 and 528:
Appendix H 515Table H.5Critical Val
- Page 529 and 530:
Appendix H 517Table H.5Critical Val
- Page 531 and 532:
Appendix H 519Table H.5Critical Val
- Page 533:
Appendix H 521Table H.5Critical Val
- Page 536 and 537:
524 Appendix ITable I.1 Intercorrel
- Page 538 and 539:
526 Appendix ITable I.1 Intercorrel
- Page 540 and 541:
528 Appendix ITable I.1 Intercorrel
- Page 542 and 543:
530 Appendix ITable I.1 Intercorrel
- Page 544 and 545:
532 Appendix ITable I.1 Intercorrel
- Page 546 and 547:
534 Appendix ITable I.1 Intercorrel
- Page 548 and 549:
536 Appendix ITable I.1 Intercorrel
- Page 551 and 552:
.AppendixJCorrelations of the WIAT-
- Page 553 and 554:
Appendix J 541Table J.1Correlations
- Page 555 and 556:
Appendix J 543Table J.1Correlations
- Page 557 and 558:
.AppendixKCharting Growth Scale Val
- Page 559 and 560:
References547Copyright © 2009 NCS
- Page 561 and 562:
References 549Flynn, J. R., & Weiss
- Page 563:
References 551van der Leij, A., & v


