Thai Union Frozen Products Public Company ... - Investor Relations
Thai Union Frozen Products Public Company ... - Investor Relations
Thai Union Frozen Products Public Company ... - Investor Relations

Create successful ePaper yourself
Turn your PDF publications into a flip-book with our unique Google optimized e-Paper software.
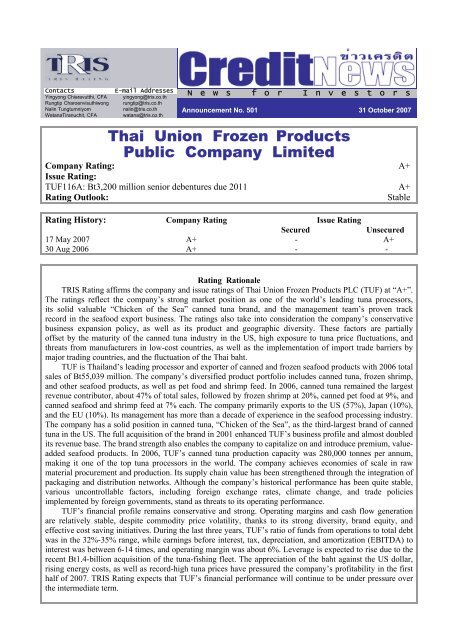
N e w s f o r I n v e s t o r sVanuatu, South Korea, the Maldives, and Japan.<strong>Thai</strong>land’s imports of frozen tuna have fluctuated,depending on tuna prices and world supply. In2006, <strong>Thai</strong>land imported 783,443 tonnes offrozen tuna, a 6% increase from the previousyear. However, due to high tuna prices during theJanuary-August 2007, the import volumedecreased 13% year-on-year to 473,884 tonnes.Production of canned tuna in <strong>Thai</strong>land grewat 8.5% per annum during 1999-2005. This is animpressive growth, considering that globalproduction grew by only 1.6% per annum duringthe same period. Data from the Office ofIndustrial Economics shows that total productionof canned tuna in <strong>Thai</strong>land was 435,857 tonnes in2006, with 95.49% of production exported.However, canned tuna production decreased to247,397 tonnes in the first eight months of 2007,or dropped by 15.5% year-on-year, due to theincrease in tuna price.In 2006, <strong>Thai</strong>land exported 416,203 tonnes ofcanned tuna, a 12.9% rise from 2005. The US isthe biggest importer of <strong>Thai</strong> canned tuna,followed by Australia, Canada, and Japan. Inaddition, canned tuna from <strong>Thai</strong>land also claimsthe biggest market share of total US canned tunaimports, with a 37.6% share in 2006. Although<strong>Thai</strong>land’s canned tuna production droppedduring January-August 2007, <strong>Thai</strong>land’s cannedtuna export grew by 3.3% from the same periodin 2006 to 280,243 tonnes.Tonnes450,000400,000350,000300,000250,000200,000150,000100,00050,0000Chart 3: <strong>Thai</strong>land’s Tuna Exports1999 2000 2001 2002 2003 2004 2005 2006 Jan-Aug2006Canned Tuna (Tonnes)Processed Tuna (Tonnes)Source: Customs Department of <strong>Thai</strong>landJan-Aug200790,00080,00070,00060,00050,00040,00030,00020,00010,0000Over the years, price competition has drivenUS canned tuna producers to relocate productionplants to countries, such as American Samoa,<strong>Thai</strong>land, and Ecuador, that have lower wages orthat are subject to minimal US tariffs. As a USterritory, products from American Samoa areexempt from US import duties. The general USimport tariff rates for canned tuna in brine is 6%within the quota and 12.5% outside the quota.Canned tuna in oil carries a high tariff rate ofTonnes35%. The yearly import quota of canned tuna isset at 20% of the volume of canned tuna producedduring the preceding year in the US, excludingAmerican Samoa. The quota volume isconsidered immaterial since most canned tunaproduced in the US is from American Samoa.There are three major canned tuna brands inthe US: StarKist, Bumble Bee, and Chicken of theSea. StarKist’s market share has been declining inrecent years, while the shares of Bumble Bee andChicken of the Sea have increased.Table 3: US Canned Tuna Market ShareUnit: %2003 2004 2005 2006 Jun 07StarKist 38.9 39.0 33.5 31.1 27.5Bumble Bee 24.4 24.3 27.4 27.6 30.8Chicken ofthe Sea17.7 17.6 18.3 18.6 20.1Source: TUF<strong>Thai</strong>land’s canned tuna exported to the EUhas increased, partly because tuna has been usedas a protein substitute for poultry, which hassuffered from the outbreaks of bird flu. In 2006,<strong>Thai</strong>land was the second largest of canned tunaexport to the EU, after Ecuador. <strong>Thai</strong> exports ofcanned tuna to the EU were 79,576 tonnes in2006, up by 24.4% from 2005. However, <strong>Thai</strong>canned tuna producers are less competitive in theEU markets due to a high tariff rate of 24%outside the quota, and 12% within the quota. Thequota for <strong>Thai</strong>land is 13,390 tonnes per year. TheEU has granted import tariff exemptions forcanned tuna from Africa, the Caribbean, and thePacific Group of States (ACP).The new bilateral agreement between<strong>Thai</strong>land and Japan, or also known as the Japan-<strong>Thai</strong>land Economic Partnership Agreement(JTEPA), was signed on 3 April 2007 and isexpected to be effective on 1 November 2007.Under the JTEPA, Japan will lower its importtariffs on <strong>Thai</strong> canned tuna to 0% within six yearsfrom the current 9.6%.Shrimp:Shrimp products are the top export earneramong all <strong>Thai</strong> fishery products, with morethan 70% of shrimp production exported. Inrecent years, shrimp production has shiftedfrom black-tiger shrimp to white shrimp orvannamei shrimp which have higher survivability.Vannamei shrimp now accounts for 95% of totalshrimp production; black-tiger shrimp productionreduced to 5% of the total._______________________________________________________________________________________________<strong>Thai</strong> <strong>Union</strong> <strong>Frozen</strong> <strong>Products</strong> PLC 431 October 2007
N e w s f o r I n v e s t o r scompromising its sales. Buying power of largeUS retailers is likely to rise overtime frombusiness consolidation. The Sea Value Group,which emerged from the consolidation of several<strong>Thai</strong> tuna packers, will directly and increasinglycompete against TUF in terms of supply, labor,pricing, and customers.• Shrimp exports continue to growTUF exports over 80% of its shrimp productsto the US. Its competitive strength in the shrimpsegment is lower than for its canned tuna. This isattributable to the highly fragmented shrimpindustry in the US, the lack of solid brandrecognition, and competition from producers indomestic and emerging markets, such as Chinaand Ecuador. Nonetheless, TUF should enjoy thecontinuing expansion of shrimp consumption inthe US, as per capita annual consumption ofshrimp in the US has been rising since 1997 andthe per capita shrimp consumption has ranked thehighest among all seafood products since 2001.Table 6: TUF’s <strong>Frozen</strong> Shrimp ExportBreakdown by LocationUnit: %2003 2004 2005 2006 1H/07USA 69 77 83 88 87EU 0 1 2 1 2Japan 22 17 15 10 10Others 9 6 1 1 2Total 100 100 100 100 100Source: TUF• Premium shrimp quality and distributionnetwork integrationTUF’s competitive edge in the shrimpbusiness stems from its end-to-end integration ofthe shrimp supply chain, with the exception ofshrimp farming, and the company’s premiumproduct quality, which meets internationalstandards and regulations. TUF sources rawmaterials from several domestic shrimp farms toreduce the risk of a disease outbreak. Its recentventure in the shrimp feed and hatcherybusinesses has reinforced its ability to maintainhigh product quality by enhancing the traceabilityprocess, criteria that is regarded as the mostimportant by many importing countries. TUFprimarily distributes shrimp products through itsown established channels in the US, withEmpress as a wholesaler and COSF as adistributor for retail segment. For the retailsegment, in particular, TUF is putting specificemphasis on revitalizing the “Chicken of the Sea”brand and uses it as a platform for frozen andcanned seafood products, notably shrimp and crabmeat. The results so far are largely positive, withfirst-half 2007 canned seafood sales up by 31%from the same period in 2006. TUF plans to forgelong-term contracts in the US and Japan, wherethere is still growth potential for value-addedseafood products and looks to enhance margins offrozen shrimp products through innovative valueaddedproducts under the “Chicken of the Sea”brand name. The company intends to steer awayfrom the commoditized nature of its products byemphasizing brand names, quality, and hygiene.• Feed business enhances income, thoughcontribution remains marginalThe shrimp feed business has been one of thegroup’s fastest growing segments in recent years,contributing about 6% of total sales in the firsthalf of 2007, up from 4% in 2004. Thoughperformance in the first half of 2007 is underhuge pricing pressure from falling domesticshrimp prices, global demand for <strong>Thai</strong> shrimp stillhas good prospects, which will subsequentlyrevive the feed market. The shrimp feed businessshould be another revenue driver for the companyin the near to intermediate term.• Careful acquisitions build solid competitivepositionAcquisitions and investments have been keyfactors in TUF’s growth and will continue to bethe main engine to drive the company’s presencein the global seafood industry. TUF has a focusedcorporate policy and has followed a conservativeacquisition strategy. The company has continuallycreated value around its core business throughsupply chain extension and the introduction ofvalue-added products. Most of TUF’s acquisitiontargets were initially trading partners with whichthe company had close business relations. TRISRating expects TUF to continue pursuing thisstrategy as a means to secure raw materials andbuild market presence in developed and newmarkets, while doing so, TUF should try tobalance such tactics against its financial profile interms of leverage and operating margins.• Expected benefits from trade liberalizationAs one of the market leaders in the globalseafood export business and a low-cost, highqualityproducer, TUF stands to benefit from thetrend towards global trade liberalization. The_______________________________________________________________________________________________<strong>Thai</strong> <strong>Union</strong> <strong>Frozen</strong> <strong>Products</strong> PLC 31 October 20077
N e w s f o r I n v e s t o r sFinancial Statistics and Key Financial Ratios *Unit: Bt million-------------- Year ended 31 December --------------6/2007 2006 2005 2004 2003 2002Sales 26,530 55,039 53,643 46,751 40,343 34,243Gross interest 263 608 361 220 140 158Net income from operations 819 1,873 2,058 1,970 2,047 1,942Funds from operations (FFO) 1,561 3,182 3,354 2,757 3,019 2,216Capital expenditures 768 1,425 1,030 1,744 848 845Total assets 27,441 27,136 26,994 23,950 20,687 17,988Total debt 9,240 9,123 9,536 8,631 6,627 4,398Shareholders’ equity 12,661 12,648 11,695 10,706 9,937 9,451Operating income before depre. and amort. as a % 5.82 6.39 6.36 6.19 7.88 8.86of salesPretax return on permanent capital (%) 5.70** 13.04 13.69 12.95 17.46 18.41Earnings before interest, tax, depre. and amort.6.76 6.29 10.40 14.49 24.53 21.07(EBITDA) interest coverage (times)FFO/total debt (%) 16.89** 34.88 35.17 31.94 45.56 50.39Total debt/capitalization (%) 39.57 39.28 42.66 42.18 37.81 29.92* Consolidated financial statements** Based on six-month performance ending June 2007 (non-annualized)_______________________________________________________________________________________________<strong>Thai</strong> <strong>Union</strong> <strong>Frozen</strong> <strong>Products</strong> PLC 31 October 20079
N e w s f o r I n v e s t o r s_______________________________________________________________________________________________<strong>Thai</strong> <strong>Union</strong> <strong>Frozen</strong> <strong>Products</strong> PLC 31 October 200710
N e w s f o r I n v e s t o r sRating Symbols and DefinitionsTRIS Rating uses eight letter rating symbols for announcing medium- and long-term credit ratings. The ratings range from AAA, the highestrating, to D, the lowest rating. The medium- and long-term debt instrument covers the period of time from one year up. The definitions are:AAAAAABBBBBBCThe highest rating, indicating a company or a debt instrument with smallest degree of credit risk. The company has extremely strongcapacity to pay interest and repay principal on time, and is unlikely to be affected by adverse changes in business, economic or otherexternal conditions.The rating indicates a company or a debt instrument with a very low degree of credit risk. The company has very strong capacity to payinterest and repay principal on time, but is somewhat more susceptible to the adverse changes in business, economic, or other externalconditions than AAA rating.The rating indicates a company or a debt instrument with a low credit risk. The company has strong capacity to pay interest and repayprincipal on time, but is more susceptible to adverse changes in business, economic or other external conditions than debt in higher-ratedcategories.The rating indicates a company or a debt instrument with moderate credit risk. The company has adequate capacity to pay interest andrepay principal on time, but is more vulnerable to adverse changes in business, economic or other external conditions and is more likely tohave a weakened capacity to pay interest and repay principal than debt in higher-rated categories.The rating indicates a company or a debt instrument with a high credit risk. The company has less than moderate capacity to pay interestand repay principal on time, and can be significantly affected by adverse changes in business, economic or other external conditions, leadingto inadequate capacity to pay interest and repay principal.The rating indicates a company or a debt instrument with a very high credit risk. The company has low capacity to pay interest and repayprincipal on time. Adverse changes in business, economic or other external conditions could lead to inability or unwillingness to pay interestand repay principal.The rating indicates a company or a debt instrument with the highest risk of default. The company has a significant inability to pay interestand repay principal on time, and is dependent upon favourable business, economic or other external conditions to meet its obligations.D The rating for a company or a debt instrument for which payment is in default.The ratings from AA to C may be modified by the addition of a plus (+) or minus (-) sign to show relative standing within a rating category.TRIS Rating’s short-term ratings focus entirely on the likelihood of default and do not focus on recovery in the event of default. Each of TRISRating’s short-term debt instrument covers the period of not more than one year.The symbols and definitions for short-term ratings are as follows:T1 Issuer has strong market position, wide margin of financial protection, appropriate liquidity and other measures of superior investorprotection. Issuer designated with a “+” has a higher degree of these protections.T2 Issuer has secure market position, sound financial fundamentals and satisfactory ability to repay short-term obligations.T3 Issuer has acceptable capacity for meeting its short-term obligations.T4 Issuer has weak capacity for meeting its short-term obligations.D The rating for an issuer for which payment is in default.All ratings assigned by TRIS Rating are local currency ratings; they reflect the <strong>Thai</strong> issuers’ ability to service their debt obligations, excludingthe risk of convertibility of the <strong>Thai</strong> baht payments into foreign currencies.TRIS Rating also assigns a “Rating Outlook” that reflects the potential direction of a credit rating over the medium to long term. In formulatingthe outlook, TRIS Rating will consider the prospects for the rated company’s industry, as well as business conditions that might have an impact on itsfundamental creditworthiness. The rating outlook will be announced in conjunction with the credit rating. In all cases, the outlook assigned to acompany will apply to all debt obligations issued by the company. The categories for “Rating Outlook” are as follows:Positive The rating may be raised.Stable The rating is not likely to change.Negative The rating may be lowered.Developing The rating may be raised, lowered or remain unchanged._______________________________________________________________________________________________<strong>Thai</strong> <strong>Union</strong> <strong>Frozen</strong> <strong>Products</strong> PLC 31 October 200711
N e w s f o r I n v e s t o r sFor subscription information, contactTRIS Rating Co., Ltd., Office of the President, Tel: 0-2231-3011 ext 500Silom Complex Building, 24th Floor, 191 Silom Road, Bangkok 10500, <strong>Thai</strong>land, www.trisrating.com© Copyright 2007, TRIS Rating Co., Ltd. All rights reserved. Any unauthorized use, disclosure, copying, republication, further transmission, dissemination, redistribution orstoring for subsequent use for any purpose, in whole or in part, in any form or manner or by any means whatsoever, by any person, of the credit rating reports or information isprohibited. The credit rating is not a statement of fact or a recommendation to buy, sell or hold any debt instruments. It is an expression of opinion regarding credit risks forthat instrument or particular company. The opinion expressed in the credit rating does not represent investment or other advice and should therefore not be construed assuch. Any rating and information contained in any report written or published by TRIS Rating has been prepared without taking into account any recipient’s particular financialneeds, circumstances, knowledge and objectives. Therefore, a recipient should assess the appropriateness of such information before making an investment decision basedon this information. Information used for the rating has been obtained by TRIS Rating from the company and other sources believed to be reliable. Therefore, TRIS Ratingdoes not guarantee the accuracy, adequacy, or completeness of any such information and will accept no liability for any loss or damage arising from any inaccuracy,inadequacy or incompleteness. Also, TRIS Rating is not responsible for any errors or omissions, the result obtained from, or any actions taken in reliance upon suchinformation._______________________________________________________________________________________________<strong>Thai</strong> <strong>Union</strong> <strong>Frozen</strong> <strong>Products</strong> PLC 31 October 200712