Opinion of the Independent Financial Advisor - Investor Relations
Opinion of the Independent Financial Advisor - Investor Relations
Opinion of the Independent Financial Advisor - Investor Relations

You also want an ePaper? Increase the reach of your titles
YUMPU automatically turns print PDFs into web optimized ePapers that Google loves.
(Translation)The <strong>Opinion</strong> <strong>of</strong> <strong>the</strong> <strong>Independent</strong> <strong>Financial</strong> <strong>Advisor</strong>on <strong>the</strong> Asset Acquisition <strong>of</strong>Thai Union Frozen Products Pcl.Prepared ByCIMB Securities (Thailand) Company Limited11 August 2010
The <strong>Opinion</strong> <strong>of</strong> <strong>the</strong> <strong>Independent</strong> <strong>Financial</strong> <strong>Advisor</strong> on <strong>the</strong> Asset Acquisition <strong>of</strong> Thai Union Frozen Products Plc.MWBrands Positioning in <strong>the</strong> MarketThe detail <strong>of</strong> leading products under MWBrands portfolio could be explained as follows:• John West is a leader <strong>of</strong> <strong>the</strong> ambient seafood space in <strong>the</strong> UK, Ireland, andNe<strong>the</strong>rlands. The brand has a major position in all <strong>of</strong> <strong>the</strong> three countries.• Its products are tuna, salmon and value added fish products There are over130 products in <strong>the</strong> John West range including Tuna and Salmon LightLunches, Tuna with Omega 3 and new No Drain, Less Mess Tuna.• Besides <strong>the</strong>se 3 countries, John West also trades in 38 markets throughoutEurope, <strong>the</strong> Middle East, Nor<strong>the</strong>rn Africa, North and South America.• The ambient seafood market value <strong>of</strong> <strong>the</strong> UK, Ireland, and <strong>the</strong> Ne<strong>the</strong>rlands areEUR 534 million, EUR 39 million and EUR 66 million, respectively• Petit Navire is a household brand in France established 75 years ago and is<strong>the</strong> leading branded producer <strong>of</strong> ambient seafood and holds a leading marketshare in <strong>the</strong> French ambient seafood market• Its products range from tuna, mackerel, and sardine• The ambient market value <strong>of</strong> France is EUR 773 millionPage 5
The <strong>Opinion</strong> <strong>of</strong> <strong>the</strong> <strong>Independent</strong> <strong>Financial</strong> <strong>Advisor</strong> on <strong>the</strong> Asset Acquisition <strong>of</strong> Thai Union Frozen Products Plc.• Mareblu is one <strong>of</strong> <strong>the</strong> leading brands in <strong>the</strong> Italian ambient tuna sector with one<strong>of</strong> a leading market share• Mareblu is an historical brand in <strong>the</strong> Italian tuna market. Mareblu was foundedin <strong>the</strong> early 1970s• Its products are tuna, mackerel, and sardine• The ambient seafood market value <strong>of</strong> Italy is EUR 910 million• The brand H. Parmentier is one <strong>of</strong> <strong>the</strong> leading premier sardine brands inFrance with one <strong>of</strong> <strong>the</strong> leading market shares in <strong>the</strong> French premium ambientseafood market• Its main product is whole sardine products• The ambient seafood market value <strong>of</strong> France is EUR 773 millionNote: <strong>the</strong> figures <strong>of</strong> market value are for 2009Production FacilitiesAs a vertically integrated operator, MWBrands has its own fleet and production facilities located near majorfishing grounds. MWBrands is one <strong>of</strong> a few seafood players with primary processing capabilities in multiplesourcing territories using round fish technology to maximize quality and cost benefits and has itsdistribution channels through its leading brands in <strong>the</strong> European marketThe production facilities <strong>of</strong> MWBrands are located in 4 countries as summarized below:Location France Portugal Ghana SeychellesName Ets Paul Paulet ESIP (EuropeSeafoodInvestmentsPortugal, Lda)PFC (Pioneer FoodCannery Ltd)IOT (Indian OceanTuna Ltd.)Employees 200 500 1,200 2,300ProductsVarious seafoodproductsDaily performance 330,000 cans in 5sizesEnd marketsBrandsFrance, UK, Italy,Belgium,SwitzerlandJohn West, PetitNavire, Mareblu,Private Label & HDCanned sardines &mackerel155 tons processed350,000 cansproducedUK, France,Switzerland, Italy,Ireland, Ne<strong>the</strong>rland,RussiaJohn West, PetitNavire, H.Parmentier,Mareblu,Canned tuna &frozen tuna loins800,000 cans & 20loin tonsUK, France, Italy,Ireland, Ne<strong>the</strong>rland,Germany, WestAfricaJohn West, PetitNavire, Mareblu,Royal Pacific,StarkistCertifications IFS/ BRC IFIS BRC IFIS ISO 9001-2000, ISO14001, OHAS BRCIFISa.) Ets Pual Paulet, FranceCanned tuna350 tons produced1.5 million cansproducedUK, France, Italy,Ireland, Ne<strong>the</strong>rland,Russia, LibyaJohn West, PetitNavire, Mareblu,ISO 9001-2000, ISO14001, OHAS BRCIFISThe Breton port <strong>of</strong> Douarnenez owes its prosperity to sardines. For decades, thanks to its favourableclimate, <strong>the</strong> little town's immense bay has been an inexhaustible breeding ground for this species.Although not <strong>the</strong> first town to have canning factories, Douarnenez's first cannery was established in 1853and, by <strong>the</strong> beginning <strong>of</strong> <strong>the</strong> 20th century, <strong>the</strong> port possessed around forty. Douarnenez became known as<strong>the</strong> "European capital <strong>of</strong> canned fish".Page 6
The <strong>Opinion</strong> <strong>of</strong> <strong>the</strong> <strong>Independent</strong> <strong>Financial</strong> <strong>Advisor</strong> on <strong>the</strong> Asset Acquisition <strong>of</strong> Thai Union Frozen Products Plc.MWBrands’ factory was founded in 1963 by Yves and Jean Paulet (both sons <strong>of</strong> Paul-Edouard Paulet,creator <strong>of</strong> <strong>the</strong> French “Petit Navire” brand). It has since expanded its range <strong>of</strong> activities to manufacturesardine, tuna, salmon and mackerel products.b.) ESIP, PortugalThe ESIP plant in Peniche (Portugal) is MWBrands’ processing centre for all mackerel and sardinesbrands. It is mostly dedicated to servicing <strong>the</strong> European market. In line with company strategy, ESIP islocated on <strong>the</strong> Atlantic coast and utilizes mostly Portuguese sardines and Atlantic mackerel, bothconsidered to be in <strong>the</strong> highest quality segment for <strong>the</strong>se species.The company’s operating and quality standards, toge<strong>the</strong>r with an experienced management and labourforce, ensure <strong>the</strong> high quality <strong>of</strong> <strong>the</strong> fish that is canned and sold to our customers without compromising<strong>the</strong> competitiveness <strong>of</strong> ESIP.c.) PFC, GhanaThe Pioneer Food Cannery, Ltd, was established in 1972 and underwent a major expansion in 1993 underH.J. Heinz in order to produce tuna loins as well as canned tuna. The main reason PFC is located inGhana is <strong>the</strong> favourable tropical conditions <strong>of</strong> that part <strong>of</strong> <strong>the</strong> Atlantic Ocean (FAO declared fishing Zone34). This makes <strong>the</strong> Gulf <strong>of</strong> Guinea one <strong>of</strong> <strong>the</strong> best feeding and breeding grounds for tuna species.As <strong>the</strong> Ghanaians are known as ‘The Fishermen <strong>of</strong> West Africa’, it was <strong>the</strong> ideal place to set up a cannery<strong>of</strong> this magnitude, making use <strong>of</strong> <strong>the</strong> existing and sustainable natural resources. More so, <strong>the</strong> stablepolitical and economic situation has shown that <strong>the</strong> engagement <strong>of</strong> PFC in this industry has been aworthwhile endeavour.d.) IOT, SeychellesMWBrands’ presence in <strong>the</strong> Seychelles is motivated by a policy <strong>of</strong> vertical integration “from <strong>the</strong> ocean to<strong>the</strong> plate” ensuring direct supply <strong>of</strong> our factory without transshipping <strong>of</strong> raw materials. These raw materialsare provided by a modern and well equipped fleet (under French, Spanish and Seychellois flags) which isregulated by <strong>the</strong> competent European authorities.The premium quality <strong>of</strong> <strong>the</strong> fish justifies a top <strong>of</strong> <strong>the</strong> range product positioning for all MWBrands’ brandsalong with a guarantee <strong>of</strong> respect for <strong>the</strong> environment through sustainable fishing in an ocean protectedand monitored by highly prestigious bodies (SFA, IOTC).FleetTTV Ltd., subsidiary <strong>of</strong> <strong>the</strong> group MWBrands, is a major stakeholder in tuna fishing in Ghana and was at<strong>the</strong> beginning <strong>of</strong> 1997 operating 10 tuna fishing vessels. Since 2008, <strong>the</strong> company disposed <strong>of</strong> <strong>the</strong> nonpr<strong>of</strong>itablevessels and now operates 5 industrial tuna fishing vessels, all purse seiners.The company TTV Ltd catches around 26,500mt <strong>of</strong> fish annually and supplies <strong>the</strong> MWBrands plant inGhana – Pioneer Food Cannery – with about 60% <strong>of</strong> its fish requirements.TTV Ltd is based in <strong>the</strong> fishing harbour <strong>of</strong> Tema. It has a small engineering workshop which providesprompt and efficient technical service to <strong>the</strong> fleet. It also has a warehouse next to <strong>the</strong> harbour for <strong>the</strong>safekeeping <strong>of</strong> all vessel equipment and spare parts.The total crew consists <strong>of</strong> approximately 180 experienced <strong>of</strong>ficers and sailors, some <strong>of</strong> <strong>the</strong>m haveexperience <strong>of</strong> more than 20 years. The sea going crew is supported by a local management team <strong>of</strong> 30people.The detail <strong>of</strong> <strong>the</strong> 5 fleets under TTV could be explained as follows:a. Drago Built in Italy, it is <strong>the</strong> biggest purse seiner operating under <strong>the</strong> flag <strong>of</strong> Ghana.80m long and with a fish capacity <strong>of</strong> 1,300 tons <strong>of</strong> round tuna, <strong>the</strong> Dragocatches about 7,000 tons per year.b. Cap des Palmes This vessel was purchased by <strong>the</strong> group in September 2008. She is 55mlong, with a fish capacity <strong>of</strong> 575 tons <strong>of</strong> fish, and was built in France. Theexpected annual catches are about 4,500 tonsc. Cap Lopez Sister ship <strong>of</strong> Cap des Palmes and acquired at <strong>the</strong> same time TTV Ltd.Same expected annual catch size.Page 7
The <strong>Opinion</strong> <strong>of</strong> <strong>the</strong> <strong>Independent</strong> <strong>Financial</strong> <strong>Advisor</strong> on <strong>the</strong> Asset Acquisition <strong>of</strong> Thai Union Frozen Products Plc.d. Cap Saint-Paul Built in Dieppe (France), this vessel was purchased in July 2009 by <strong>the</strong>group. The expected annual catches are about 5,000 tons.e. Ile de Kerbihan This purse seiner has <strong>the</strong> expected annual catches <strong>of</strong> around 4,000 tons.5.2 <strong>Financial</strong> HighlightUnit: EUR millionFiscal Year Ending 31 MarchFY2008 FY2009 FY2010Revenue 490.9 443.6 448.2Earning before interest, tax, depreciation,and amortization (EBITDA) 60.1 67.6 82.8Earning before interest and tax 49.5 51.2 70.3Total assets 620.7 580.8 559.4Total liabilities 577.5 519.7 462.4Total shareholders’ equity 43.3 61.1 97.05.3 Group Structure <strong>of</strong> MWBrands as <strong>of</strong> 31 March 20105.4 Major ShareholderMWBrands has one major shareholder, which holds 100.00% <strong>of</strong> its total issued share capital as at 27 July2010, European Seafood 2 S.á.r.l., a company registered in Luxembourg and controlled by funds advisedby Trilantic Capital Partners.5.5 ManagementMWBrands’ key management and <strong>the</strong>ir experiences could be summarized as follows:Position Management Name Management Pr<strong>of</strong>ileChief ExecutiveOfficerChief OperatingOfficerMr. Adolfo ValsecchiMr. Jean-LucPardessusAged 68, Mr. Valsecchi has an engineering background.His pr<strong>of</strong>essional life has been dedicated to <strong>the</strong> Seafoodindustry for more than 35 years. He ran <strong>the</strong> N° 2 CannedSeafood Business in Italy for more than 20 years and wasan active member <strong>of</strong> several working groups in <strong>the</strong> EUCommission in Brussels. In 1996 he joined H.J. Heinz andin 1999 became Managing Director <strong>of</strong> <strong>the</strong> Heinz SeafoodBusiness in Europe, today MWBrands.Aged 49, Mr. Pardessus joined MWBrands in September2008 as COO. He started his career as a marketer withUnilever and <strong>the</strong>n held various Managing Directorpositions for 17 years in international groups (ReckittBenckiser, Bongrain, Campbell soup). He also served onPage 8
The <strong>Opinion</strong> <strong>of</strong> <strong>the</strong> <strong>Independent</strong> <strong>Financial</strong> <strong>Advisor</strong> on <strong>the</strong> Asset Acquisition <strong>of</strong> Thai Union Frozen Products Plc.Position Management Name Management Pr<strong>of</strong>ile<strong>the</strong> Board <strong>of</strong> <strong>the</strong> French Food and Drinks association(ANIA) and chaired different European TradeOrganizations. Mr. Pardessus is a graduate from HECSchool <strong>of</strong> Management.Chief <strong>Financial</strong>OfficerMrs. MurielRoqueje<strong>of</strong>freAged 37, Mrs. Roqueje<strong>of</strong>fre joined MWBrands in May2006 as France Finance Director. She was appointedGroup Chief <strong>Financial</strong> Officer in September 2007. Mrs.Roqueje<strong>of</strong>fre started her career with KPMG and <strong>the</strong>n heldvarious CFO positions in international groups (CloseBro<strong>the</strong>rs, Morse). Mrs. Roqueje<strong>of</strong>fre is a graduate fromHEC School <strong>of</strong> Management and holds an MSc Degree inFinance from <strong>the</strong> London School <strong>of</strong> Economics.General Secretary Mr. David Sankowicz Aged 41, Mr. Sankowicz joined H.J. Heinz in May 2005and is now acting as Group Legal Affairs & InsuranceManager within MWBrands. Prior to joining Heinz, Mr.Sankowicz worked in industry in France (SIDEL) as wellas in a Direct Marketing company (Consodata) where hewas in charge <strong>of</strong> <strong>the</strong> IPO. He began his career in a fashioncompany (Naf Naf – Chevignon). He is a graduate fromQueen Mary and Westfield College, London University inEuropean comparative law, has a master in Arbitrationfrom Paris 2 University and his French bar certificate.Purchasing andFleet DirectorManufacturingDirectorFrance Businessand EuropeMarketing DirectorHuman ResourcesDirectorMr. Philippe Gourelde Saint PernMr. Alain OlivieriMr. Amaury DutreilMrs. Joanne CarlinAged 53, Philippe Gourel de Saint Pern joined Ets PaulPaulet 8 years ago as <strong>the</strong> Fish Procurement Director, incharge <strong>of</strong> supplying fish to our canneries. In 2002, inaddition to fish purchasing, he took <strong>the</strong> responsibility <strong>of</strong>TTV Limited, <strong>the</strong> company in charge <strong>of</strong> managing our ownfleet in Ghana. He has been appointed Purchasing andFleet director since July 2009. Philippe is a specialist infish procurement and all customs related matters. Beforejoining Ets Paul Paulet, Philippe was <strong>the</strong> Supply ChainDirector <strong>of</strong> Pêche & Froid S.A. after being <strong>the</strong> plantmanager <strong>of</strong> <strong>the</strong> same company in Abidjan.Aged 54, Mr. Olivieri is <strong>the</strong> manufacturing director <strong>of</strong>MWBrands (responsible for Quality and R&D) since July2009. Mr. Olivieri joined MWBrands in February 2007acting as technical director also interim General Managerat IOT (Indian Ocean Tuna), our plant in Victoria,Seychelles. During his 29 years <strong>of</strong> Food industryexperience prior to MWBrands he held severalManufacturing and R&D positions at UNIQ Plc, Mars Incand Générale Sucrière within several European countries.Mr. Olivieri is a Mechanical Engineer from <strong>the</strong> INSA <strong>of</strong>Lyon and has a MBA from <strong>the</strong> University <strong>of</strong> Aix enAged 37, Mr. Dutreil joined MWBrands in May 2009. Hebegan his career at Nestlé France where he held varioussales and marketing positions. He spent 9 years atCampbell France where his last position was Key accountDirector <strong>the</strong>n France marketing Director. Mr. Dutreil is agraduate from HEC School <strong>of</strong> Management.Aged 35, Mrs Carlin joined John West Foods Ltd in April2006 with responsibility for UK, Holland and Ireland. Shebecame Human Resources Director for <strong>the</strong> Group in April2009. She began her career with CarnaudMetalbox,where she held various positions within <strong>the</strong> HR functionover a six-year period. She <strong>the</strong>n moved onto HoneywellPage 9
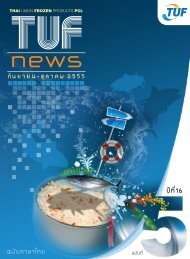
The <strong>Opinion</strong> <strong>of</strong> <strong>the</strong> <strong>Independent</strong> <strong>Financial</strong> <strong>Advisor</strong> on <strong>the</strong> Asset Acquisition <strong>of</strong> Thai Union Frozen Products Plc.Position Management Name Management Pr<strong>of</strong>ileUK Ltd based in Lancashire, UK, firstly supporting <strong>the</strong>production facility and <strong>the</strong>n later leading <strong>the</strong> HR functionfor <strong>the</strong>ir European Engineers over two sites. Mrs Carlinholds Graduate Membership <strong>of</strong> <strong>the</strong> Chartered Institute <strong>of</strong>Personnel and Development.5.6 Registered and Paid-up Share CapitalAs <strong>of</strong> 31 March 2010, MWBrands has a registered and paid-up share capital <strong>of</strong> EUR 31,367,000 with a parvalue <strong>of</strong> EUR 1.00 per share. MWBrands has granted 417,517 stock options which will enable <strong>the</strong>beneficiaries to subscribe to a maximum <strong>of</strong> 417,517 ordinary shares upon completion <strong>of</strong> <strong>the</strong> Transaction.5.7 Industry OverviewGlobal ambient seafood market is worth approximately EUR 17,000 million as measured at <strong>the</strong> level <strong>of</strong>retail sales. Western Europe is respected for being <strong>the</strong> largest geographic market with around EUR 5,700million in value or 34% share <strong>of</strong> <strong>the</strong> global market, followed by North America and Asia in respective order.Tuna is by far not only <strong>the</strong> largest segment but also <strong>the</strong> driving force to future growth for overall ambientseafood market.Western European Market Share by CountrySource: Nielsen/IRI for Italy, France and UK and Euromonitor 2009 for all o<strong>the</strong>r marketsThe total Western European ambient seafood market has experienced continuous expansion with a CAGR<strong>of</strong> around 3.4% during 2004-2009. Spain is <strong>the</strong> single largest market worth approximately EUR 1,595million in value <strong>of</strong> retail sales or 28% <strong>of</strong> <strong>the</strong> total Western European ambient seafood market in 2009. Therunners-up are Italy, France, <strong>the</strong> UK and Germany in respective order. Key driving forces rest with not only<strong>the</strong> size <strong>of</strong> population and economic grounds but also <strong>the</strong> critical mass <strong>of</strong> consumers making gradual shifttowards health-conscious behavior and having a growing preference for tuna as a result <strong>of</strong> inherentbenefits such as Omega 3 and relatively high level <strong>of</strong> protein content. Entry barrier is substantialparticularly to <strong>the</strong> viewpoint <strong>of</strong> Non-EU operators because <strong>the</strong> effective rate <strong>of</strong> tariffs imposed on tunaimported to <strong>the</strong> European countries is 24% unless <strong>the</strong> applicable source <strong>of</strong> origin is one <strong>of</strong> <strong>the</strong> 79 African,Caribbean and Pacific (ACP) countries deemed as part <strong>of</strong> <strong>the</strong> Cotonou Partnership Agreement.Though <strong>the</strong> global economic climate has showed sign <strong>of</strong> recovery, still <strong>the</strong> outlook respective to overallEuropean zone is doubted by and large due mainly to <strong>the</strong> public debt problem in PIGS countries i.e.Greece, Italy, Portugal, Spain and Ireland. Such prevailing threat is not considered a critical hindrance to<strong>the</strong> Western European ambient seafood market. Overall consumption per capita is expected to stabilizedue to <strong>the</strong> nature <strong>of</strong> defensive industry which is generally less sensitive to change in economic conditions.Fur<strong>the</strong>rmore, <strong>the</strong> problem is mainly concentrated in <strong>the</strong> PIIGS countries but not for <strong>the</strong> European zone.Real GDP Growth for selectednational economies (%)2009 2010 2011EU (27 countries) -4.2 1.0 1.7France -2.6 1.3 1.5The UK -4.9 1.2 2.1Page 10
The <strong>Opinion</strong> <strong>of</strong> <strong>the</strong> <strong>Independent</strong> <strong>Financial</strong> <strong>Advisor</strong> on <strong>the</strong> Asset Acquisition <strong>of</strong> Thai Union Frozen Products Plc.Germany -4.9 1.2 1.6Portugal -2.6 0.5 0.7Italy -5.0 0.8 1.4Ireland -7.1 -0.9 3.0Greece -2.0 -3.0 -0.5Spain -3.6 -0.4 0.8Source: The statistical <strong>of</strong>fice <strong>of</strong> <strong>the</strong> European UnionFrom <strong>the</strong> standpoint <strong>of</strong> MWBrands, its future business plan and anticipated financial performance shouldbe less likely to be adversely affected due to <strong>the</strong> fact that <strong>the</strong> majority <strong>of</strong> revenue from commercial sales <strong>of</strong>seafood products is generated from <strong>the</strong> UK and France, which are not involved directly with <strong>the</strong> prevailingdebt crisis. Also, based on <strong>the</strong> statistical <strong>of</strong>fice <strong>of</strong> <strong>the</strong> European Union, <strong>the</strong> UK and France are expected torecover from economic crisis in 2009, posting an accelerating rate <strong>of</strong> real GDP growth during 2010-2011.6. Value <strong>of</strong> Acquired Shares and Value <strong>of</strong> Consideration6.1 Value <strong>of</strong> Acquired SharesThe Company will acquire MWBrands for a total enterprise value <strong>of</strong> EUR 680 million, which is separatedinto two payments 1) for 100% <strong>of</strong> <strong>the</strong> shares <strong>of</strong> MWBrands to <strong>the</strong> Seller 2) for repayment <strong>of</strong> MWBrandsfinancial debts and shareholders’ debts.6.2 Value <strong>of</strong> Consideration and Payment DetailThe Company has agreed to pay for 100% <strong>of</strong> <strong>the</strong> share capital <strong>of</strong> MWBrands as at July 27 2010 from <strong>the</strong>sources <strong>of</strong> funds derived from financial institutions in Thailand and overseas for <strong>the</strong> total enterprise value<strong>of</strong> up to EUR 680 million (equivalent to THB 28,495.74 million at <strong>the</strong> exchange rate <strong>of</strong> THB 41.9055 perEUR).The payment shall be made to <strong>the</strong> Seller and its creditors on <strong>the</strong> closing date.7. The basis used to determine <strong>the</strong> value <strong>of</strong> considerationThe enterprise value <strong>of</strong> EUR 680 million is <strong>the</strong> amount that has been agreed upon by <strong>the</strong> Seller and <strong>the</strong>Company. Such consideration amount is derived from <strong>the</strong> acquisition price under <strong>the</strong> bidding processarranged by <strong>the</strong> Seller <strong>of</strong> MWBrands.8. Sources <strong>of</strong> fundsThe Company plans to finance <strong>the</strong> transaction from 3 sources i.e. long-term loan, convertible debentureissuance and right <strong>of</strong>fering and/or private placement, totaling EUR 698 million (equivalent to THB29,248million at <strong>the</strong> exchange rate <strong>of</strong> THB 41.9055 per EUR). The long-term loan is expected to be <strong>the</strong> mainsource <strong>of</strong> financing <strong>of</strong> <strong>the</strong> transaction. However, once <strong>the</strong> Company has successfully issued <strong>the</strong>convertible debenture and raised fund from <strong>the</strong> right <strong>of</strong>fering and/or private placement, <strong>the</strong> Company willuse such fund raising to repay <strong>the</strong> long-term loan. The detail <strong>of</strong> <strong>the</strong> each financing alternatives could beillustrated as follows:8.1 Long-term financing(a) Long-term loan from domestic financial institutionThe Company will engage in unsecured long-term loan contract with 3 leading domestic financialinstitutions for <strong>the</strong> total <strong>of</strong> up to THB 15,000 million (equivalent to EUR 358 million at <strong>the</strong> exchange rate <strong>of</strong>THB 41.9055 per EUR). Such loans will have maturities <strong>of</strong> 6 and 8 years;(b) Long-term loan from foreign financial institutionThe Company’s subsidiary will engage in long-term loan contract with 4 leading foreign financialinstitutions in <strong>the</strong> amount <strong>of</strong> EUR 340 million (equivalent to THB 14,248 million at <strong>the</strong> exchange rate THB41.9055 per EUR). Such loans will have maturities <strong>of</strong> 6 and 7 years, and collateral in <strong>the</strong> form <strong>of</strong> shares <strong>of</strong>MWB and its subsidiaries.Page 11
The <strong>Opinion</strong> <strong>of</strong> <strong>the</strong> <strong>Independent</strong> <strong>Financial</strong> <strong>Advisor</strong> on <strong>the</strong> Asset Acquisition <strong>of</strong> Thai Union Frozen Products Plc.8.2 Convertible DebentureThe Company will issue convertible debenture to an investor worth EUR 60 million (equivalent to THB2,514 million at <strong>the</strong> exchange rate <strong>of</strong> THB 41.9055 per EUR) on a private placement basis. The debenturewill have a tenor <strong>of</strong> 4 years from <strong>the</strong> issue date and an annual coupon <strong>of</strong> 5% p.a. and an overall yield <strong>of</strong>8% p.a. unless converted into common shares. The debenture can be converted into common shares atany time after <strong>the</strong> first year at a conversion price <strong>of</strong> THB 46 per share. Such conversion ratio andconversion price are part <strong>of</strong> its terms and conditions that <strong>the</strong> Company agreed with Standard CharteredPrivate Equity Limited.8.3 Rights <strong>of</strong>fering and Private PlacementThe Company will issue 60-65 million new shares to its existing shareholders and institutional investorsthrough rights <strong>of</strong>fering and a private placement to reduce <strong>the</strong> amount <strong>of</strong> long term loans from domesticfinancial institutions.For <strong>the</strong> avoidance <strong>of</strong> any doubt, as and when <strong>the</strong> allotment and subscription <strong>of</strong> convertible debenture to aprivate placement investor is completed which is also conditional to relevant agendas in <strong>the</strong> shareholders’meeting, <strong>the</strong> amount <strong>of</strong> long-term loan from domestic financial institution will be reduced correspondingly.As a result, <strong>the</strong> total amount <strong>of</strong> fund raised from rights <strong>of</strong>fering, <strong>the</strong> private placement and <strong>the</strong> convertibledebenture will be used to reduce <strong>the</strong> amount <strong>of</strong> long term loans from domestic financial institutions.9. Detail <strong>of</strong> Thai Union Frozen Plc.9.1 Nature <strong>of</strong> business operationsThe Company and its subsidiaries engage in manufacturing and distribution <strong>of</strong> frozen and canned seafoodfor export and marketable in Thailand and abroad. Its product includes ready to eat meal and snack suchas canned seafood, frozen seafood, and o<strong>the</strong>r variety <strong>of</strong> ready-to-eat meal and snacks which emphasizeon raw material from seafood. Moreover, <strong>the</strong> Company also engaged in packaging and printing business,domestic marketing, pet food manufacturing, fishing vessel, shrimp farming and nursing and also jointventures in processed fish meat and shrimp food. The Company’s major product is canned frozen tunaloin, which accounted for 41% <strong>of</strong> sales revenue in 2009. In addition, <strong>the</strong> Company has concentration inexport distribution, which represented 91% <strong>of</strong> <strong>the</strong> total sales revenue in 2009.The Company and its subsidiaries business operation are as follows:Type <strong>of</strong> businessProduction and Export <strong>of</strong>frozen and canned foodproductsProduction anddistribution <strong>of</strong> packagingproductsProduction anddistribution <strong>of</strong> animal feedand agricultural productsFood business indomestic marketOversea investmentFishing vesselsDescriptionFrozen tuna loin, canned tuna, canned sardine and mackerel, frozenshrimp, frozen squid, frozen salmon, and o<strong>the</strong>r frozen seafood such ascrab meat shrimp and baby calmSteel and aluminum food packaging products, printing services includingproduct labelsDog and cat food, shrimp and fish feed, distribution <strong>of</strong> aquatic animalfarming products, shrimp farming and nursingManufacturing <strong>of</strong> snack under <strong>the</strong> brand “Fisho” “Dori” and “Pla-Thai”,flavored tuna, tuna sandwich spread and salmon sandwich spread under<strong>the</strong> brand “Sealect”Investment in manufacturer and distributor <strong>of</strong> processed and cannedseafood company and importer and distributor <strong>of</strong> frozen seafood companyDeep sea fishing business such as tuna fishingPage 12
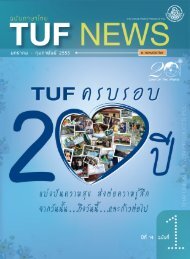
The <strong>Opinion</strong> <strong>of</strong> <strong>the</strong> <strong>Independent</strong> <strong>Financial</strong> <strong>Advisor</strong> on <strong>the</strong> Asset Acquisition <strong>of</strong> Thai Union Frozen Products Plc.Group StructureThai Union Frozen Products Public Company LimitedGroup 1Production and and Export <strong>of</strong> <strong>of</strong> frozenand and canned food productsGroup 2Production and and distribution <strong>of</strong> <strong>of</strong>packaging productsGroup 3Production and and distribution <strong>of</strong> <strong>of</strong>animal feed and and agriculturalproductsGroup 4Food business in in domestic marketGroup 5Oversea investmentGroup 6Fishing vessels90.08%90.50%*51.00%90.00%100.00%100.00%**Thai Union Manufacturing Co., Ltd.Asian-Pacific Can Co., Ltd.Thai Union Feedmill Co., Ltd.T-Holding Co., Ltd.Thai Union International, Inc.Phuket Fishing Co., Ltd.90.44%74.00%95.00%100.00%100.00%**Songkla Canning Co., Ltd.Thai Union Graphic Co., Ltd.Thai Quality Shrimp Co., Ltd.Tri-Union Seafoods, LLC.(Chicken <strong>of</strong> <strong>the</strong> Sea International)Samui Fishing Co., Ltd.51.00%Thai Union Seafood Co., Ltd.99.99%Thai Union Hatchery Co., Ltd.100.00%Empress International, Ltd.100.00%**Phang-nga Fishing Co., Ltd.51.00%*70.00%Tri-Union Frozen Foods, LLC.(Chicken <strong>of</strong> <strong>the</strong> Sea Frozen Foods)Yueh Chyang Canned Food Co., Ltd.100.00%**Songkla Fishing Co., Ltd.100.00%**Siam Fishing Co., Ltd.76.50%PT Juifa International Foods Co., Ltd.25.00% 20.00% 33.33%** 48.97%** 14.99% 50.00%Lucky Unoin Foods Co., Ltd.Biz Dimension Co., Ltd.Moresby International HoldingsTN Fine Chemical Co., Ltd.Avanti Feeds Ltd.Avanti Thai Aqua Feeds Private Ltd.* Investment by Songkla Canning Co., Ltd.** Investment by Thai Union Manufacturing Co., Ltd.Page 13
The <strong>Opinion</strong> <strong>of</strong> <strong>the</strong> <strong>Independent</strong> <strong>Financial</strong> <strong>Advisor</strong> on <strong>the</strong> Asset Acquisition <strong>of</strong> Thai Union Frozen Products Plc.9.2 <strong>Financial</strong> summary and business operation9.2.1 Summary <strong>of</strong> financial statementsSummary <strong>of</strong> <strong>the</strong> Company’s consolidated financial statements for year ended December 31, 2007to December 31, 2009 and 6 months period ended 30 July 2010 are as follows:Unit: THB millionYear ended 31 December(unless stated o<strong>the</strong>rwise) 2007 2008 2009<strong>Financial</strong> status6 monthsperiod ended30 June 2010Total assets 33,575.86 39,781.25 35,869.94 37,213.79Total liabilities 19,006.15 23,550.52 17,459.18 17,842.39Shareholders’ equity 14,569.71 16,230.73 16,331.12 19,371.40Registered and Paid-up capital 878.80 883.17 883.17 883.17Operating performanceRevenue from sales 55,507.13 69,048.12 68,994.49 33,421.28Total revenue 56,072.13 69,518.96 69,697.27 34,023.98Gross pr<strong>of</strong>it 7,575.73 8,757.32 10,446.99 4,907.89Net pr<strong>of</strong>it 1,823.30 2,200.47 3,343.85 1,704.34Basic earning per share (Baht pershare)Cash flow2.07 2.51 3.79 1.93Cash flow from operation (1,651.56) 1,370.75 8,577.730 2,042.67Cash flow from investment (2,454.49) (1,820,98) (2,036.50) (1,216.61)Cash flow from financing 4,119.98 1,506.12 (7,461.10) (1,226.43)<strong>Financial</strong> ratiosCurrent ratio (times) 1.72 1.78 2.01 1.58Gross pr<strong>of</strong>it margin (%) 13.65 12.68 15.14 14.68Net pr<strong>of</strong>it margin (%) 3.28 3.19 4.85 5.10Interest Bearing Debt to Equity ratio(times)9.2.2 Business operationRevenue1.08 1.23 0.75 0.71Total sales for year ended 2007 to 2009 was THB 55,507.13 million, THB 69,048.12 million, and THB68,994.49 million, respectively. Sales in 2008 increased by THB 13,540.99 million from 2007 orequivalent to an increase <strong>of</strong> 24.40% driven by an increase in overall sales especially in sardine andmackerel that grew 100% and tuna product, which is <strong>the</strong> Company’s main products, that surged 48%.Sales in 2009 shrank THB 53.63 million from 2008 or equivalent to a decrease <strong>of</strong> 0.08% due to nogrowth in tuna sales, which is <strong>the</strong> Company’s fundamental product.For first six months <strong>of</strong> 2010, total sales equal THB 33,421.28 million, which decreased from <strong>the</strong> firstsix months <strong>of</strong> 2009 by THB 1,440.14 million or equivalent to a decrease <strong>of</strong> 4.13%, due to <strong>the</strong>appreciation <strong>of</strong> Baht.Gross pr<strong>of</strong>itGross pr<strong>of</strong>it for year ended 2007 to 2009 was THB 7,575.73 million, THB 8,757.32 million, and THB10,446.99 million, respectively. Gross pr<strong>of</strong>it in 2008 increased by THB 1,181.59 million from 2007 orequivalent to an increase <strong>of</strong> 15.60% but gross pr<strong>of</strong>it margin decline from 13.65% in 2007 to 12.68% in2008 due to <strong>the</strong> appreciation <strong>of</strong> Baht and higher price in tuna, packaging, and oil that reduced <strong>the</strong>gross pr<strong>of</strong>it margin. Gross pr<strong>of</strong>it in 2009 rose THB 1,686.54 million from 2008 or equivalent to anincrease <strong>of</strong> 19.29% driven by increase in gain from exchange rate and lower cost <strong>of</strong> sales. Gross pr<strong>of</strong>itPage 14
The <strong>Opinion</strong> <strong>of</strong> <strong>the</strong> <strong>Independent</strong> <strong>Financial</strong> <strong>Advisor</strong> on <strong>the</strong> Asset Acquisition <strong>of</strong> Thai Union Frozen Products Plc.margin rose to 15.14% induced by successful cost management and a higher proportion <strong>of</strong> valueaddedproducts.For first six months <strong>of</strong> 2010, gross pr<strong>of</strong>it equal THB 4,907.89 million or equivalent to a gross pr<strong>of</strong>itmargin <strong>of</strong> 14.68%. Gross pr<strong>of</strong>it decreased from <strong>the</strong> first six months <strong>of</strong> 2009 by THB 6.71 million orequivalent to a decline <strong>of</strong> 0.14%, which is in <strong>the</strong> same level as last year. This was driven by plantrelocation that reduced cost <strong>of</strong> sales.Net pr<strong>of</strong>itNet pr<strong>of</strong>it for year ended 2007 to 2009 was THB 1,823.30 million, THB 2,200.47 million, and THB3,343.85 million, respectively. Net pr<strong>of</strong>it in 2008 increased by THB 377.17 million from 2007 orequivalent to an increase <strong>of</strong> 20.69% driven by higher sales, but net pr<strong>of</strong>it margin fell from 3.28% in2007 to 3.19% in 2008 due to a higher cost <strong>of</strong> raw material. Net pr<strong>of</strong>it in 2009 rose THB 1,143.38million from 2008 or equivalent to a growth <strong>of</strong> 51.96% and net pr<strong>of</strong>it margin in 2009 increased to4.85%, which was driven by successful cost management and stronger operating performances at alllocal subsidiaries.For first six months <strong>of</strong> 2010, net pr<strong>of</strong>it equal THB 1,704.34 million and net pr<strong>of</strong>it margin at 5.94%,which increased from <strong>the</strong> first six months <strong>of</strong> 2009 by THB 96.81 million or equivalent to 6.02% andwhich was induced by lower cost <strong>of</strong> sale and operation.Total assetsTotal assets for year ended 2007 to 2009 was THB 33,575.86 million, THB 39,781.25 million, and THB35,869.94 million, respectively. Total assets in 2008 increased by THB 6,205.39 million or equivalentto an increase <strong>of</strong> 18.48%, which was driven by higher tuna raw material prices and increased stocklevel to support higher sales volume. Total assets in 2009 decreased THB 3,911.31 million orequivalent to 9.83% due to lower tuna raw material and finished good prices and <strong>the</strong> result <strong>of</strong> activeinventory management throughout <strong>the</strong> year.As <strong>of</strong> 30 June 2010, total assets equal THB 37,213.79 million increased THB 1,343.85 million fromend <strong>of</strong> 2009 or equivalent to an increase <strong>of</strong> 3.75%, which was driven by higher inventory and increasein property, plant, and equipment.Total liabilitiesTotal liabilities for year ended 2007 to 2009 was THB 19,006.15 million, THB 23,550.62 million, andTHB 17,459.18 million, respectively. Total liabilities in 2008 increased by THB 4,544.47 million from2007 or equivalent to 23.91%, which was mainly due to higher bank overdrafts and short-term loansfrom financial institution and account payables. Total liabilities in 2009 decreased THB 6,091.44million from 2008 or equivalent to a decrease <strong>of</strong> 25.87% resulted from lower bank overdrafts andshort-term loans from financial institution and decline in trade payables.As <strong>of</strong> 30 June 2010, total liabilities equal THB 17,842.39 million increased THB 383.21 million fromend <strong>of</strong> 2009 or equivalent to a growth <strong>of</strong> 2.20%, which was driven by higher trade payables.Total shareholders’ equityTotal shareholders’ equity for year ended 2007 to 2009 was THB 14,569.71 million, THB 16,230.73million, and THB 16,331.12 million, respectively. Total shareholders’ equity in 2008 increased by THB1,661.02 million from 2007 or equivalent to 11.40%, which was due to higher operating pr<strong>of</strong>it. Totalshareholders’ equity in 2009 rose THB 100.39 million from 2008 or equivalent to an increase <strong>of</strong> 0.62%which was driven by higher operating pr<strong>of</strong>it.As <strong>of</strong> 30 June 2010, total shareholders’ equity equal THB 19,371.40 million grew THB 3,040.28 millionfrom end <strong>of</strong> 2009 or equivalent to an increase <strong>of</strong> 18.62%, which was resulted from higher operatingpr<strong>of</strong>it.Page 15
The <strong>Opinion</strong> <strong>of</strong> <strong>the</strong> <strong>Independent</strong> <strong>Financial</strong> <strong>Advisor</strong> on <strong>the</strong> Asset Acquisition <strong>of</strong> Thai Union Frozen Products Plc.9.2.3 Risk factorsRisk factors that may affect <strong>the</strong> Company’s existing business operations are as follows:Trade barriersRaw material price andprocurementThai seafood operators continued to focus on addressing <strong>the</strong> issue <strong>of</strong>trade barriers that include both tariff and non-tariff measures, <strong>the</strong> latter <strong>of</strong>which have become more prevalent and more stringent. As key tradepartners, such as <strong>the</strong> United States and <strong>the</strong> European Union,incorporated social issues into <strong>the</strong>ir international trade standards.The cost <strong>of</strong> raw materials accounts for about 70 to 80 percent <strong>of</strong> <strong>the</strong>overall production cost. Raw material procurement is <strong>the</strong>refore a majordriver <strong>of</strong> <strong>the</strong> Company’s costs and pr<strong>of</strong>its. Prices <strong>of</strong> most <strong>of</strong> <strong>the</strong>Company’s raw materials fluctuate in accordance with world marketsituations, such as tuna and oil price which affected several cost items,such prices <strong>of</strong> fish raw materials, packaging materials, seasoning ando<strong>the</strong>r ingredientsOperational system Currently <strong>the</strong> Company has extended its investment resulted in 26subsidiaries and associated companies with each being active indifferent business areas. Such diverse collection <strong>of</strong> business operations,while beneficial for <strong>the</strong> mitigation <strong>of</strong> risks arising from businessfluctuations in any given industry, poses a risk associated with ensuringthat all entities operate under harmonized policies aim at generatingsatisfactory returns on investments.<strong>Financial</strong> risks9.3 List <strong>of</strong> managementList <strong>of</strong> directors as <strong>of</strong> 2 August 2553Name1. Mr. Kraisorn Chansiri Chairman2. Mr. Chan Hon Kit Vice ChairmanForeign exchange rates have been relatively volatile and consequentlyimpacted <strong>the</strong> Company business, given <strong>the</strong> fact that over 90% <strong>of</strong> <strong>the</strong>products are shipped to overseas markets and a majority <strong>of</strong> <strong>the</strong> revenuesare recognized in foreign currencies, mostly in U.S. dollar. Therefore,revenues and pr<strong>of</strong>it margins are subject to <strong>the</strong> risk <strong>of</strong> foreign exchangevolatility. In addition, <strong>the</strong> Company will have to take into account <strong>the</strong>change in economies <strong>of</strong> o<strong>the</strong>r countries that would affect investmentfunds, which <strong>the</strong> Company will have to implement a financial policy toaddress risks associated with shifting interest rates.3. Mr. Thiraphong Chansiri President and Director4. Mr. Cheng Niruttinanon Director5. Mr. Chuan Tangchansiri Director6. Mr. Rittirong Boonmechote Director7. Mr. Takeshi Inoue Director8. Mr. Yasuo Goto Director9. Mr. Chan Shue Chung Director10. Mr. Chan Tin King DirectorPosition11. Mr. Sakdi Kiewkarnkha <strong>Independent</strong> Director and Chairman <strong>of</strong> <strong>the</strong> Audit Committee12. Mr. Kiti Pilunthanadiloke <strong>Independent</strong> Director and Audit Committee13. Pol.Maj.Gen. PrachaAnucrokdilok14. Dr. Thamnoon Ananthothai <strong>Independent</strong> Director15. Mr. Kirati Assakul <strong>Independent</strong> DirectorSource: Company<strong>Independent</strong> Director and Audit CommitteePage 16
The <strong>Opinion</strong> <strong>of</strong> <strong>the</strong> <strong>Independent</strong> <strong>Financial</strong> <strong>Advisor</strong> on <strong>the</strong> Asset Acquisition <strong>of</strong> Thai Union Frozen Products Plc.List <strong>of</strong> company’s management as <strong>of</strong> 31 December 2009Name1. Mr. Kraisorn Chansiri Chairman2. Mr. Chan Hon Kit Vice Chairman3. Mr. Thiraphong Chansiri PresidentPosition4. Mr. Rittirong Boonmechote Managing Director Shrimp Product Lines5. Mr. Chan Tin King Chief <strong>Financial</strong> Officer6. Mr. Chan Shue Chung Executive Director and General Manager Fish Product Lines 17. Mr. Praphan Simasanti General Manager Corporate Support8. Mr. Suthidej Amornkasemwong General Manager Fish Product Lines 29. Mr. Peerasak Boonmechote General Manager Shrimp Product Lines10. Mr. Yongyut Setthawiwat Assistant General Manager - Financing11. Mr. Pakkapong Topaisri Assistant General Manager – Business Unit Support andAccounting Manager12. Ms. Somsri Verasaranakij Corporate Finance ManagerSource: Company9.4 Shareholders ListTop-10 Shareholders as <strong>of</strong> 22 March 2010, which holds a combined portion <strong>of</strong> 65.39% <strong>of</strong> <strong>the</strong> totalshares outstanding <strong>of</strong> 833,170,950 sharesName Shares %1. Chansiri Group * 229,887,060 26.032. Niruttinanon Group * 72,280,960 8.183. Mitsubishi Corporation 72,446,900 8.204. Chase Nominee Limited 42 67,628,300 7.665. Thai NVDR Company Limited 25,732,862 2.916. Merrill Lynch International GEF Account Client General 21,571,800 2.447. Social Security Office (2 Cases) 21,463,773 2.438. Boonmechote Group * 29,672,500 3.369. State Street Bank And Trust Company for London 18,792,400 2.1310. Hagoromo Foods Corporation 18,000,000 2.04Source: SETRemark:* The list <strong>of</strong> shareholders under Chansiri Group, Niruttinanon Group, and Boonmechote Group are shown below:No. Group Shares %Chansiri Group1 Mr.Kraisorn Chansiri 80,153,080 9.082 Mr.Thiraphong Chansiri 50,792,160 5.753 Ms.Bussakorn Chansiri 33,984,510 3.854 Mr.Disapol Chansiri 24,896,040 2.825 Ms.Pornnapa Chansiri 22,574,760 2.566 Mr.Dejphon Chansiri 11,422,010 1.297 Mstr. Att Chansiri 4,000,000 0.458 Ms.Tipparut Chansiri 2,064,500 0.23Total <strong>of</strong> Chansiri Group 229,887,060 26.03Niruttinanon GroupPage 17
The <strong>Opinion</strong> <strong>of</strong> <strong>the</strong> <strong>Independent</strong> <strong>Financial</strong> <strong>Advisor</strong> on <strong>the</strong> Asset Acquisition <strong>of</strong> Thai Union Frozen Products Plc.Part 2The Reasonableness to Enter into <strong>the</strong> Transaction1. The Reasons to Enter into <strong>the</strong> Transaction and Benefits <strong>of</strong> <strong>the</strong> TransactionIn pursuit <strong>of</strong> TUF’s long-term business vision to be a global leader in Tuna and ambient seafoodproducer, it is believed that with <strong>the</strong> acquisition <strong>of</strong> MWBrands, this will result in <strong>the</strong> delivery <strong>of</strong> <strong>the</strong>following benefits to <strong>the</strong> Company and its shareholders as follows:1. Opportunity to acquire one <strong>of</strong> <strong>the</strong> leading consumer seafood brands businesses inEurope having a unique combination <strong>of</strong> a vertically integrated business model andleading iconic brands in all <strong>of</strong> its marketsTo become vertically integrated business platform, it is paramount to optimize supply chainand management expertise at each stage as major driver for efficiency <strong>of</strong> business modelcommencing from <strong>the</strong> sourcing and procurement. MWBrands production facilities are locatedin Ghana, Seychelles, regarded as strategically positioned production facilities close to fishinggrounds, landing zones, outbound harbours and can producers resulting in low labour costs,apart from low tax rates from each respective location (Ghana, Seychelles). In addition, withowned fishing license and fleet and long-term supply agreement with local fleets collectivelyup to 72%, this will in large extent help diversify supply risk as well as control <strong>the</strong> security overfish supply as well as provide unique insight into fishing dynamics and its availability and pricedevelopment.In addition to sourcing and procurement and close proximity in all value chains, <strong>the</strong> distributionand logistic networks are centralized in UK and France which are close to major ports <strong>of</strong> entryand easy to access to <strong>the</strong> MWBrands major markets in Europe which help minimizedistribution to all key customers and optimized inventory level.With regards to portfolio <strong>of</strong> market brands, MWBrands two major brands, John West in <strong>the</strong>UK/Ireland/Ne<strong>the</strong>rlands and Petit Navire in France, account for approx 80% <strong>of</strong> its net salesvalue and poise in each respective market. These two brands are <strong>the</strong> category definingbrands in <strong>the</strong>ir respective markets in FY2010, particular UK and France and considered ashigh demand items in <strong>the</strong> major retailers and attract premium price compared to o<strong>the</strong>r brands.This preferred brand status fur<strong>the</strong>r allows MWBrands to pass on to customers pricing flexibilitywhen <strong>the</strong> raw material costs are volatile.2. Opportunity to acquire <strong>the</strong> unique set-up delivering low cost producer status whichstreng<strong>the</strong>ns <strong>the</strong> Company’s reputation as one <strong>of</strong> <strong>the</strong> world’s leading low cost cannedtuna producersMWBrands is poised to position <strong>of</strong> being <strong>the</strong> lowest cost importer <strong>of</strong> tuna in Europe as a directresult <strong>of</strong> its vertically integrated business model aforementioned as well as its strategicproduction facilities located in Ghana and Seychelles which not only provide optimal access totuna but also enable to benefit from low labour costs as well as duty free access to EU inrespect <strong>of</strong> tax tariff. MWBrands features a favorable low cost structure almost comparable to<strong>the</strong> leading low cost countries such as Thailand.3. Opportunity to create anticipated benefits from potential value creation created by <strong>the</strong>combination <strong>of</strong> MWBrands and <strong>the</strong> Company’s businessAs one <strong>of</strong> <strong>the</strong> world’s leading canned tuna producers, <strong>the</strong> Company is poised to exploit <strong>the</strong>unique expertise to ameliorate <strong>the</strong> MWBrands business and financial performance. There arecertain key areas where <strong>the</strong> Company intends to focus on.- Transfer <strong>of</strong> 4 TUF fishing fleets to MWBrands to obtain best utilization <strong>of</strong> its fleetcapacity. Additional catches up to 20,000 tons are envisaged which will in turnaggregate in 45,000 tons capacity for MWBrands.- Yield improvement from processing <strong>of</strong> round tuna to be aligned with current TUF’sprocesses and procedures to improve yield recovery.- Transfer <strong>of</strong> in-house canning facilities instead <strong>of</strong> outsourcing o<strong>the</strong>r canningmanufacturers with marginally additional Capital Expenditure- Centralization and standardization <strong>of</strong> purchase in joint tuna procurement, ingredients,packaging and o<strong>the</strong>r suppliesPage 19
The <strong>Opinion</strong> <strong>of</strong> <strong>the</strong> <strong>Independent</strong> <strong>Financial</strong> <strong>Advisor</strong> on <strong>the</strong> Asset Acquisition <strong>of</strong> Thai Union Frozen Products Plc.3. Impact on dividend payment capabilityDue to <strong>the</strong> new loan facilities provided by a number <strong>of</strong> domestic and foreign financial institutionsarising from this acquisition, certain financial covenants e.g. debt/equity ratio as well as dividendrestrictions are to be imposed by <strong>the</strong>m. Even though <strong>the</strong> dividend policy stipulating <strong>the</strong> distribution <strong>of</strong>dividends to its shareholders at <strong>the</strong> minimum <strong>of</strong> 50% <strong>the</strong> consolidated net pr<strong>of</strong>it, this policy will besubject to certain financial covenants in <strong>the</strong> loan facilities agreement as well. The condition applies toTUF level only.Based on financial covenants on <strong>the</strong> additional financing for <strong>the</strong> Transaction from <strong>the</strong> domesticfinancial institutions, <strong>the</strong> Company will be restricted to pay out <strong>the</strong> dividend not over THB1,200 millionor 50% <strong>of</strong> its respective net pr<strong>of</strong>it each fiscal year, whichever is lower. This restriction, none<strong>the</strong>less willbe released once <strong>the</strong> Company has repaid half <strong>of</strong> its long-term loan and its Debt to EBITDA ratiodrops below 2.5 times for 4 consecutive quarters. The drop in Debt/EBITDA ratio will be fur<strong>the</strong>raccelerated by <strong>the</strong> conversion <strong>of</strong> unsecured convertible debentures up to EUR60 million which permits<strong>the</strong> conversion after <strong>the</strong> first year commencing from <strong>the</strong> issue date. The planned equity injectionenvisaged from <strong>the</strong> remaining portion i.e. 64,655,000 shares in <strong>the</strong> form <strong>of</strong> right <strong>of</strong>ferings and/orprivate placement will also help fur<strong>the</strong>r reduce <strong>the</strong> debt/equity ratio sooner in addition to <strong>the</strong> cash flowfrom operation.Historical 3-year TUF’s Summary <strong>of</strong> Dividend Payout2007 2008 2009EPS (Baht per share) 2.08 2.51 3.79DPS (Baht per share) 1.11 1.26 1.92Dividend payment (Baht mm) 1,078 987 1,431Dividend Payout Ratio 53% 50% 51%Source: Setsmart and <strong>the</strong> Company’s financial statement4. Accounting Impact on <strong>the</strong> Company’s EPS post acquisitionIn <strong>the</strong> aftermath <strong>of</strong> <strong>the</strong> acquisition, <strong>the</strong> Company will hold 100% equity interest in MWBrands which willrequire <strong>the</strong> Company to consolidate <strong>the</strong> MWBrands financial results into <strong>the</strong> Company’s financialstatements. After <strong>the</strong> Transaction, <strong>the</strong> impact on Earnings Per Share (EPS) depends on <strong>the</strong>contribution <strong>of</strong> net pr<strong>of</strong>it from MWBrands and additional interest expenses incurred from acquisitionfinancing. None<strong>the</strong>less, in medium to long-term view, <strong>the</strong> level <strong>of</strong> net income from MWBrands drivenby <strong>the</strong> business initiatives from TUF is likely to outperform <strong>the</strong> impact from interest costs from <strong>the</strong>Transaction. In addition, taking into account <strong>the</strong> whole dilution impact up to 11.7% at maximum <strong>of</strong>post-enlarged shares, <strong>the</strong> dilution will not occur in whole but in sequential basis since <strong>the</strong> conversion<strong>of</strong> <strong>the</strong> convertible debenture could be exercised only after <strong>the</strong> first year <strong>of</strong> issuance which is likely totake place after <strong>the</strong> right <strong>of</strong>fering and private placement.Fur<strong>the</strong>rmore, since <strong>the</strong> <strong>of</strong>fer price defined in <strong>the</strong> form <strong>of</strong> Enterprise Value (EV) is substantially higherthan its book value <strong>of</strong> assets i.e. <strong>the</strong> differential <strong>of</strong> EUR 120.6 million (EUR 680 million in EV and EUR559.4 million in book value <strong>of</strong> assets as <strong>of</strong> 31 March 2010), <strong>the</strong> Company will be required to record <strong>the</strong>goodwill which is <strong>the</strong> difference between <strong>the</strong> acquisition value and book value <strong>of</strong> assets as differentasset items <strong>of</strong> <strong>the</strong> Company. These items may be depreciated or amortized when <strong>the</strong> investment isreappraised (as <strong>the</strong> case may be). Hence, <strong>the</strong> additional depreciation or amortization expenses willreduce <strong>the</strong> net pr<strong>of</strong>it and EPS <strong>of</strong> <strong>the</strong> Company, although such expenses are only non-cash itemswhich will not affect <strong>the</strong> cash flow availability.Page 23
The <strong>Opinion</strong> <strong>of</strong> <strong>the</strong> <strong>Independent</strong> <strong>Financial</strong> <strong>Advisor</strong> on <strong>the</strong> Asset Acquisition <strong>of</strong> Thai Union Frozen Products Plc.3. The Fairness <strong>of</strong> Price <strong>of</strong> TransactionThe IFA evaluates reasonableness <strong>of</strong> <strong>the</strong> transaction price based on several approaches to corporatevaluation. Since TUF will pay consideration to <strong>the</strong> Seller based on <strong>the</strong> Enterprise Value (EV), ourevaluation on <strong>the</strong> fair valuation will be drawn in terms <strong>of</strong> an enterprise value and presented along withspecific merits and limitations cited respective to each <strong>of</strong> our selected approaches. The opinionregarding <strong>the</strong> reasonableness with reference to <strong>the</strong> Transaction Price can be rendered accordingly.Our selected valuation methodologies include <strong>the</strong> following;1. Book Value Approach2. Market Comparable Approach3. Discounted Cash Flows Approach –DCFFor avoidance <strong>of</strong> any doubts, enterprise value is equal to <strong>the</strong> sum <strong>of</strong> <strong>the</strong> market value <strong>of</strong> totalshareholders’ equity and interest-bearing debts minus cash and cash equivalent, reflecting economicvalue collectively claimed by shareholders and creditors as well as minority interest (if any) while <strong>the</strong>remaining amount <strong>of</strong> cash and cash equivalent can be utilized to make repayment <strong>of</strong> outstandingdebts, and/or used to pay out as dividends to <strong>the</strong> acquirer.The IFA has evaluated <strong>the</strong> fair enterprise value <strong>of</strong> MW Brands based on each approach with detailsexplained as <strong>the</strong> following;3.1 Book Value ApproachBook value approach is referred to as <strong>the</strong> amounts carried on a company’s balance sheet, which isprincipally prepared in accordance with <strong>the</strong> historical cost convention <strong>of</strong> accounting standards. Thus,book value <strong>of</strong> total assets from <strong>the</strong> consolidated balance sheet for <strong>the</strong> most recent fiscal year ending31 March 2010 as audited by <strong>the</strong> statutory auditor <strong>of</strong> MWBrands, will be used to determine <strong>the</strong> fairvalue <strong>of</strong> MWBrands under this approach. The valuation result can be set out below;Consolidated <strong>Financial</strong> StatementsFor <strong>the</strong> fiscal year ending 31 March 2010Book Value <strong>of</strong> Total Assets Million EUR 559.4Based on <strong>the</strong> Book Value approach, <strong>the</strong> enterprise value is equal to EUR 559.4 million. However, <strong>the</strong>valuation result respective to Book Value approach should not serve as <strong>the</strong> main approach todetermine <strong>the</strong> fair value <strong>of</strong> MWBrands since it nei<strong>the</strong>r captures <strong>the</strong> company’s earnings potential norreflects a view <strong>of</strong> fair value <strong>of</strong> assets under current economic factors, industry trends and managementdecision.Adjusted Book Value approach has come to mitigate its potential drawback that results mainly from<strong>the</strong> historical cost convention <strong>of</strong> accounting standards since certain adjustments should be introducedas a means <strong>of</strong> incorporating <strong>the</strong> impact <strong>of</strong> <strong>of</strong>f-balance-sheet items and any gain and/or loss in value <strong>of</strong>assets and liabilities against <strong>the</strong> amounts carried on <strong>the</strong> consolidated financial statements. However,due to <strong>the</strong> unavailability <strong>of</strong> recent appraisal report on any <strong>of</strong> MWBrands non-current assets i.e.tangible and intangible assets as well as in part to <strong>the</strong> overseas presence <strong>of</strong> MWBrands, <strong>the</strong> AdjustedBook Value approach is materially constrained and cannot be adopted as an alternative evaluation.3.2 Market Comparable ApproachThis approach evaluates <strong>the</strong> fair value <strong>of</strong> a company on <strong>the</strong> basis that companies principally engagingin similar nature <strong>of</strong> business and products are expected to have similar range <strong>of</strong> price multiples. Assuch, <strong>the</strong> Market Comparable approach is to first identify <strong>the</strong> listed peer group with similarity in terms<strong>of</strong> scale and normal course <strong>of</strong> business operations and <strong>the</strong>n evaluate <strong>the</strong> fair value <strong>of</strong> MWBrands andPage 24
The <strong>Opinion</strong> <strong>of</strong> <strong>the</strong> <strong>Independent</strong> <strong>Financial</strong> <strong>Advisor</strong> on <strong>the</strong> Asset Acquisition <strong>of</strong> Thai Union Frozen Products Plc.thus <strong>the</strong> fair value <strong>of</strong> <strong>the</strong> acquisition price will be calculated based on an average <strong>of</strong> price multiplesrespective to such peer group. The price multiple ratios applied to determining <strong>the</strong> fair value <strong>of</strong>MWBrands under this approach shall include <strong>the</strong> following multiples;3.2.1) Price to Book Value3.2.2) Historical Price to Earnings3.2.3) Forward Price to Earnings3.2.4) Historical Enterprise Value to EBITDA3.2.5) Forward Enterprise Value to EBITDAIdeally, any listed company forming part <strong>of</strong> <strong>the</strong> peer group should have tuna-based product portfolioand engage regionally in <strong>the</strong> seafood market. However, our findings have suggested that no suchcompany listed on <strong>the</strong> Thai bourse is present with <strong>the</strong>se operational characteristics that can trackclosely to <strong>the</strong> business fundamentals <strong>of</strong> MWBrands. Therefore, we include both Thai peers andinternational peers into our analysis. Thai peers in <strong>the</strong> seafood and fish related business are includedto reflect <strong>the</strong> multiples level in Thai market as it is <strong>the</strong> listed stock exchange <strong>of</strong> TUF and internationalpeers in o<strong>the</strong>r international stock exchanges are included to reflect <strong>the</strong> landscape <strong>of</strong> seafood market inEurope representing <strong>the</strong> operating territory <strong>of</strong> MWBrands and o<strong>the</strong>r international market. The list <strong>of</strong>peer group chosen by <strong>the</strong> IFA for <strong>the</strong> evaluation <strong>of</strong> <strong>the</strong> fair enterprise value <strong>of</strong> MWBrands under thisApproach is set out below;Company NameDomestic Peer GroupBloombergTickerCountry Market Cap Main Line <strong>of</strong> ProductsThai Union Frozen Products PCL TUF TB Thailand THB 46,587 Million TunaAsian Seafoods Coldstorage PCL ASIAN TB Thailand THB 1,469 MillionTropical Canning (Thailand) PCL TC TB Thailand THB 1,300 MillionInternational Peer GroupFrozenFish/Shrimp/Shellfish/SquidCanned Tuna ando<strong>the</strong>r seafood productsMarine Harvest ASA MHG NO Norway NOK 17,713 Million SalmonNippon Suisan Kaisha 1332 JT Japan JPY 80,945 MillionDongwon Industries 006040 KS Korea KRW 410,310 MillionPacific Andes 1174 HK Hong Kong HKD 4,013 MillionSource: BloombergFrozen and processedseafood productsFrozen and processedseafood productsFrozen and processedseafood productsIt should be noted that although <strong>the</strong> comparables are collected from <strong>the</strong> peers in <strong>the</strong> different countries,<strong>the</strong> price multiple ratios still could be used as part <strong>of</strong> <strong>the</strong> fair value calculation since it does not affectby <strong>the</strong> difference in <strong>the</strong> currency and exchange rate <strong>of</strong> <strong>the</strong> comparable companies in each countries.The descriptions <strong>of</strong> <strong>the</strong> international peers group are summarized as follows:a. Marine Harvest ASAMarine Harvest ASA, is a Norway-based seafood company. It <strong>of</strong>fers farmed salmon and processedseafood to customers in approximately 70 markets. In addition to fresh and frozen salmon, MarineHarvest <strong>of</strong>fers a range <strong>of</strong> o<strong>the</strong>r products, such as coated seafood, ready-to-eat meals, finger food andsmoked seafood. The company also farms trout and white halibut. Marine Harvest’s operations arestructured in five main business units. MH Norway includes fish farming operations and salesoperations in Norway, comprising Atlantic salmon production and sales, as well as processing facilitiesthat produce fillets. MH Chile includes operations in Chile and in <strong>the</strong> United States, comprising fishfarming and processing facilities. MH Canada and MH Scotland produce and sell Atlantic salmon. MHVAP Europe processes and sells seafood based on Atlantic salmon, whitefish and o<strong>the</strong>r seafood inPage 25
The <strong>Opinion</strong> <strong>of</strong> <strong>the</strong> <strong>Independent</strong> <strong>Financial</strong> <strong>Advisor</strong> on <strong>the</strong> Asset Acquisition <strong>of</strong> Thai Union Frozen Products Plc.<strong>the</strong> European markets. Marine Harvest ASA currently manages a number <strong>of</strong> brands such as TheOrganic Salmon, Donegal Silver Salmon, Kritsen, La Couronne, Pieters, etc.b. Nippon Suisan Kaisha, Ltd.Nippon Suisan Kaisha, Ltd. is a Japan-based company engaged in five business segments. TheMarine Products segment is engaged in fishing, cultivation, processing and sale <strong>of</strong> seafood products.The Food segment manufactures and sells processed food products such as frozen food products andcommon temperature food products, among o<strong>the</strong>rs. The Logistics segment is engaged in <strong>the</strong>refrigeration storage <strong>of</strong> marine products, as well as <strong>the</strong> transportation <strong>of</strong> frozen and chilled products.The Fine Chemical segment manufactures and sells pharmaceuticals, health food and pharmaceuticalmaterials. The O<strong>the</strong>rs segment is engaged in <strong>the</strong> construction and repair <strong>of</strong> ships, as well as <strong>the</strong>marine transportation and engineering business. As <strong>of</strong> March 31, 2010, <strong>the</strong> company had 73subsidiaries and 35 associated companies.c. Dongwon Industries Co., Ltd.Dongwon Industries Co., Ltd. is a Korea-based company engaged in <strong>the</strong> provision <strong>of</strong> marine products.The company operates its business through three divisions: Fisheries division, which catches andtransports tunas and o<strong>the</strong>r marine products; Distribution division, which distributes tuna productsprocessed by <strong>the</strong> company to <strong>the</strong> domestic market, as well as Japan, <strong>the</strong> United States and Europe,and Logistics division, which is engaged in <strong>the</strong> transportation, warehousing, stevedoring andforwarding services.d. Pacific Andes International Holdings LimitedPacific Andes International Holdings Limited, an investment holding company, engages in seafoodprocessing and trading primarily in Hong Kong, <strong>the</strong> People’s Republic <strong>of</strong> China, North America, SouthAmerica, Europe, and East Asia. It also involves in <strong>the</strong> fishing and fishmeal processing; operation <strong>of</strong>fishing vessels; global sourcing; processing on shore and international distribution <strong>of</strong> various frozenseafood products; trading <strong>of</strong> marine fuel; and provision <strong>of</strong> shipping and agency services. In addition,<strong>the</strong> company engages in <strong>the</strong> property holding and provision <strong>of</strong> treasury and administrative services. Itserves wholesalers, reprocessors, food processors, and retailers. The company was founded in 1986and is headquartered in Hong Kong, Hong Kong. Pacific Andes International Holdings Limited is asubsidiary <strong>of</strong> N.S. Hong Investment (BVI) LimitedThe details <strong>of</strong> <strong>the</strong> calculation under each market comparable approach are as follows:3.2.1 Price to Book Value Ratio Approach (P/BV)P/BV approach determines <strong>the</strong> fair value by having MWBrands book value per share from <strong>the</strong>consolidated financial statement as <strong>of</strong> 31 March 2010 multiplied by an average P/BV ratio <strong>of</strong> <strong>the</strong>comparable companies.IFA has calculated <strong>the</strong> average P/BV on <strong>the</strong> different intervals to avoid <strong>the</strong> effect from <strong>the</strong> short-termmovement in <strong>the</strong> market. We have calculated <strong>the</strong> P/BV as at 27 July 2010, which is <strong>the</strong> last tradingday prior to TUF disclosing <strong>the</strong> Transaction information to public as well as previous 30-day, 60-day,90-day, 180-day and 360-day intervals. The calculation <strong>of</strong> <strong>the</strong> average peers’ P/BV multiples areshown below:P/BV ratioAverage P/BV ratio27 July 2010 30-day 60-day 90-day 180-day 360-dayLocal peersThai Union Frozen 2.60 2.41 2.33 2.24 1.99 1.70Asian Seafoods 0.92 0.96 0.93 0.83 0.78 0.60Page 26
The <strong>Opinion</strong> <strong>of</strong> <strong>the</strong> <strong>Independent</strong> <strong>Financial</strong> <strong>Advisor</strong> on <strong>the</strong> Asset Acquisition <strong>of</strong> Thai Union Frozen Products Plc.P/BV ratioAverage P/BV ratio27 July 2010 30-day 60-day 90-day 180-day 360-dayTropical Canning 0.83 0.66 0.60 0.57 0.54 0.43International peersMarine Harvest 1.45 1.39 1.49 1.52 1.52 1.40Nippon Suisan Kaisha 1.30 1.32 1.27 1.26 1.21 1.23Dongwon Industries 1.30 1.37 1.34 1.30 1.30 1.50Pacific Andes 0.73 0.73 0.72 0.77 0.80 0.68Peer GroupAverage P/BVSource: Bloomberg1.30 1.26 1.24 1.21 1.16 1.08The average P/BV ratio derived from <strong>the</strong> above table is in a range <strong>of</strong> 1.08 - 1.30 times. Provided is <strong>the</strong>MWBrands applicable book value <strong>of</strong> EUR 97 million, <strong>the</strong> valuation result under this approach is thuscalculated as follows;Unit: EUR million27 Jul 10 30-day 60-day 90-day 180-day 360-dayAverage Peer Group P/BV 1.30 1.26 1.24 1.21 1.16 1.08Multiply: BV <strong>of</strong> MWBrands as <strong>of</strong> 31/3/10 97.0 97.0 97.0 97.0 97.0 97.0Market value <strong>of</strong> equity 126.3 122.3 120.2 117.5 112.7 104.6Plus: Interest Bearing Debt 295.9 295.9 295.9 295.9 295.9 295.9Deduct: Cash 18.2 18.2 18.2 18.2 18.2 18.2Enterprise Value <strong>of</strong> MWBrands 404.0 400.0 397.9 395.2 390.4 382.3Range <strong>of</strong> fair value under P/BVEUR 382.3 – 404.0 millionFrom above calculation, <strong>the</strong> fair value <strong>of</strong> MWBrands enterprise value under <strong>the</strong> P/BV approach is inrange <strong>of</strong> EUR 382.3-404.0 million. IFA does not recommend using P/BV approach as <strong>the</strong> mainapproach to determine MWBrands fair value as it disregards <strong>the</strong> future performance <strong>of</strong> <strong>the</strong> company.3.2.2 Historical Price to Earnings Ratio Approach (Historical P/E)The fair value <strong>of</strong> MWBrands under Historical P/E approach can be determined using MWBrandsearnings per share as <strong>of</strong> 31 March 2010 multiplied by an average Historical P/E ratio <strong>of</strong> <strong>the</strong>comparable companies.IFA has calculated <strong>the</strong> average Historical P/E <strong>of</strong> peers group on <strong>the</strong> different intervals to avoid <strong>the</strong>effect from <strong>the</strong> short-term movement in <strong>the</strong> market. We have calculated <strong>the</strong> Historical P/E as at 27July 2010, which is <strong>the</strong> last trading day prior to TUF disclosing <strong>the</strong> Transaction information to public aswell as previous 30-day, 60-day, 90-day, 180-day and 360-day intervals. The calculation <strong>of</strong> <strong>the</strong>average peers’ Historical P/E multiples are shown belowLocal peersHistoricalAverage Historical P/E ratioP/E Ratio27 July 2010 30-day 60-day 90-day 180-day 360-dayThai Union Frozen 12.00 11.15 10.76 10.37 9.57 8.91Asian Seafoods 11.71 12.26 11.86 10.66 10.37 7.00Page 27
The <strong>Opinion</strong> <strong>of</strong> <strong>the</strong> <strong>Independent</strong> <strong>Financial</strong> <strong>Advisor</strong> on <strong>the</strong> Asset Acquisition <strong>of</strong> Thai Union Frozen Products Plc.HistoricalP/E RatioAverage Historical P/E ratio27 July 2010 30-day 60-day 90-day 180-day 360-dayTropical Canning 11.05 8.71 8.00 7.54 6.67 4.98International peersMarine Harvest 6.97 8.89 10.14 10.72 25.10* 35.22*Nippon Suisan Kaisha 1,835.44* 1,856.54* 1,791.56* 1,774.61* 1,774.61* 1,525.28*Dongwon Industries 5.55 5.85 5.74 5.57 5.57 6.93Pacific Andes 4.71 4.71 4.67 4.98 5.64 4.92Peer Group AverageHistorical P/E8.67 8.60 8.53 8.31 7.56 6.55Source: Bloomberg, numbers marked with (*) are excluded from calculation due to being excessively high and considered<strong>the</strong> outliner.The average Historical P/E ratio derived from <strong>the</strong> above table is in a range <strong>of</strong> 6.55 – 8.67 times.Provided is <strong>the</strong> MWBrands net pr<strong>of</strong>it as <strong>of</strong> 31 March 2010 <strong>of</strong> EUR 36.6 million, <strong>the</strong> valuation resultunder this approach is thus calculated as <strong>the</strong> following;Unit: EUR million27 Jul 10 30-day 60-day 90-day 180-day 360-dayAverage Peer Group Historical P/E 8.67 8.60 8.53 8.31 7.56 6.55Multiply: MWBrands net pr<strong>of</strong>itas <strong>of</strong> 31/3/1036.6 36.6 36.6 36.6 36.6 36.6Market value <strong>of</strong> equity 317.2 314.6 312.1 304.0 276.9 239.7Plus: Interest Bearing Debt 295.9 295.9 295.9 295.9 295.9 295.9Deduct: Cash 18.2 18.2 18.2 18.2 18.2 18.2Enterprise Value <strong>of</strong> MWBrands 594.9 592.3 589.8 581.7 554.6 517.4Range <strong>of</strong> fair value under HistoricalP/E ApproachEUR 517.4 – 594.9 millionFrom above calculation, <strong>the</strong> fair enterprise value <strong>of</strong> MWBrands under <strong>the</strong> Historical P/E approach is ina range <strong>of</strong> EUR 517.4 – 594.9 million. However, IFA viewed that <strong>the</strong> valuation from Historical P/Eapproach may not be appropriate to use as <strong>the</strong> main approach to determine fair valuation since <strong>the</strong>calculation <strong>of</strong> <strong>the</strong> fair valuation base solely on <strong>the</strong> performance in <strong>the</strong> specific period which may notrepresent <strong>the</strong> long-term future pr<strong>of</strong>itability <strong>of</strong> <strong>the</strong> company. In addition, <strong>the</strong> calculation under thisapproach does not take into account <strong>of</strong> control premium, brand value possession and long-termmanagement decision to reflect on-going pr<strong>of</strong>itable capacity. Therefore, we recommend not usingHistorical P/E to be <strong>the</strong> main approach to determine <strong>the</strong> fair valuation <strong>of</strong> MWBrands.3.2.3 Forward Price to Earnings Ratio Approach (Forward P/E)Similar to <strong>the</strong> Historical P/E Approach, <strong>the</strong> Forward P/E Approach calculates <strong>the</strong> fair enterprise value<strong>of</strong> MWBrands using <strong>the</strong> net pr<strong>of</strong>it <strong>of</strong> MWBrands and <strong>the</strong> average multiples <strong>of</strong> its peers. However, TheForward P/E Approach use <strong>the</strong> forecasted net pr<strong>of</strong>it <strong>of</strong> MWBrands to multiply with <strong>the</strong> averageForward P/E <strong>of</strong> <strong>the</strong> comparable companies.IFA has calculated <strong>the</strong> average Forward P/E <strong>of</strong> peers group on <strong>the</strong> different intervals to avoid <strong>the</strong>effect from <strong>the</strong> short-term movement in <strong>the</strong> market. We have calculated <strong>the</strong> Forward P/E as at 27 July2010, which is <strong>the</strong> last trading day prior to TUF disclosing <strong>the</strong> Transaction information to public as wellas previous 30-day, 60-day, 90-day, 180-day and 360-day intervals. The calculation <strong>of</strong> <strong>the</strong> averagepeers’ Forward P/E multiples are shown belowPage 28
The <strong>Opinion</strong> <strong>of</strong> <strong>the</strong> <strong>Independent</strong> <strong>Financial</strong> <strong>Advisor</strong> on <strong>the</strong> Asset Acquisition <strong>of</strong> Thai Union Frozen Products Plc.Forward P/E RatioAverage Forward P/E ratio27 July 2010 30-day 60-day 90-day 180-day 360-dayLocal peersThai Union Frozen 11.03 10.16 9.83 9.45 8.74 8.16Asian Seafoods n/a n/a n/a n/a n/a n/aTropical Canning n/a n/a n/a n/a n/a n/aInternational peersMarine Harvest 7.86 7.64 8.32 8.88 9.48 9.64Nippon Suisan Kaisha 18.11 19.34 19.68 19.74 18.65 20.48Dongwon Industries 5.57 5.71 5.66 5.58 5.51 4.95Pacific Andes 5.95 5.96 5.88 5.88 5.88 5.88Peer Group AverageForward P/ESource: Bloomberg9.70 9.76 9.87 9.91 9.65 9.82The average Forward P/E ratio derived from <strong>the</strong> above table is in a range <strong>of</strong> 9.65 – 9.91 times.Provided is <strong>the</strong> MWBrands forecasted net pr<strong>of</strong>it for FY2011 <strong>of</strong> EUR 40.0 million, <strong>the</strong> valuation resultunder this approach is thus calculated as <strong>the</strong> following (The details <strong>of</strong> financial projection prepared by<strong>the</strong> IFA can be referred to in Section 3.3 Discounted Cash Flows Approach);Unit: EUR million27 Jul 10 30-day 60-day 90-day 180-day 360-dayAverage Peer Group Forward P/E ratio 9.70 9.76 9.87 9.91 9.65 9.82Multiply: MWBrands forecasted net pr<strong>of</strong>it 40.0 40.0 40.0 40.0 40.0 40.0<strong>of</strong> FY2011Market value <strong>of</strong> equity 388.2 390.5 394.9 396.2 386.0 392.8Plus: Interest Bearing Debt 295.9 295.9 295.9 295.9 295.9 295.9Deduct: Cash 18.2 18.2 18.2 18.2 18.2 18.2Enterprise Value <strong>of</strong> MWBrands 665.9 668.2 672.6 673.9 663.7 670.5Range <strong>of</strong> fair value underForward P/E ApproachEUR 663.7 – 673.9 millionFrom above calculation, <strong>the</strong> fair enterprise value <strong>of</strong> MWBrands under <strong>the</strong> Forward P/E approach is ina range <strong>of</strong> EUR 663.7 – 673.9 million. However, IFA viewed that <strong>the</strong> valuation from Forward P/Eapproach may not be appropriate to use as <strong>the</strong> main approach to determine fair valuation sincealthough it take into account <strong>of</strong> <strong>the</strong> future pr<strong>of</strong>itability, it is based solely on <strong>the</strong> performance in <strong>the</strong>specific period which may not represent <strong>the</strong> long-term future pr<strong>of</strong>itability <strong>of</strong> <strong>the</strong> company. In addition,<strong>the</strong> calculation under this approach also does not take into account <strong>of</strong> control premium, brand valuepossession and long-term management decision to reflect on-going pr<strong>of</strong>itable capacity. Therefore, werecommend not using Forward P/E to be <strong>the</strong> main approach to determine <strong>the</strong> fair valuation <strong>of</strong>MWBrands.3.2.4 Historical Enterprise Value to Earnings before Interest, Tax, Depreciations andAmortizations Ratio (Historical EV/EBITDA)The Historical EV/EBITDA approach calculates MWBrands fair enterprise valuation by multiplying <strong>the</strong>company’s <strong>the</strong> most updated earnings before interest, tax, depreciations and amortizations (EBITDA)with an average Historical EV/EBTIDA ratio <strong>of</strong> <strong>the</strong> comparable companies.Page 29
The <strong>Opinion</strong> <strong>of</strong> <strong>the</strong> <strong>Independent</strong> <strong>Financial</strong> <strong>Advisor</strong> on <strong>the</strong> Asset Acquisition <strong>of</strong> Thai Union Frozen Products Plc.Again, IFA has calculated <strong>the</strong> average Historical EV/EBITDA on <strong>the</strong> different intervals to avoid <strong>the</strong>effect from <strong>the</strong> short-term movement in <strong>the</strong> market. We have calculated <strong>the</strong> Historical EV/EBITDA asat 27 July 2010, which is <strong>the</strong> last trading day prior to TUF disclosing <strong>the</strong> Transaction information topublic as well as previous 30-day, 60-day, 90-day, 180-day and 360-day intervals. The calculation <strong>of</strong><strong>the</strong> average peers’ Historical EV/EBITDA multiples are shown below:Local peersHistoricalEV/EBITDAAverage Historical EV/EBITDA ratioRatio27 July 2010 30-day 60-day 90-day 180-day 360-dayThai Union Frozen 10.20 9.65 9.42 9.18 8.53 7.75Asian Seafoods 10.76 10.95 10.83 10.36 9.55 7.77Tropical Canning 6.94 5.60 5.20 4.99 4.88 4.53International peersMarine Harvest 6.94 6.84 7.23 7.48 8.32 7.73Nippon Suisan Kaisha 12.13 12.13 12.13 12.20 12.81 13.51Dongwon Industries 7.13 7.13 7.13 7.13 7.11 5.92Pacific Andes 7.09 7.09 7.08 7.07 6.75 6.64Peer Group AverageHistorical EV/EBITDASource: Bloomberg8.74 8.48 8.43 8.34 8.28 7.69The average Historical EV/EBITDA ratio derived from <strong>the</strong> above table is in a range <strong>of</strong> 7.69 – 8.74times. The valuation result under Historical EV/EBITDA approach is calculated by <strong>the</strong> following:27 Jul 10 30-day 60-day 90-day 180-day 360-dayAverage Peer Group Historical 8.74 8.48 8.43 8.34 8.28 7.69EV/EBITDAMultiply: MWBrands EBITDAas <strong>of</strong> 31 March 201082.8 82.8 82.8 82.8 82.8 82.8Enterprise Value <strong>of</strong> MWBrands 723.7 702.3 698.1 690.7 685.6 636.8Range <strong>of</strong> fair value underHistorical EV/EBITDA ApproachEUR 636.8 – 723.7 millionFrom above calculation, <strong>the</strong> fair value <strong>of</strong> MWBrands enterprise value is in a range <strong>of</strong> EUR 636.8 –723.7 million. IFA has <strong>the</strong> opinion that <strong>the</strong> Historical EV/EBITDA approach has mitigate some biasunder P/E approach i.e. <strong>the</strong> Historical EV/EBITDA approach will not be distorted by <strong>the</strong> difference ininvestment level <strong>of</strong> <strong>the</strong> company as <strong>the</strong> ratio is calculated on EBITDA which is <strong>the</strong> earning beforedepreciation and amortization. However, IFA still has <strong>the</strong> opinion <strong>the</strong> Historical EV/EBITDA still hassome limitation to evaluate <strong>the</strong> fair enterprise value MWBrands in this Transaction since it does nottaken into account <strong>of</strong> control premium, brand value possession and long-term management decisionto reflect on-going pr<strong>of</strong>itable capacity. Therefore, we recommend not using Historical EV/EBITDA tobe <strong>the</strong> main approach to determine <strong>the</strong> fair valuation <strong>of</strong> MWBrandsPage 30
The <strong>Opinion</strong> <strong>of</strong> <strong>the</strong> <strong>Independent</strong> <strong>Financial</strong> <strong>Advisor</strong> on <strong>the</strong> Asset Acquisition <strong>of</strong> Thai Union Frozen Products Plc.3.2.5 Forward Enterprise Value to Earnings before Interest, Tax, Depreciations andAmortizations Ratio (Forward EV/EBITDA)Similar to Historical EV/EBITDA Approach, <strong>the</strong> Forward EV/EBITDA approach calculates MWBrandsfair enterprise valuation by multiplying <strong>the</strong> company’s forecasted EBITDA for FY2011 with an averageForward EV/EBTIDA ratio <strong>of</strong> <strong>the</strong> comparable companies.Again, IFA has calculated <strong>the</strong> average Forward EV/EBITDA on <strong>the</strong> different intervals to avoid <strong>the</strong>effect from <strong>the</strong> short-term movement in <strong>the</strong> market. We have calculated <strong>the</strong> Forward EV/EBITDA as at27 July 2010, which is <strong>the</strong> last trading day prior to TUF disclosing <strong>the</strong> Transaction information to publicas well as previous 30-day, 60-day, 90-day, 180-day and 360-day intervals. The calculation <strong>of</strong> <strong>the</strong>average peers’ Forward EV/EBITDA multiples are shown below:Local peersForwardEV/EBITDAAverage Forward EV/EBITDA ratioRatio27 July 2010 30-day 60-day 90-day 180-day 360-dayThai Union Frozen 9.02 8.52 8.35 8.10 7.62 7.30Asian Seafoods n/a n/a n/a n/a n/a n/aTropical Canning n/a n/a n/a n/a n/a n/aInternational peersMarine Harvest 5.95 5.78 6.13 6.45 6.79 6.84Nippon Suisan Kaisha 11.63 12.20 12.20 12.20 12.20 12.20Dongwon Industries 6.75 7.23 7.50 7.66 7.82 6.64Pacific Andes n/a n/a n/a n/a n/a n/aPeer Group AverageForward EV/EBITDASource: Bloomberg8.34 8.43 8.54 8.60 8.61 8.25The average Forward EV/EBITDA ratio derived from <strong>the</strong> above table is in a range <strong>of</strong> 8.25 – 8.61 times.Provided is <strong>the</strong> MWBrands forecasted EBITDA for FY2011 <strong>of</strong> EUR 84.9 million, <strong>the</strong> valuation resultunder this approach is thus calculated as <strong>the</strong> following (The details <strong>of</strong> financial projection prepared by<strong>the</strong> IFA can be referred to in Section 3.3 Discounted Cash Flows Approach);27 Jul 10 30-day 60-day 90-day 180-day 360-dayAverage Peer Group Forward 8.34 8.43 8.54 8.60 8.61 8.25EV/EBITDAMultiply: MWBrands forecasted EBITDA 84.9 84.9 84.9 84.9 84.9 84.9for FY2011Enterprise Value <strong>of</strong> MWBrands 707.7 716.0 725.4 730.4 730.7 700.1Range <strong>of</strong> fair value underForward EV/EBITDA ApproachEUR 700.1- 730.7 millionFrom above calculation, <strong>the</strong> fair value <strong>of</strong> MWBrands enterprise value is in range <strong>of</strong> EUR 700.1- 730.7million. Compared to o<strong>the</strong>r ratio under <strong>the</strong> Market Comparable Approach, <strong>the</strong> Forward EV/EBITDA isconsidered to be <strong>the</strong> most appropriate method to evaluate <strong>the</strong> fair value <strong>of</strong> MWBrands since it doesnot be distorted by <strong>the</strong> difference in investment level <strong>of</strong> <strong>the</strong> company as <strong>the</strong> effect <strong>of</strong> <strong>the</strong> differentdepreciation and amortization expense level and also represent <strong>the</strong> future cash flow <strong>of</strong> <strong>the</strong> company.Page 31
The <strong>Opinion</strong> <strong>of</strong> <strong>the</strong> <strong>Independent</strong> <strong>Financial</strong> <strong>Advisor</strong> on <strong>the</strong> Asset Acquisition <strong>of</strong> Thai Union Frozen Products Plc.However, IFA still has <strong>the</strong> opinion that <strong>the</strong> Forward EV/EBITDA still has some limitation to evaluate <strong>the</strong>fair enterprise value MWBrands since it base solely on <strong>the</strong> performance in <strong>the</strong> specific period anddoes not take into account <strong>of</strong> control premium, brand value possession and long-term managementdecision to reflect ongoing pr<strong>of</strong>itable capacity. Therefore, we also do not recommend using ForwardEV/EBITDA to be <strong>the</strong> main approach to determine <strong>the</strong> fair valuation <strong>of</strong> MWBrandsSummary <strong>of</strong> Market Comparable ApproachIn summary, IFA is in <strong>the</strong> opinion that <strong>the</strong> market comparable approach should not be used as <strong>the</strong>main approach to evaluate <strong>the</strong> fair value <strong>of</strong> MWBrands since <strong>the</strong> market approach may have <strong>the</strong>limitation in evaluation <strong>of</strong> <strong>the</strong> MWBrands acquisition due to <strong>the</strong> rationale as follows:• Control premium - Market Comparable approach estimates <strong>the</strong> value <strong>of</strong> a business on <strong>the</strong>minority basis which may not suit with MWBrands acquisition as TUF plans to acquire all <strong>of</strong> itsshares to become major shareholders. In o<strong>the</strong>r words, <strong>the</strong> valuation from this approach doesnot reflect control premium <strong>of</strong> <strong>the</strong> acquisition.• Brand value - MWBrands is <strong>the</strong> leading seafood producer which has <strong>the</strong> strong brandposition in several Europe markets so valuation calculated from <strong>the</strong> Market ComparableApproach may not reflect this since <strong>the</strong> comparable companies used as part <strong>of</strong> calculationhave <strong>the</strong> different market position and may not illustrate <strong>the</strong> strong brand values.• Based solely on <strong>the</strong> single period performance – Under current MWBrands business plan,<strong>the</strong> performance <strong>of</strong> MWBrands is expected to improve significantly over <strong>the</strong> forecasted periodssince MWBrands has been in <strong>the</strong> midst <strong>of</strong> conducting <strong>the</strong> business initiatives evidenced by <strong>the</strong>improvement in margin during FY2007A – FY2010A and <strong>the</strong> plan will be solidified and carriedon during <strong>the</strong> forecasting horizons. Therefore, using <strong>the</strong> historical or one future periodperformance under Market Approach to evaluate <strong>the</strong> fair value <strong>of</strong> MWBrands may not fullyreflect <strong>the</strong> genuine value <strong>of</strong> <strong>the</strong> company and reflect long-term management decision.3.3 Discounted Cash Flows ApproachThe essence <strong>of</strong> Discounted Cash Flows (DCF) approach is based on business fundamentals as wellas cash-generating potentials in <strong>the</strong> future. The IFA has recommended <strong>the</strong> Discounted Free CashFlows to Firm (FCFF) to be used as <strong>the</strong> main approach to determining <strong>the</strong> fair value <strong>of</strong> MWBrandsbecause it is reflective <strong>of</strong> future business operations and pr<strong>of</strong>itability as well as potential outlook inaccordance with management decisions over <strong>the</strong> long run. In order to proceed with this approach, aseries <strong>of</strong> relevant FCFFs must be projected in connection with MWBrands for future years that span a3-year horizon and cover <strong>the</strong> fiscal year ending 31 March 2011 up to 31 March 2013. The terminalvalue is also included as an integral part <strong>of</strong> FCFF computation on <strong>the</strong> underlying assumption thatMWBrands shall operate as a going concern, which is in turn altoge<strong>the</strong>r discounted by <strong>the</strong> weightedaverage cost <strong>of</strong> capital (WACC). As a consequence, <strong>the</strong> present value <strong>of</strong> expected FCFFs will be inprincipal harmony with <strong>the</strong> enterprise value and require no fur<strong>the</strong>r adjustments since it is <strong>the</strong> measure<strong>of</strong> FCFF per se that represents economic value in <strong>the</strong> form <strong>of</strong> net cash available to all individualcreditors and shareholders.It should be noted that <strong>the</strong> IFA has been faced with certain limitation due to no direct physical accessto examine MWBrands and face-to-face interview and due diligence with <strong>the</strong> MWBrands management.None<strong>the</strong>less, <strong>the</strong> IFA believes that <strong>the</strong> Company has worked extensively with <strong>the</strong> management <strong>of</strong>MWBrands on discussing and exploring insightful knowledge <strong>of</strong> MWBrands historical performance,product portfolio, current operational and financial aspects <strong>of</strong> business activities as well as <strong>the</strong> level <strong>of</strong>exposure to change in economic conditions and its future business plan. Such information concerningMWBrands and additional specific information collected from management interview with <strong>the</strong>Company have been provided by <strong>the</strong> Company and subsequently reviewed and modified by <strong>the</strong> IFA,which in turn constitutes <strong>the</strong> basis for facilitating our due diligence and constructing financial projectionunder this context. Since <strong>the</strong> accuracy <strong>of</strong> financial projection depends primarily on <strong>the</strong> precision andreasonableness <strong>of</strong> <strong>the</strong> underlying assumptions, all <strong>the</strong> information obtained should reflect <strong>the</strong> view <strong>of</strong>managerial decisions in specific connection with MWBrands normal course <strong>of</strong> business operations in<strong>the</strong> long run. Should <strong>the</strong>re by any changes in economic factors beyond <strong>the</strong> time being, businessPage 32
The <strong>Opinion</strong> <strong>of</strong> <strong>the</strong> <strong>Independent</strong> <strong>Financial</strong> <strong>Advisor</strong> on <strong>the</strong> Asset Acquisition <strong>of</strong> Thai Union Frozen Products Plc.operations and assumptions stated in this report may change and <strong>the</strong> valuation result will differaccordingly.Brief History <strong>of</strong> MWBrandsMWBrands is a vertically integrated group <strong>of</strong> companies manufacturing and distributing a broad range<strong>of</strong> seafood products such as tuna, salmon, mackerel, sardines and o<strong>the</strong>r seafood and related valueaddedproducts across <strong>the</strong> European region. A substantial portion <strong>of</strong> total product portfolio is marketedunder its own leading iconic brands, namely Petit Navire and H. Parmentier in France, John West in<strong>the</strong> UK, <strong>the</strong> Ne<strong>the</strong>rlands and Ireland and Mareblu in Italy. Until recently, MWBrands has decided topush forward a number <strong>of</strong> restructuring initiatives at <strong>the</strong> factory and marketing level in strategicattempts to foster a feasible platform not only to sustain a status <strong>of</strong> low-cost producer but also to seek<strong>the</strong> uncharted waters through de-commoditization and superiority branding. Such breakthroughinitiatives, which has already been implemented in phases and will continue as an essential ingredient<strong>of</strong> MWBrands future business plan, will be referred to consistently along with additional details if any <strong>of</strong><strong>the</strong>m is considered a relevant factor as we are going through each <strong>of</strong> <strong>the</strong> underlying assumptions. Itshould be noted that details <strong>of</strong> underlying assumptions and related explanations are constrained inscope <strong>of</strong> disclosure due in large part to <strong>the</strong> aforementioned dynamics <strong>of</strong> bidding process that involve asubstantial level <strong>of</strong> confidentiality among <strong>the</strong> involved parties. However, <strong>the</strong> IFA is <strong>of</strong> an opinion that<strong>the</strong> level <strong>of</strong> following disclosure regarding underlying assumptions used for financial projection issufficient to a satisfactory extent that <strong>the</strong> rationale behind each assumption can be comprehended byand large.3.3.1 Discount Cash Flow Approach (Pre-Synergy)1. RevenueRevenue from commercial net sales is a function <strong>of</strong> quantities sold and average selling price per unit,given <strong>the</strong> nature <strong>of</strong> manufacture-based business. In this regard, <strong>the</strong> underlying assumptions set out forsale volume and average selling price will be elaborated separately so as to comprehend <strong>the</strong>mechanism <strong>of</strong> key driving forces that rest with managerial decisions and strategies <strong>of</strong> MWBrands.Total Sale VolumeThe historical volume was 91.3 thousand tons in FY2009A with marginal growth <strong>of</strong> 1.3% to be 92.5thousand tons in FY2010A. During <strong>the</strong> forecast period, it is assumed that <strong>the</strong> total sale volume willrange from 96.3 – 117.4 thousand tons during FY2011F-2013F with a 3-year CAGR <strong>of</strong> 8.3% perannum due to <strong>the</strong> explanations below.Total sale volume growth is expected to persist positively over <strong>the</strong> forecast period. It should be notedthat such expected growth rates are different from those achieved in past fiscal years due to anevidence <strong>of</strong> improved macroeconomic factors and MWBrands initiatives driven at <strong>the</strong> marketing level.In 2009, Europe as a regional economy (27 countries) witnessed a contraction <strong>of</strong> 4.2% in real termdue to financial crisis that spread adverse impacts on both investments and household expenditures.However, according to <strong>the</strong> European Union, real GDP is expected to come back to positive territorywith estimated growth <strong>of</strong> 1.0% in 2010 and accelerate to 1.7% in 2011. On <strong>the</strong> o<strong>the</strong>r hand, MWBrandshas put into actions over <strong>the</strong> normal course <strong>of</strong> business operations during FY2009A-2010A <strong>the</strong>restructuring initiatives aimed at enhancing overall pr<strong>of</strong>itability through better product and channel mix.Discontinuation <strong>of</strong> some low-margin product items was first in forces and caused sale volume to dropas an initial consequence. MWBrands struggled with loss <strong>of</strong> sale volume as an initial consequence.The situation however did not last long as MWBrands was making progress towards premiumizationand dynamization. A stream <strong>of</strong> new innovative products has been gradually launched and sold for apremium price under its leading brands, bringing potential growth in sale volume that more than <strong>of</strong>fset<strong>the</strong> initial impact <strong>of</strong> sale losses.All in all, it’s believed that negative sale volume growth recorded in FY2009A and <strong>the</strong> slight rebound inFY2010A resulted mainly from <strong>the</strong> compound effect <strong>of</strong> economic difficulties at <strong>the</strong> time and itsPage 33
The <strong>Opinion</strong> <strong>of</strong> <strong>the</strong> <strong>Independent</strong> <strong>Financial</strong> <strong>Advisor</strong> on <strong>the</strong> Asset Acquisition <strong>of</strong> Thai Union Frozen Products Plc.restructuring initiatives. The management <strong>of</strong> MW Brand is <strong>of</strong> <strong>the</strong> view that <strong>the</strong> restructuring initiativesplus <strong>the</strong> effect <strong>of</strong> economic recovery will cause sale volume to ramp up especially for its major marketsin <strong>the</strong> subsequent years.Average Selling PriceAverage selling price blended and consequently achieved in respect to all individual product items andto comprehensive markets mainly covered by MWBrands rose around 8% to EUR 4.7 / Kg inFY2009A and <strong>the</strong>n remained stable throughout FY2010A. For <strong>the</strong> forecast period, <strong>the</strong> average sellingprice is assumed to be stable which is <strong>the</strong> same pattern as evidenced during FY2010A.For avoidance <strong>of</strong> any doubt, such average selling price results from <strong>the</strong> net sale value per Kg blendedfrom all different angles including 1.) product categories i.e. tuna, salmon, mackerel, sardines, o<strong>the</strong>rseafood products and value-added product from tuna, 2.) geographic markets i.e. France, <strong>the</strong> UK, Italy,Ireland and <strong>the</strong> Ne<strong>the</strong>rlands as well as 3.) segmentations i.e. branded and private label sector.However, for <strong>the</strong> detailed financial projection, <strong>the</strong> IFA has considered <strong>the</strong> relevant market factors and<strong>the</strong> selling price separately so as to take account <strong>of</strong> structural differences in <strong>the</strong> dynamics andcharacteristics <strong>of</strong> each product category and market MWBrands is actively involved.Differences in competitive environment cause pricing strategies to vary not only within seafoodproduct portfolio but also across <strong>the</strong> countries MWBrands have participated. Any increase in prices didnot necessarily reflect a surge in sale volume <strong>of</strong> premium products as it would have resulted simplyfrom responsive attempts to pass incremental cost <strong>of</strong> raw materials to customers in <strong>the</strong> market. Undernormal circumstances, still a wealth <strong>of</strong> leading brand equity and bargaining power claimed over largenetwork <strong>of</strong> retail distribution outlets is respected for being a key to exercising price raises in <strong>the</strong> longrun.As an overall seafood industry, <strong>the</strong> trend <strong>of</strong> average selling price is expected to remain under strongcompetitive pressures and <strong>the</strong>refore go ra<strong>the</strong>r over <strong>the</strong> foreseeable period. However, as previouslymentioned regarding its restructuring initiatives in <strong>the</strong> area <strong>of</strong> product mix, MWBrands is also keen onmaintaining regular advertising campaigns in order to reinforce brand awareness and support organicsale growth by and large. Specifically, <strong>the</strong> budget allocated to such marketing expenditures will bemore concentrated in <strong>the</strong> markets MWBrands has yet to establish firm and scalable position. Hence,<strong>the</strong> maintenance <strong>of</strong> marketing expenditures at <strong>the</strong> center <strong>of</strong> revitalization program will provide a roomfor MWBrands to have a better control over its premium pricings, particularly for its leading collection<strong>of</strong> branded products.O<strong>the</strong>r RevenuesRevenue from commercial net sales as referred to above constitute <strong>the</strong> main source <strong>of</strong> income toMWBrands. In addition, it should be noted that <strong>the</strong>re is additional revenue flows resulting from salesand exports handled directly by its main production facilities in <strong>the</strong> Seychelles and Ghana. Such o<strong>the</strong>rrevenues rose by 13.6% from EUR 10.3 million in FY2008A to EUR 11.7 million in FY2009A anddeclined by 6.0% to EUR 11.0 million in FY2010A, accounting for 2-3% <strong>of</strong> revenue from commercialnet sales with reference to MWBrands historical performance posted during FY2009A-2010A.For our projection, o<strong>the</strong>r revenues will grow from <strong>the</strong> actual result posed in FY2010A with a CAGR <strong>of</strong>27.1% p.a. ranging from EUR 16.5 – 22.6 million during FY2011F-2013F and represent around 3-4%<strong>of</strong> revenue from commercial net sales over <strong>the</strong> next three years <strong>of</strong> forecast period. Such future trend isprojected in anticipation that <strong>the</strong> main production facilities in <strong>the</strong> Seychelles and Ghana would be ableto derive more economic value from <strong>the</strong>ir scraps.2. Cost <strong>of</strong> Goods SoldAs a vertically integrated group <strong>of</strong> companies with primary focus placed on a variety <strong>of</strong> seafoodproducts, MWBrands shall incur costs and related expenses all along each step <strong>of</strong> <strong>the</strong> supply chain forPage 34
The <strong>Opinion</strong> <strong>of</strong> <strong>the</strong> <strong>Independent</strong> <strong>Financial</strong> <strong>Advisor</strong> on <strong>the</strong> Asset Acquisition <strong>of</strong> Thai Union Frozen Products Plc.its normal course <strong>of</strong> business operations, starting from fishing and cold storage to canning andprocessing line <strong>of</strong> productions.Total cost <strong>of</strong> goods sold can be categorized into <strong>the</strong> followings:• Direct raw material including fish costs and non-fish costs consisting <strong>of</strong> ingredients, packagingand direct labour costs. Fish costs account for approximately 40% <strong>of</strong> total cost <strong>of</strong> goods sold• O<strong>the</strong>r overheads include logistics, co-packing costs and indirect labour cost as well asdepreciation expensesTotal cost <strong>of</strong> goods sold decreased by 13.1% from EUR 372.6 million in FY2008A to EUR 323.8million in FY2009A and decreased again by 3.5% to EUR 312.5 million in FY2010A. For our financialprojection, total cost <strong>of</strong> goods sold is expected to grow from <strong>the</strong> actual result posted in FY2010A with aCAGR <strong>of</strong> 9.8% over <strong>the</strong> next three years <strong>of</strong> forecast period, amounting from EUR 331.7 – 413.2 millionduring FY2011F-2013F.Since tuna is considered <strong>the</strong> flagship product item to MWBrands, any upward movement <strong>of</strong> price paidfor raw tuna i.e. Skipjack and Yellowfin would significantly hurt pr<strong>of</strong>itability and vice versa. The pricingcycle <strong>of</strong> raw tuna holds an inverse relationship with tuna availability, which is after all subject toclimatic El Nino phenomenon. After <strong>the</strong> previous hit recorded in 1998, <strong>the</strong> natural effect <strong>of</strong> El Nino hadrevisited in <strong>the</strong> Indian Ocean and gave rise to a dramatic increase in raw tuna price worldwide during2007-2008. The situation <strong>of</strong> supply shortages eased <strong>of</strong>f and sent raw tuna price down to <strong>the</strong> level seenbefore such El Nino effect in 2007. In regard to our financial projection, raw fish costs per ton areprojected to grow consecutively for at least 3% per annum. Incorporating upward trend <strong>of</strong> raw fishcosts reflects conservative perception towards <strong>the</strong> cyclical ups and downs in tuna supplies. On <strong>the</strong>o<strong>the</strong>r hand, non-fish costs including labor, o<strong>the</strong>r ingredients and packaging are also projected to growin line with sale volume over <strong>the</strong> forecast period.3. Selling, General and Administrative ExpensesThe Selling, General and Administrative Expenses (SG&A) are those associated mainly with humanresources and sale supportive activities such as warehousing and merchandising. SG&A expensesdecreased by 14.7% from EUR 48.9 million in FY2008A to EUR 41.7 million in FY2009A and roseconsiderably by 13.7% to EUR 47.4 million in FY2010A as a combined result <strong>of</strong> increasing marketingexpenditures and one-time expenses related to <strong>the</strong> transitional effect <strong>of</strong> MWBrands restructuringinitiatives, representing 10-11% <strong>of</strong> revenue from commercial net sales. For our projection, SG&Aexpenses will expand from <strong>the</strong> actual result posted in FY2010A with a CAGR <strong>of</strong> 5.3% per annum andrepresent approximately 10% <strong>of</strong> revenue from commercial net sales, equivalent to EUR 46.6 – 55.4million during FY2011F-2013F.MWBrands implementation <strong>of</strong> restructuring initiatives was also visible in <strong>the</strong> amount <strong>of</strong> SG&Aexpenses incurred during FY2009A-2010A. Advertising campaigns through various media platformswere increasingly adopted to reinforce its leading brands and support growth in new product mix. Suchmarketing expenditures, which form a key component <strong>of</strong> SG&A expenses, as well as selling anddistribution expenses are forecasted to continue and expand in proportion to revenue from commercialnet sales. In addition, general and administrative expenses are also forecasted to grow as <strong>the</strong>y reflectchange in compensation scheme for overall employees and additional buildup <strong>of</strong> sale forces for newgeographic expansion.4. Capital ExpendituresCapital Expenditures are referred to as <strong>the</strong> amount <strong>of</strong> money spent for investments in non-currentassets so that MWBrands can continue business operations as a going concern and go in line with <strong>the</strong>future business plan. Such capital expenditures as incurred by MWBrands equaled EUR 8.0 million inFY2009A and EUR 12.0 million in FY2010A, accounting for 2-3% <strong>of</strong> revenue from commercial netsales. Based on future business plan, MWBrands has set aside budget for ongoing capitalinvestments in order to continue its implementation <strong>of</strong> restructuring initiatives in <strong>the</strong> area <strong>of</strong> productionPage 35
The <strong>Opinion</strong> <strong>of</strong> <strong>the</strong> <strong>Independent</strong> <strong>Financial</strong> <strong>Advisor</strong> on <strong>the</strong> Asset Acquisition <strong>of</strong> Thai Union Frozen Products Plc.facilities. Such planned capital expenditures will be primarily aimed at cost savings through moreintegrated infrastructure and improved efficiencies as well as continuous maintenance <strong>of</strong> qualitycontrol in order to stay up to date with evolving certifications and requirements imposed by differentcustomers.For our financial projection, capital expenditures will increase from <strong>the</strong> actual result posted inFY2010A with a CAGR <strong>of</strong> 6.3% per annum over <strong>the</strong> next three years <strong>of</strong> forecast period, equivalent toEUR 14.4 -17.6 million. It should be noted that excess production capacity is still available, particularlyin <strong>the</strong> Seychelles, to facilitate future growth without additional cash burden.5. Working Capital RequirementsThe underlying assumptions set for working capital requirements are reflected in terms <strong>of</strong> cash cycle,which is a function <strong>of</strong> key business activity ratios including average collection period, averageinventory period and average payment period. Based on historical performance during FY2008A-2010A, <strong>the</strong> projected cash cycle is approximately 104 days throughout <strong>the</strong> forecast period related to<strong>the</strong>ir respective sale and purchase amount.In addition to trade account receivables, inventories and trade account payables, o<strong>the</strong>r payables arealso added as part <strong>of</strong> working capital needed to carry on operations as a going concern because o<strong>the</strong>rpayables result mainly from related tax and payroll charges.6. Corporate Income TaxSince MWBrands establishes operational presence in various countries with each having different taxrates, <strong>the</strong> IFA has employed <strong>the</strong> effective tax rate achieved for <strong>the</strong> most recent fiscal year ending 31March 2010. This effective tax rate is equal to 23.4% and will be kept constant for evaluation purpose.7. Debts and Associated CostInterest-bearing debts approximates EUR 296 million as <strong>of</strong> <strong>the</strong> most recent fiscal year ending 31March 2010, representing 75.3% <strong>of</strong> total capital employed by MWBrands. On <strong>the</strong> o<strong>the</strong>r hand, <strong>the</strong>underlying assumption set to determine associated cost <strong>of</strong> debts reflects <strong>the</strong> expected change inMWBrands capital structure once it has been acquired by <strong>the</strong> Company. Thus, <strong>the</strong> IFA has considered<strong>the</strong> relevant interest rate in connection with target capital structure and arrived at <strong>the</strong> associated cost<strong>of</strong> debts equal to 5.4% at <strong>the</strong> post transaction.8. Discount RateFor <strong>the</strong> benefit <strong>of</strong> conservative approach, <strong>the</strong> IFA has adopted <strong>the</strong> discount rate derived solely from<strong>the</strong> context <strong>of</strong> Thai economy where <strong>the</strong> Company is principally engaged even though MWBrands islocated in Europe. This is mainly attributable to <strong>the</strong> multiple market exposures where MWBrands isinvolved in as well as its non-listed status, which after all makes it difficult to select <strong>the</strong> comparablebourse coupled with low risk premium from <strong>the</strong> developed market relative to <strong>the</strong> Thai market.Under <strong>the</strong> DCF approach, a series <strong>of</strong> expected FCFFs over <strong>the</strong> forecast period shall be discountedusing <strong>the</strong> weighed average cost <strong>of</strong> capital (WACC).WACC can be calculated in accordance with <strong>the</strong> conventional formula as shown below;Weighted Average Cost <strong>of</strong> Capital (WACC) = (D/V)*Kd*(1-T) + (E/V)*KeWhere: D/V = The ratio <strong>of</strong> current interest-bearing debt to total invested capital <strong>of</strong>MWBrands, which equals 75.3%E/V = The ratio <strong>of</strong> total shareholders’ equity to total invested capital <strong>of</strong>MWBrands, which equals 24.7%Page 36
The <strong>Opinion</strong> <strong>of</strong> <strong>the</strong> <strong>Independent</strong> <strong>Financial</strong> <strong>Advisor</strong> on <strong>the</strong> Asset Acquisition <strong>of</strong> Thai Union Frozen Products Plc.Cost <strong>of</strong> Equity (Ke)T = The corporate income tax rate applicable to MWBrands, which isdetermined as <strong>the</strong> most recent effective tax rate <strong>of</strong> 23.4%Kd = Associated cost <strong>of</strong> interest-bearing debts at <strong>the</strong> post transaction, whichequals 5.4%Ke = Cost <strong>of</strong> total shareholder’s equity estimated by <strong>the</strong> Capital Asset PricingModel (CAPM) as shown belowCost <strong>of</strong> equity is calculated by <strong>the</strong> CAPM equation as <strong>the</strong> following;Cost <strong>of</strong> Equity (Ke) = Rf + (Rm – Rf) * BetaWhere: Rf = The risk-free rate derived from <strong>the</strong> 10-year government bond yield,which equals 3.4% as at 27 July 2010 based on <strong>the</strong> Thai Bond MarketAssociationRm = The average return expected from <strong>the</strong> market can be calculated as acapital weighted average <strong>of</strong> <strong>the</strong> internal rate <strong>of</strong> return over allcompanies listed in <strong>the</strong> Stock Exchange <strong>of</strong> Thailand, which equals16.0% as at 27 July 2010 based on BloombergBeta = The average beta <strong>of</strong> selected peer groupCompanyBetaThai Union Frozen Products PCL. 0.60Asian Seafoods Coldstorage PCL 0.68Seafresh Industry PCL 0.89Surapon Foods PCL 0.67Kiang Huat Sea Gull Trading Frozen Food PCL 0.32Tropical Canning (Thailand) PCL 0.39Source: BloombergBetaBeta is calculated by <strong>the</strong> following process(i) Calculation <strong>of</strong> average unlevered beta <strong>of</strong> <strong>the</strong> selected peer groupThe equity raw beta <strong>of</strong> comparable companies including TUF, ASIAN, CFRESH, SSF, CHOTI and TCwill be used to calculate average unleveraged beta. The IFA has included only domestic peer groupfrom Agribusiness and Food & Beverage sector, which are particularly related to seafood market, in<strong>the</strong> calculation. The unlevered beta could be calculated with <strong>the</strong> following formula:Unleveraged Beta (β U ) =Leveraged Beta (β L ) / {1 + ((1 – tax rate) * D/E ratio)}CompanyTax Debt to Leveraged UnleveragedRate Equity Equity Beta Equity BetaThai Union Frozen Products PCL. 30% 0.64 0.60 0.42Asian Seafoods Coldstorage PCL 30% 1.52 0.68 0.33Seafresh Industry PCL 30% 0.00 0.89 0.89Surapon Foods PCL 30% 0.19 0.67 0.59Kiang Huat Sea Gull Trading Frozen Food PCL 30% 0.00 0.32 0.32Tropical Canning (Thailand) PCL 30% 0.34 0.39 0.31Average 30% 0.45 0.59 0.48Source: Bloomberg(ii) Calculation <strong>of</strong> levered beta <strong>of</strong> <strong>the</strong> companyAfter obtaining <strong>the</strong> average <strong>of</strong> unleveraged equity beta <strong>of</strong> comparable companies at 0.48 from (i), weutilize such figure to calculate <strong>the</strong> company’s leveraged beta with <strong>the</strong> following formula;Leveraged Beta (β L ) = Unleveraged Beta (β U ) * {1 + ((1 – tax rate)* Target D/E ratio)}Page 37
The <strong>Opinion</strong> <strong>of</strong> <strong>the</strong> <strong>Independent</strong> <strong>Financial</strong> <strong>Advisor</strong> on <strong>the</strong> Asset Acquisition <strong>of</strong> Thai Union Frozen Products Plc.With <strong>the</strong> above formula, <strong>the</strong> leveraged beta calculated from <strong>the</strong> effective tax rate <strong>of</strong> 23.4% and targetdebt-to-equity ratio at 2.8 times will result in <strong>the</strong> leveraged beta equal to 1.50 which will be use as aproxy <strong>of</strong> MWBrands beta to calculate cost <strong>of</strong> equity.The IFA employs target D/E ratio, which is calculated from average interest-bearing debts over <strong>the</strong>next 7 years after <strong>the</strong> transaction, in leverage beta calculation since it represents long-term optimalcapital structure <strong>of</strong> company.According to <strong>the</strong> above table, <strong>the</strong> leveraged beta will be used as a basis for calculating <strong>the</strong> cost <strong>of</strong>equity with reference to WACC and <strong>the</strong> CAPM model as per aforementioned. The result <strong>of</strong>computation for WACC and CAPM is summarized in <strong>the</strong> following table;Risk Free Rate (Rf) 3.4%Market Return (Rm) 16.0%Beta (β L ) 1.5Cost <strong>of</strong> Equity (Ke) 22.3%Equity Weight (We) 24.7%Cost <strong>of</strong> Debt (Kd) 5.4%Debt Weight (Wd) 75.3%Weighted Average Cost <strong>of</strong> Capital (WACC) 8.6%8.) Terminal ValueThe IFA has calculated <strong>the</strong> terminal value so as to represent <strong>the</strong> fair value outstanding after <strong>the</strong>forecast period. In this case, <strong>the</strong> amount <strong>of</strong> FCFF generated during FY2013F, which is <strong>the</strong> last year <strong>of</strong>forecast period, is used as <strong>the</strong> proxy for long-term free cash flows in <strong>the</strong> long run.Terminal Value = FCFF * (1+g) / (WACC-g)Where FCFF = MWBrands Free Cash Flows to Firmg = long-term growth rate assumed to be 1.0% p.a.WACC = MWBrands Weighted Average Cost <strong>of</strong> Capital, which is equal to 8.6% p.a.A summary <strong>of</strong> valuation result with reference to <strong>the</strong> underlying assumptions set to determine a series<strong>of</strong> expected FCFFs as well as <strong>the</strong> calculation <strong>of</strong> WACC is illustrated in <strong>the</strong> following table;(EUR Million) 2011E 2012E 2013EEBITDA after tax 1/ 68.4 75.0 85.0Change in Working Capital -7.3 -13.2 -10.6Capital Expenditures -17.6 -17.3 -14.4Free Cash Flow to Firm (FCFF) 43.4 44.5 60.0Present Value <strong>of</strong> FCFF 129.8Present Value <strong>of</strong> Terminal Value 647.7Fair Enterprise Value 777.5Note: 1/Figures are derived from information and related assumptions obtained from <strong>the</strong> Company, which isconsequently verified through management interview with <strong>the</strong> Company and reviewed and adjusted by <strong>the</strong> IFAdeemed appropriateFrom <strong>the</strong> formulas and assumptions above, <strong>the</strong> calculated fair enterprise value <strong>of</strong> MWBrands equalsEUR 777.5 million and represents economic value in <strong>the</strong> form <strong>of</strong> net cash available to all individualcreditors and shareholders after all reinvestments.Sensitivity AnalysisAs <strong>the</strong> valuation result based on <strong>the</strong> DCF approach depends largely on several key underlyingassumptions, sensitivity analysis has been conducted to measure how sensitive <strong>the</strong> fair value will beto each respective assumption. Hence, by varying incremental percentage change in sale volume,WACC and long-term growth rate, <strong>the</strong> analysis results in <strong>the</strong> following range <strong>of</strong> enterprise value;Page 38
The <strong>Opinion</strong> <strong>of</strong> <strong>the</strong> <strong>Independent</strong> <strong>Financial</strong> <strong>Advisor</strong> on <strong>the</strong> Asset Acquisition <strong>of</strong> Thai Union Frozen Products Plc.Fair EnterpriseSensitivity Range Value (EURmillion)1. Incremental percentage change in sale volume -10.0% up to +10.0% 764.3 - 790.82. Long-term growth rate 0.0% - 2.0% 702.3 - 875.53. WACC 7.5% - 9.5% 762.8 - 796.5Based on <strong>the</strong> sensitivity analysis as presented above, taking into account <strong>the</strong> intersected area <strong>of</strong>sensitivity range for <strong>the</strong>se factors by adjusting overall sale volume in both upward and downwarddirection for an incremental 10%, varying long-term growth rate and WACC from 0.0% to 2.0% andfrom 7.5% to 9.5% respectively, <strong>the</strong> appropriate enterprise value <strong>of</strong> MWBrands calculated from <strong>the</strong>Discount Cash Flow Approach (Pre-Synergy) falls in a range <strong>of</strong> EUR 702.3 – 875.5 million.3.3.2 Discount Cash Flow Approach (Post-Synergy)Potential Synergies Contribution at <strong>the</strong> Post TransactionThe fair enterprise value resulting from DCF approach as demonstrated in details all above is basedon <strong>the</strong> underlying business fundamentals and future earnings attributable to MWBrands as a standalonegroup <strong>of</strong> companies at <strong>the</strong> pre transaction. In o<strong>the</strong>r words, <strong>the</strong> fair enterprise value evaluatedfrom <strong>the</strong> aforementioned discount cash flow approach does not take into consideration any synergy oreconomic benefits that may arise at <strong>the</strong> post transaction from MWBrands by which <strong>the</strong> Companywould have attempted strategic acquisition <strong>of</strong> <strong>the</strong> whole company and gained spontaneous access toabsolute majority control over both directorship and managerial decisions.Due to <strong>the</strong> fact that <strong>the</strong> Company and MWBrands are generally respected for being one <strong>of</strong> <strong>the</strong> world’sleading seafood producers, once united as one larger group <strong>of</strong> companies, <strong>the</strong> Company is poised tobring about opportunities to manage and use <strong>the</strong> combined pool <strong>of</strong> economic resources to strategicadvantage <strong>of</strong> creating an enhanced business model. There are five major areas <strong>of</strong> possibleimprovements in operational aspect that <strong>the</strong> Company has an intention to focus on;1.) Optimization <strong>of</strong> fleet management: <strong>the</strong> Company plans to consolidate its fishing fleet withthat <strong>of</strong> MWBrands under <strong>the</strong> same management. Such mobilization <strong>of</strong> resources is expected tobring in additional economic benefits. Once completed, <strong>the</strong> post-enlarged capacity could be upto 45,000 tons per annum.2.) Yield improvement: Expertise in processing raw tuna contributed by <strong>the</strong> Company would helpimprove efficiencies in terms <strong>of</strong> enhanced yield recovery.3.) Relocation <strong>of</strong> canning facilities: Canning facilities currently operated under <strong>the</strong> management<strong>of</strong> <strong>the</strong> Company could be made on transfer to MWBrands. The process is expected to helpMWBrands improve pr<strong>of</strong>itability through lower cost <strong>of</strong> direct raw materials.4.) Centralization and standardization <strong>of</strong> procurement process: The Company foresees <strong>the</strong>opportunity to reduce its non-fish raw material cost by centralize and standardize itsprocurement process5.) Stronger sale forces: Via <strong>the</strong> Company’s sales network in <strong>the</strong> European area, it should yieldadditional sales without significant cannibalization due to different markets between brandedmarket and private label.Referring to <strong>the</strong> aforementioned economic benefits that could be envisaged at <strong>the</strong> post transaction,<strong>the</strong> Company’s and MWBrands management team are <strong>of</strong> <strong>the</strong> view that <strong>the</strong>se five major areas <strong>of</strong>operational improvements could lead to an additional EBITDA contribution <strong>of</strong> at least EUR 10 millionper annum by FY2013F. For conservative approach, <strong>the</strong> IFA incorporates <strong>the</strong> net impact <strong>of</strong> synergisticcontributions available up to EUR 10 million p.a. at post transaction with ceteris paribus and applies<strong>the</strong> same WACC and terminal growth. The following valuation result based on DCF approach can beillustrated below;Page 39
The <strong>Opinion</strong> <strong>of</strong> <strong>the</strong> <strong>Independent</strong> <strong>Financial</strong> <strong>Advisor</strong> on <strong>the</strong> Asset Acquisition <strong>of</strong> Thai Union Frozen Products Plc.(EUR Million) 2011E 2012E 2013EEBITDA after Tax 1/ 76.1 82.7 92.7Change in Working Capital -7.3 -13.2 -10.6Capital Expenditures -17.6 -17.3 -14.4Free Cash Flow to Firm (FCFF) 51.1 52.2 67.7Present Value <strong>of</strong> FCFF 150.2Present Value <strong>of</strong> Terminal Value 730.4Fair Enterprise Value 880.5Note: 1/Figures are derived from information and related assumptions obtained from <strong>the</strong> Company, which isconsequently verified through management interview with <strong>the</strong> Company and reviewed and adjusted by <strong>the</strong> IFAdeemed appropriateReferring to <strong>the</strong> above summary, <strong>the</strong> fair enterprise value that has incorporated <strong>the</strong> net impact <strong>of</strong>synergies at <strong>the</strong> post transaction will amount to EUR 880.5 million. Sensitivity analysis conducted tomeasure <strong>the</strong> result <strong>of</strong> change in underlying assumptions at post transaction is provided below;Fair EnterpriseSensitivity Range Value (EURmillion)1. Incremental percentage change in sale volume -10.0% up to +10.0% 867.4 – 893.92. Long-term growth rate 0.0% - 2.0% 795.7 – 991.03. WACC 7.5% - 9.5% 863.9 – 902.0Taking into account <strong>the</strong> intersection <strong>of</strong> resulting enterprise value based on such sensitivity range, <strong>the</strong>appropriate enterprise value <strong>of</strong> MWBrands calculated with <strong>the</strong> net impact <strong>of</strong> synergies at posttransaction falls in a range <strong>of</strong> EUR 795.7 – 991.0 million.3.4 O<strong>the</strong>r Method - Precedent Transactions ApproachPrecedent transactions can serve as ano<strong>the</strong>r basis for determining <strong>the</strong> fair value <strong>of</strong> MWBrands. Suchmethodology is put into action by comparing past comparable merger & acquisition transactionscarried out specifically in <strong>the</strong> regional seafood market. A summary <strong>of</strong> precedent transactions is set outbelow;Date <strong>of</strong>AnnouncementAcquiringCompanyTarget CompanyIndustryTransactionValue(EUR Million)EV/EBITDA(Time) *Dec-99 Bolton Group Saupiquet (France) Seafood 206 7.7Mar-02 Industri Kapital Labeyrie SA (France) Seafood 209 8.6Feb-04 Connors Bros Bumble Bee (US) Seafood 550 19.7Jan-06 Capvest Findus (UK) Frozen Food 550 11.4Heinz's Seafood BusinessFeb-06LBMB (France) Seafood 425 8.9Apr-06 Pan Fish Fjord Seafood (Norway) Seafood 799 9.5Jul-06 Premier Foods Campbell Soup Co. (UK) Canned Food 665 8.3Oct-06 Permira Iglo Birds Eye (UK) Frozen Food 1,653 8.8Nissin FoodNov-06Products Myojo Foods (Japan) Canned Food 198 8.9Dec-06 Maruha Group Inc Nichiro Corp (Japan) Seafood 775 14.7Jul-08 Lion Capital Food Vest Group (UK) Seafood 1,447 9.0Jul-08 Dongwon Starkist (US) Seafood 230 7.0Sep-08 Centre Partners Connors Bros (Canada) Seafood 464 7.7Sep-08 Austevoll Seafood Leroy Seafood (Norway) Seafood 633 10.5Page 40
The <strong>Opinion</strong> <strong>of</strong> <strong>the</strong> <strong>Independent</strong> <strong>Financial</strong> <strong>Advisor</strong> on <strong>the</strong> Asset Acquisition <strong>of</strong> Thai Union Frozen Products Plc.Date <strong>of</strong>AnnouncementAcquiringCompanyTarget CompanyIndustryTransactionValue(EUR Million)EV/EBITDA(Time) *Jul-09 Pinnacle Food Birds Eye Foods (US) Frozen Food 867 9.1Jul-10 Permira Findus (Italy) Frozen Food 805 9.1Jul-10 Lion Capital Picard Surgeles (France) Frozen Food 1,500 9.3Source: Factset, Capital IQ, Thompson and Press release* The ratio <strong>of</strong> Enterprise value to EBITDA prior to <strong>the</strong> acquisition dateSummary <strong>of</strong> Precedent Transaction Comparables Mean MedianEV/EBITDA Ratio 9.9 9.0The mean and median for EV/EBITDA ratio resulting from <strong>the</strong> selected precedent transactioncomparables as shown above equal 9.9 and 9.0 times respectively. Such ratio is relatively highercompared to <strong>the</strong> EV/EBITDA ratio under MWBrands acquisition transaction at 8.21 times historicalEBITDA.However, since <strong>the</strong> final price and respective EV/EBITDA ratio settled between seller and buyer andannounced to <strong>the</strong> public domain may reflect various factors specific to <strong>the</strong> context <strong>of</strong> each particulartransaction such as industry background, business model, structure <strong>of</strong> <strong>the</strong> vehicle and method <strong>of</strong>acquisition, <strong>the</strong> size <strong>of</strong> interest being sought and ability to access <strong>the</strong> majority control over <strong>the</strong> targetcompany. Thus, <strong>the</strong> IFA is <strong>of</strong> <strong>the</strong> view that <strong>the</strong> precedent transaction comparables should not be usedas <strong>the</strong> main approach to determining <strong>the</strong> fair enterprise value <strong>of</strong> MWBrands.Page 41
The <strong>Opinion</strong> <strong>of</strong> <strong>the</strong> <strong>Independent</strong> <strong>Financial</strong> <strong>Advisor</strong> on <strong>the</strong> Asset Acquisition <strong>of</strong> Thai Union Frozen Products Plc.Table Comparative Summary <strong>of</strong> <strong>the</strong> Enterprise Value Appraised under Various Valuation ApproachesValuation Approach Appraised Price Premium (Discount) <strong>of</strong> <strong>the</strong> Appropriateness <strong>Independent</strong> <strong>Financial</strong> <strong>Advisor</strong>’s view(EUR million) transaction price (%)1. Book Value Approach 559.4 21.6% Limitation This approach has limitation since it does not reflectfuture pr<strong>of</strong>itability capacity and market value <strong>of</strong>operating assets as <strong>the</strong>y are recorded at cost.2. Market ComparablesApproach2.1 P/BV Approach 382.3-404.0 68.3% - 77.9% Limitation This method has limitation since it disregards <strong>the</strong> futureperformance <strong>of</strong> <strong>the</strong> company2.2 Historical P/E Approach 517.4 – 594.9 14.3% - 31.4% Limitation This method has limitation since it is based solely on <strong>the</strong>performance in <strong>the</strong> specific period, does not take intoaccount <strong>of</strong> control premium, brand value and long-termmanagement decision.2.3 Forward P/E Approach 663.7 – 673.9 0.9% - 2.5% Limitation This method is better than Historical P/E approach sinceit use <strong>the</strong> forecasted performance as part <strong>of</strong> evaluation.However, it still has <strong>the</strong> same limitation as Historical P/Eapproach i.e. it is based solely on <strong>the</strong> performance in<strong>the</strong> specific period, does not take into account <strong>of</strong> controlpremium, brand value and long-term managementdecision.2.4 Historical EV/EBITDAApproach636.8 – 723.7 (6.0%) – 6.8% Limitation This method normally is appropriate since it does notaffect by <strong>the</strong> different depreciation and amortizationpr<strong>of</strong>ile between <strong>the</strong> peers group. However, it still have<strong>the</strong> limitation in this case since it base solely on <strong>the</strong>performance in <strong>the</strong> specific period, does not take intoaccount <strong>of</strong> control premium, brand value and long-term2.5 Forward EV/EBITDAApproachmanagement decision.700.1 - 730.7 (6.9%) – (2.9%) Limitation This method also does not affect by <strong>the</strong> differentdepreciation and amortization pr<strong>of</strong>ile between <strong>the</strong> peersgroup and incorporate future performance intocalculation. However, it has limitation in this case sinceit is based solely on <strong>the</strong> performance in <strong>the</strong> specificperiod, does not take into account <strong>of</strong> control premium,brand value and long-term management decision.Page 42
The <strong>Opinion</strong> <strong>of</strong> <strong>the</strong> <strong>Independent</strong> <strong>Financial</strong> <strong>Advisor</strong> on <strong>the</strong> Asset Acquisition <strong>of</strong> Thai Union Frozen Products Plc.Valuation Approach3.. Discounted Cash FlowApproach (Pre-Synergy)4. Discounted Cash FlowApproach (Post-Synergy)Appraised Price(EUR million)Premium (Discount) <strong>of</strong> <strong>the</strong>transaction price (%)Appropriateness <strong>Independent</strong> <strong>Financial</strong> <strong>Advisor</strong>’s view702.3 – 875.5 (22.3%) – (3.2%) Appropriate This method is appropriate as it reflects future businessoperation, control premium, brand value as well aspotential outlook in line with management decisions inlong-term basis.795.7 – 991.0 (31.4%) – (14.5%) Appropriate This method reflects <strong>the</strong> value from future businessoperation including potential synergies from <strong>the</strong>improvement in MWBrands post transaction from TUF.However, albeit <strong>the</strong> appropriateness by nature <strong>of</strong> DCF,<strong>the</strong> approach taking potential synergies may not beused as optimal range to determine <strong>the</strong> fair valuation.Ra<strong>the</strong>r, it will be used as long-term target value.Page 43
The <strong>Opinion</strong> <strong>of</strong> <strong>the</strong> <strong>Independent</strong> <strong>Financial</strong> <strong>Advisor</strong> on <strong>the</strong> Asset Acquisition <strong>of</strong> Thai Union Frozen Products Plc.The above valuation result could be summarized into graphical form as follow:Summary <strong>of</strong> Valuation Optimal rangeDCF (Post-Synergy)Acquisition Price EUR 680 mm795.7 991.0MethodDCF (Pre-Synergy)Forward EV/EBITDAHistorical EV/EBITDAForward PERHistorical PER702.3 875.5700.1 730.7636.8 723.7663.7 673.9517.4 694.9Historical P/BVBook Value382.3 404.0559.4Optim al RangeEUR 702.3 - 875.5 mmEUR Million200 300 400 500 600 700 800 900 1,000From <strong>the</strong> summary table and graph above, we have contemplated <strong>the</strong> optimal range <strong>of</strong> fairacquisition value <strong>of</strong> MWBrands based on comparison with our valuation results derived byvarious methodologies in which <strong>the</strong> <strong>Independent</strong> <strong>Financial</strong> <strong>Advisor</strong> have <strong>the</strong> opinion as follows:• The Discounted Cash flow (Pre-Synergy) approach is <strong>the</strong> most appropriate methodologiesto determine <strong>the</strong> fair value <strong>of</strong> MWBrands in <strong>the</strong> Transaction since it reflect both (i) controlpremium and (ii) brands value and <strong>the</strong> long-term business value from management decision- Control premium: TUF will acquire 100% shares in MWBrands and DCF approach is <strong>the</strong>best approach to capture <strong>the</strong> value on <strong>the</strong> majority basis since it takes into account <strong>of</strong>potential cash flow generated to <strong>the</strong> major shareholders.- Brands Value and <strong>the</strong> long-term business value from management decision: DCFapproach can reasonably illustrate <strong>the</strong> business competency as well as futureperformance resulting from value <strong>of</strong> <strong>the</strong> long-term management decision and <strong>the</strong>revenue generating capacity from MWBrands market position.• For Discount Cash Flow (Post-Synergy) approach should be considered as <strong>the</strong> potentialupside value <strong>of</strong> MWBrands after <strong>the</strong> acquisition. However, since such synergy still subjectto future implementation, it should not be used as <strong>the</strong> main approach to determine <strong>the</strong> fairvaluation.• The Book Value Approach should not be used as <strong>the</strong> main approach to determine <strong>the</strong> fairenterprise value <strong>of</strong> MWBrands as it disregards <strong>the</strong> future performance <strong>of</strong> <strong>the</strong> company.• The Market Comparable Approach also have some limitation to evaluate <strong>the</strong> fair value <strong>of</strong>MWBrands since it evaluates <strong>the</strong> value on <strong>the</strong> minority basis, base solely on <strong>the</strong> singleperiod performance and hence does not fully reflect <strong>the</strong> control premium, brand value and<strong>the</strong> future value from management decision.In conclusion, <strong>the</strong> <strong>Independent</strong> <strong>Financial</strong> <strong>Advisor</strong> is <strong>of</strong> <strong>the</strong> view that <strong>the</strong> optimal range <strong>of</strong> <strong>the</strong>valuation should be based mainly on <strong>the</strong> Discount Cash Flow Approach (Pre-Synergy).Therefore, based on <strong>the</strong> range <strong>of</strong> price appraised by Discounted Cash Flow Approach(Pre-Synergy), <strong>the</strong> <strong>Independent</strong> <strong>Financial</strong> <strong>Advisor</strong> is <strong>of</strong> <strong>the</strong> opinion that <strong>the</strong> acquisitionprice <strong>of</strong> EUR680 million is reasonable as it lies in our optimal range <strong>of</strong> EUR 702.3 millionto EUR 875.5 million. The acquisition price is considered to be <strong>the</strong> discount <strong>of</strong> 3.2-22.3%compared to <strong>the</strong> fair value dictated in our optimal range.Page 44
The <strong>Opinion</strong> <strong>of</strong> <strong>the</strong> <strong>Independent</strong> <strong>Financial</strong> <strong>Advisor</strong> on <strong>the</strong> Asset Acquisition <strong>of</strong> Thai Union Frozen Products Plc.Part 3<strong>Opinion</strong> <strong>of</strong> <strong>the</strong> <strong>Independent</strong> <strong>Financial</strong> <strong>Advisor</strong> to <strong>the</strong> Voting <strong>of</strong> ShareholdersIt is <strong>of</strong> <strong>the</strong> opinion <strong>of</strong> <strong>the</strong> <strong>Independent</strong> <strong>Financial</strong> <strong>Advisor</strong> that <strong>the</strong> shareholders should approve <strong>the</strong>transaction that TUF will acquire MWBrands with <strong>the</strong> consideration at <strong>the</strong> enterprise value <strong>of</strong> EUR 680million, as <strong>the</strong> objectives, rationales to enter into this transaction are reasonable and <strong>the</strong> acquisitionprice is fair as explained below:1. Reasonableness and Benefits from Entering into <strong>the</strong> TransactionIt is believed that with <strong>the</strong> acquisition <strong>of</strong> MWBrands will result in <strong>the</strong> delivery <strong>of</strong> <strong>the</strong> following benefits to<strong>the</strong> Company and its shareholders:1. Opportunity to acquire one <strong>of</strong> <strong>the</strong> leading consumer seafood brands businesses in Europehaving a unique combination <strong>of</strong> a vertically integrated business model and leading iconicbrands in all <strong>of</strong> its markets.2. Opportunity to acquire <strong>the</strong> unique set-up delivering low cost producer status whichstreng<strong>the</strong>ns <strong>the</strong> Company’s reputation as one <strong>of</strong> <strong>the</strong> world’s leading low cost canned tunaproducers3. Opportunity to create anticipated benefits from potential value creation created by <strong>the</strong>combination <strong>of</strong> MWBrands and <strong>the</strong> Company’s business4. Opportunity to expand <strong>the</strong> Company’s business potential in ambient/shelf-stable seafoodcategory in European markets, which are <strong>the</strong> largest in <strong>the</strong> world5. Streng<strong>the</strong>ning its reputation to be clear leader in tuna producers creating economies <strong>of</strong> scalesand bargaining power6. Well-established platform for o<strong>the</strong>r international reaches taking advantage <strong>of</strong> strategiclocations in Ghana and SeychellesBesides <strong>the</strong> reasonableness and benefits from entering into <strong>the</strong> transaction, <strong>the</strong> IFA has alsoconsidered <strong>the</strong> factors which could have impacts to <strong>the</strong> shareholders as set out below:1. Impact on financial performance from <strong>the</strong> acquisition and impact to financial status due toincrease in debt financing2. Impact on future dilution impact to existing shareholders due to potential conversion <strong>of</strong>debenture and <strong>the</strong> right <strong>of</strong>ferings/private placement3. Impact on dividend payment capability due to financial covenants imposed from financialinstitutions4. Accounting Impact on <strong>the</strong> Company’s EPS post acquisition(The detail <strong>of</strong> <strong>the</strong> benefit and <strong>the</strong> impact from entering into <strong>the</strong> transaction has been outlined in <strong>the</strong>part 2 <strong>of</strong> this report.)Page 45
The <strong>Opinion</strong> <strong>of</strong> <strong>the</strong> <strong>Independent</strong> <strong>Financial</strong> <strong>Advisor</strong> on <strong>the</strong> Asset Acquisition <strong>of</strong> Thai Union Frozen Products Plc.2. Fairness <strong>of</strong> <strong>the</strong> acquisition priceThe <strong>Independent</strong> <strong>Financial</strong> <strong>Advisor</strong> has conducted <strong>the</strong> valuation analysis on <strong>the</strong> fair acquisition price<strong>of</strong> MWBrands. From analysis, <strong>the</strong> <strong>Independent</strong> <strong>Financial</strong> <strong>Advisor</strong> is <strong>of</strong> <strong>the</strong> view that <strong>the</strong> optimal range<strong>of</strong> <strong>the</strong> valuation should lie between EUR 702.3 million to EUR 875.5 million which is <strong>the</strong> result from <strong>the</strong>base case <strong>of</strong> Discount Cash Flow Approach (Pre-Synergy) and its range arising from <strong>the</strong> sensitivityanalysisTherefore, <strong>the</strong> <strong>Independent</strong> <strong>Financial</strong> <strong>Advisor</strong> is <strong>of</strong> <strong>the</strong> opinion that <strong>the</strong> acquisition price <strong>of</strong> MWBrandsat <strong>the</strong> enterprise value <strong>of</strong> EUR 680 million is reasonable based upon <strong>the</strong> comparison <strong>of</strong> <strong>the</strong> acquisitionprice with <strong>the</strong> range <strong>of</strong> fair value determined under various applicable methodologies.The <strong>Independent</strong> <strong>Financial</strong> <strong>Advisor</strong>’s opinion for this transaction is based on <strong>the</strong> information providedby <strong>the</strong> Company, management interview including all o<strong>the</strong>r relevant information. In case that suchinformation or documents received or situations or assumptions are changed and have an adverseimpact, this may affect our opinion regarding this transaction. We cannot verify <strong>the</strong> correctness <strong>of</strong>information if <strong>the</strong>re is any significant change to <strong>the</strong> mentioned factors.We hereby certify that we have rendered our opinion regarding this tender <strong>of</strong>fer with due care inaccordance with pr<strong>of</strong>essional standard, taking into account <strong>the</strong> interest <strong>of</strong> <strong>the</strong> shareholders.- Kittisak Amornchairojkul - - Sittichai Mahaguna - .(Kittisak Amornchairojkul)(Sittichai Mahaguna)Acting Chief Executive Officer Head <strong>of</strong> Corporate Finance and Equity Capital Market.CIMB Securities (Thailand) Company LimitedPage 46