Appraisal of the selective properties of gill nets and implications for ...
Appraisal of the selective properties of gill nets and implications for ...
Appraisal of the selective properties of gill nets and implications for ...

You also want an ePaper? Increase the reach of your titles
YUMPU automatically turns print PDFs into web optimized ePapers that Google loves.
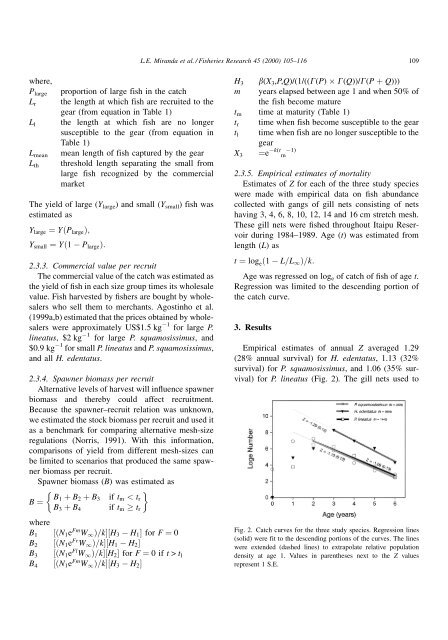
L.E. Mir<strong>and</strong>a et al. / Fisheries Research 45 (2000) 105±116 109where,P largeL rL lL meanL thproportion <strong>of</strong> large fish in <strong>the</strong> catch<strong>the</strong> length at which fish are recruited to <strong>the</strong>gear (from equation in Table 1)<strong>the</strong> length at which fish are no longersusceptible to <strong>the</strong> gear (from equation inTable 1)mean length <strong>of</strong> fish captured by <strong>the</strong> gearthreshold length separating <strong>the</strong> small fromlarge fish recognized by <strong>the</strong> commercialmarketThe yield <strong>of</strong> large (Y large ) <strong>and</strong> small (Y small )fishwasestimated asY large ˆ Y…P large †;Y small ˆ Y…1 P large †:2.3.3. Commercial value per recruitThe commercial value <strong>of</strong> <strong>the</strong> catch was estimated as<strong>the</strong> yield <strong>of</strong> ®sh in each size group times its wholesalevalue. Fish harvested by ®shers are bought by wholesalerswho sell <strong>the</strong>m to merchants. Agostinho et al.(1999a,b) estimated that <strong>the</strong> prices obtained by wholesalerswere approximately US$1.5 kg 1 <strong>for</strong> large P.lineatus, $2kg 1 <strong>for</strong> large P. squamosissimus, <strong>and</strong>$0.9 kg 1 <strong>for</strong> small P. lineatus <strong>and</strong> P. squamosissimus,<strong>and</strong> all H. edentatus.2.3.4. Spawner biomass per recruitAlternative levels <strong>of</strong> harvest will in¯uence spawnerbiomass <strong>and</strong> <strong>the</strong>reby could affect recruitment.Because <strong>the</strong> spawner±recruit relation was unknown,we estimated <strong>the</strong> stock biomass per recruit <strong>and</strong> used itas a benchmark <strong>for</strong> comparing alternative mesh-sizeregulations (Norris, 1991). With this in<strong>for</strong>mation,comparisons <strong>of</strong> yield from different mesh-sizes canbe limited to scenarios that produced <strong>the</strong> same spawnerbiomass per recruit.Spawner biomass (B) was estimated asB ˆ B1 ‡ B 2 ‡ B 3 if t m < t rB 3 ‡ B 4 if t m t rwhereB 1 ‰…N 1 e Fm W 1 †=kŠ‰H 3 H 1 Š <strong>for</strong> F ˆ 0B 2 ‰…N 1 e Fr W 1 †=kŠ‰H 1 H 2 ŠB 3 ‰…N 1 e Fl W 1 †=kŠ‰H 2 Š <strong>for</strong> F ˆ 0ift > t l‰…N 1 e Fm W 1 †=kŠ‰H 3 H 2 ŠB 4H 3b(X 3 ,P,Q)/(1/((G(P) G(Q))/G(P ‡ Q)))m years elapsed between age 1 <strong>and</strong> when 50% <strong>of</strong><strong>the</strong> fish become maturet m time at maturity (Table 1)t r time when fish become susceptible to <strong>the</strong> geart l time when fish are no longer susceptible to <strong>the</strong>gearX 3 ˆe k(t m 1)2.3.5. Empirical estimates <strong>of</strong> mortalityEstimates <strong>of</strong> Z <strong>for</strong> each <strong>of</strong> <strong>the</strong> three study specieswere made with empirical data on ®sh abundancecollected with gangs <strong>of</strong> <strong>gill</strong> <strong>nets</strong> consisting <strong>of</strong> <strong>nets</strong>having 3, 4, 6, 8, 10, 12, 14 <strong>and</strong> 16 cm stretch mesh.These <strong>gill</strong> <strong>nets</strong> were ®shed throughout Itaipu Reservoirduring 1984±1989. Age (t) was estimated fromlength (L) ast ˆ log e …1 L=L 1 †=k:Age was regressed on log e <strong>of</strong> catch <strong>of</strong> ®sh <strong>of</strong> age t.Regression was limited to <strong>the</strong> descending portion <strong>of</strong><strong>the</strong> catch curve.3. ResultsEmpirical estimates <strong>of</strong> annual Z averaged 1.29(28% annual survival) <strong>for</strong> H. edentatus, 1.13 (32%survival) <strong>for</strong> P. squamosissimus, <strong>and</strong> 1.06 (35% survival)<strong>for</strong> P. lineatus (Fig. 2). The <strong>gill</strong> <strong>nets</strong> used toFig. 2. Catch curves <strong>for</strong> <strong>the</strong> three study species. Regression lines(solid) were fit to <strong>the</strong> descending portions <strong>of</strong> <strong>the</strong> curves. The lineswere extended (dashed lines) to extrapolate relative populationdensity at age 1. Values in paren<strong>the</strong>ses next to <strong>the</strong> Z valuesrepresent 1 S.E.