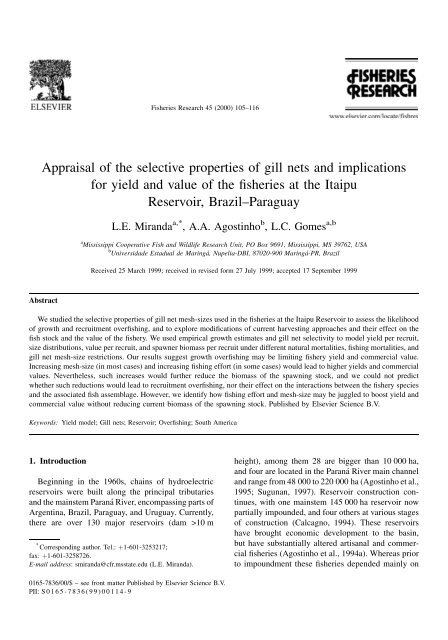
Appraisal of the selective properties of gill nets and implications for ...
Appraisal of the selective properties of gill nets and implications for ...
Appraisal of the selective properties of gill nets and implications for ...

Create successful ePaper yourself
Turn your PDF publications into a flip-book with our unique Google optimized e-Paper software.
L.E. Mir<strong>and</strong>a et al. / Fisheries Research 45 (2000) 105±116 109where,P largeL rL lL meanL thproportion <strong>of</strong> large fish in <strong>the</strong> catch<strong>the</strong> length at which fish are recruited to <strong>the</strong>gear (from equation in Table 1)<strong>the</strong> length at which fish are no longersusceptible to <strong>the</strong> gear (from equation inTable 1)mean length <strong>of</strong> fish captured by <strong>the</strong> gearthreshold length separating <strong>the</strong> small fromlarge fish recognized by <strong>the</strong> commercialmarketThe yield <strong>of</strong> large (Y large ) <strong>and</strong> small (Y small )fishwasestimated asY large ˆ Y…P large †;Y small ˆ Y…1 P large †:2.3.3. Commercial value per recruitThe commercial value <strong>of</strong> <strong>the</strong> catch was estimated as<strong>the</strong> yield <strong>of</strong> ®sh in each size group times its wholesalevalue. Fish harvested by ®shers are bought by wholesalerswho sell <strong>the</strong>m to merchants. Agostinho et al.(1999a,b) estimated that <strong>the</strong> prices obtained by wholesalerswere approximately US$1.5 kg 1 <strong>for</strong> large P.lineatus, $2kg 1 <strong>for</strong> large P. squamosissimus, <strong>and</strong>$0.9 kg 1 <strong>for</strong> small P. lineatus <strong>and</strong> P. squamosissimus,<strong>and</strong> all H. edentatus.2.3.4. Spawner biomass per recruitAlternative levels <strong>of</strong> harvest will in¯uence spawnerbiomass <strong>and</strong> <strong>the</strong>reby could affect recruitment.Because <strong>the</strong> spawner±recruit relation was unknown,we estimated <strong>the</strong> stock biomass per recruit <strong>and</strong> used itas a benchmark <strong>for</strong> comparing alternative mesh-sizeregulations (Norris, 1991). With this in<strong>for</strong>mation,comparisons <strong>of</strong> yield from different mesh-sizes canbe limited to scenarios that produced <strong>the</strong> same spawnerbiomass per recruit.Spawner biomass (B) was estimated asB ˆ B1 ‡ B 2 ‡ B 3 if t m < t rB 3 ‡ B 4 if t m t rwhereB 1 ‰…N 1 e Fm W 1 †=kŠ‰H 3 H 1 Š <strong>for</strong> F ˆ 0B 2 ‰…N 1 e Fr W 1 †=kŠ‰H 1 H 2 ŠB 3 ‰…N 1 e Fl W 1 †=kŠ‰H 2 Š <strong>for</strong> F ˆ 0ift > t l‰…N 1 e Fm W 1 †=kŠ‰H 3 H 2 ŠB 4H 3b(X 3 ,P,Q)/(1/((G(P) G(Q))/G(P ‡ Q)))m years elapsed between age 1 <strong>and</strong> when 50% <strong>of</strong><strong>the</strong> fish become maturet m time at maturity (Table 1)t r time when fish become susceptible to <strong>the</strong> geart l time when fish are no longer susceptible to <strong>the</strong>gearX 3 ˆe k(t m 1)2.3.5. Empirical estimates <strong>of</strong> mortalityEstimates <strong>of</strong> Z <strong>for</strong> each <strong>of</strong> <strong>the</strong> three study specieswere made with empirical data on ®sh abundancecollected with gangs <strong>of</strong> <strong>gill</strong> <strong>nets</strong> consisting <strong>of</strong> <strong>nets</strong>having 3, 4, 6, 8, 10, 12, 14 <strong>and</strong> 16 cm stretch mesh.These <strong>gill</strong> <strong>nets</strong> were ®shed throughout Itaipu Reservoirduring 1984±1989. Age (t) was estimated fromlength (L) ast ˆ log e …1 L=L 1 †=k:Age was regressed on log e <strong>of</strong> catch <strong>of</strong> ®sh <strong>of</strong> age t.Regression was limited to <strong>the</strong> descending portion <strong>of</strong><strong>the</strong> catch curve.3. ResultsEmpirical estimates <strong>of</strong> annual Z averaged 1.29(28% annual survival) <strong>for</strong> H. edentatus, 1.13 (32%survival) <strong>for</strong> P. squamosissimus, <strong>and</strong> 1.06 (35% survival)<strong>for</strong> P. lineatus (Fig. 2). The <strong>gill</strong> <strong>nets</strong> used toFig. 2. Catch curves <strong>for</strong> <strong>the</strong> three study species. Regression lines(solid) were fit to <strong>the</strong> descending portions <strong>of</strong> <strong>the</strong> curves. The lineswere extended (dashed lines) to extrapolate relative populationdensity at age 1. Values in paren<strong>the</strong>ses next to <strong>the</strong> Z valuesrepresent 1 S.E.
L.E. Mir<strong>and</strong>a et al. / Fisheries Research 45 (2000) 105±116 111Fig. 4. Relations between M ‡ F(Z) <strong>and</strong> biomass per 890 recruits <strong>and</strong> yield per 890 recruits <strong>of</strong> Hypophthalmus edentatus according to meshsize(cm). Values were predicted with a Beverton <strong>and</strong> Holt equilibrium yield model. The shaded area represents two st<strong>and</strong>ard errors on eachside <strong>of</strong> <strong>the</strong> mean Z from Fig. 2. Size proportions were not provided because <strong>the</strong> market <strong>for</strong> this species recognizes only one size group;commercial values are 0.9 <strong>of</strong> yield values. We arbitrarily set <strong>the</strong> number <strong>of</strong> recruits to age 1 ˆ 1000, but adjusted this value by multiplying by<strong>the</strong> predicted representation <strong>of</strong> <strong>the</strong> species at age 1 (0.89, derived from Fig. 2) relative to <strong>the</strong> o<strong>the</strong>r two species.increased with exp<strong>and</strong>ing levels <strong>of</strong> F <strong>and</strong> ei<strong>the</strong>rbecame asymptotic, or peaked at intermediate levels<strong>of</strong> ®shing <strong>and</strong> <strong>the</strong>n decreased. Size <strong>of</strong> ®sh harvesteddecreased with increments in M <strong>and</strong> F. Commercialvalue <strong>of</strong> <strong>the</strong> catch re¯ected trends in yield, but inequalitiesamong mesh-sizes were accentuated by differencesin sizes that comm<strong>and</strong>ed disparate commercialvalues. Average weight <strong>of</strong> ®sh harvested was directlyrelated to mesh-size <strong>and</strong> inversely related to mortalityrates, <strong>and</strong> <strong>for</strong> <strong>the</strong> scenarios considered <strong>the</strong> ranges were0.17±0.92 kg <strong>for</strong> P. squamosissimus (Fig. 3), 0.08±0.38 kg <strong>for</strong> H. edentatus (Fig. 4), <strong>and</strong> 0.80±2.82 kg <strong>for</strong>P. lineatus (Fig. 5). H. edentatus manifested <strong>the</strong> highestpotential yields <strong>and</strong> H. edentatus <strong>and</strong> P. lineatuscomm<strong>and</strong>ed <strong>the</strong> highest commercial values.Increasing length at recruitment through <strong>the</strong> use <strong>of</strong>progressively larger mesh consistently producedhigher yields <strong>and</strong> commercial values when M waslow (Figs. 3±5). When M was high, this trend changed<strong>for</strong> H. edentatus (Fig. 4). Moreover, when M was highyield appeared to be less responsive to changes inmesh-size (i.e., length at recruitment to <strong>the</strong> ®shery).Increasing <strong>the</strong> sizes <strong>of</strong> ®sh targeted by <strong>the</strong> ®sherythrough <strong>the</strong> use <strong>of</strong> <strong>nets</strong> with 7±10 cm meshes (or 13±18 cm) <strong>of</strong>ten produced results intermediate to thoseaccomplished by using meshes 7±8 <strong>and</strong> 9±10 cm (or13±15 <strong>and</strong> 16±18 cm). Also, increasing <strong>the</strong> range <strong>of</strong>sizes <strong>of</strong> ®sh targeted by using 7±10 or 13±18 cm mesh<strong>of</strong>ten resulted in yield <strong>and</strong> commercial value maximaor plateaus that occurred at lower F than when anarrower range <strong>of</strong> sizes were targeted.Biomass <strong>of</strong> <strong>the</strong> spawning stock was lower at <strong>the</strong>higher M <strong>and</strong> decreased asymptotically with incrementsin F (Figs. 3±5). The effect <strong>of</strong> mesh-size onstock size was small at low F, but stock biomassbecame progressively more divergent among <strong>gill</strong> netmesh-sizes as F increased. For <strong>the</strong> low M, biomass <strong>of</strong><strong>the</strong> spawning stock was consistently larger whenharvest was deferred through <strong>the</strong> use <strong>of</strong> large meshes;<strong>for</strong> high M, only <strong>the</strong> spawning stock <strong>of</strong> P. lineatuscould be enhanced by deferring harvest. Results alsosuggested that increasing mesh-size <strong>of</strong>ten allowedincreased yield through increased F while keepingbiomass <strong>of</strong> <strong>the</strong> spawning stock constant (Fig. 6). Forinstance, <strong>for</strong> P. lineatus <strong>and</strong> M ˆ 0.5, at currentZ ˆ 1.06 <strong>and</strong> mesh-sizes 10±12 cm, biomass per
112 L.E. Mir<strong>and</strong>a et al. / Fisheries Research 45 (2000) 105±116Fig. 5. Relations between M ‡ F(Z) <strong>and</strong> biomass per 50 recruits, yield per 50 recruits, commercial value, <strong>and</strong> <strong>the</strong> proportion <strong>of</strong> large fish in<strong>the</strong> catch <strong>of</strong> Prochilodus lineatus according to mesh-size (cm). Values were predicted with a Beverton <strong>and</strong> Holt equilibrium yield model. Theshaded area represents two st<strong>and</strong>ard errors on each side <strong>of</strong> <strong>the</strong> mean Z from Fig. 2. We arbitrarily set <strong>the</strong> number <strong>of</strong> recruits to age 1 ˆ 1000,but adjusted this value by multiplying by <strong>the</strong> predicted representation <strong>of</strong> <strong>the</strong> species at age 1 (0.05, derived from Fig. 2) relative to <strong>the</strong> o<strong>the</strong>rtwo species.recruit is about 75 kg (solid horizontal line in Fig. 6),F ˆ 0.56, <strong>and</strong> yield per recruit 14 kg. If mesh-size isincreased to 13±15 or 16±18 cm, F may be increasedto 0.78 or 1.18 to achieve yield per recruit <strong>of</strong> 21 or27.5 kg, respectively, without changing stock biomass(Fig. 6).4. DiscussionOur results suggest growth over®shing (®sh harvestedbe<strong>for</strong>e <strong>the</strong>y have achieved maximum yield perrecruit; Gull<strong>and</strong>, 1988) may be limiting ®shery yield<strong>and</strong> commercial value <strong>of</strong> P. squamosissimus, whe<strong>the</strong>r
L.E. Mir<strong>and</strong>a et al. / Fisheries Research 45 (2000) 105±116 1134.1. Implications <strong>of</strong> manipulating mesh-sizeFig. 6. Relations between M ‡ F(Z) <strong>and</strong> biomass per 50 recruits<strong>and</strong> yield per 50 recruits <strong>of</strong> Prochilodus lineatus at M ˆ 0.5. Atcurrent Z ˆ 1.06 <strong>and</strong> mesh-sizes 10±12 cm, biomass per recruit isabout 75 kg (solid horizontal line), F ˆ 0.56, <strong>and</strong> yield per recruit14 kg. If mesh-size is increased to 13±15 or 16±18 cm, F may beincreased to 0.78 or 1.18 to achieve yield per recruit <strong>of</strong> 21 or27.5 kg, respectively, without changing stock biomass.M is high or low, <strong>and</strong> H. edentatus if M is high. It wasalso apparent that increases in F could in some caseslead to increased ®shery yield <strong>and</strong> value. Never<strong>the</strong>less,such increases in F would fur<strong>the</strong>r reduce <strong>the</strong> biomass<strong>of</strong> <strong>the</strong> spawning stock, <strong>and</strong> we cannot predict whe<strong>the</strong>rsuch reductions would lead to recruitment over®shing(spawning stock reduced to a level that precludesadequate production <strong>of</strong> young ®sh, Gull<strong>and</strong>, 1988),nor <strong>the</strong>ir effect on <strong>the</strong> interactions between <strong>the</strong> studyspecies <strong>and</strong> <strong>the</strong> associated ®sh assemblage. However,we can predict how F <strong>and</strong> mesh-size may be juggled toboost yield <strong>and</strong> commercial value without reducingbiomass <strong>of</strong> <strong>the</strong> spawning stock. Below we explore <strong>the</strong><strong>implications</strong> <strong>of</strong> manipulating mesh-size, consider <strong>the</strong>sustainability <strong>of</strong> yield <strong>and</strong> <strong>the</strong> limitations <strong>of</strong> our predictions,<strong>and</strong> conjecture whe<strong>the</strong>r harvesting strategiesmay be limiting ®shery yield in <strong>the</strong> Itaipu Reservoir<strong>and</strong> <strong>the</strong> reservoirs <strong>of</strong> <strong>the</strong> Parana Basin in general.Our data allowed us to obtain estimates <strong>of</strong> totalannual mortality, but did not allow us to separate®shing mortality from o<strong>the</strong>r causes <strong>of</strong> mortality.Separating Z into F <strong>and</strong> M is important because lowversus high M values lead to different harvestingstrategies. In general, when M is low, yield can beincreased by delaying harvest, requiring use <strong>of</strong> largemesh-sizes <strong>and</strong> restraints on ®shing ef<strong>for</strong>t; when M ishigh, ®sh may need to be harvested earlier, requiringuse <strong>of</strong> small mesh-sizes <strong>and</strong> limited or no restraints on®shing ef<strong>for</strong>t. Never<strong>the</strong>less, without knowing M wecan still draw some generalizations about appropriatemesh-sizes, <strong>and</strong> about whe<strong>the</strong>r increasing or decreasingF could lead to substantially different yields.Meshes 7 <strong>and</strong> 8 cm account <strong>for</strong> nearly 85% <strong>of</strong> <strong>the</strong><strong>gill</strong> <strong>nets</strong> used to target P. squamosissimus in <strong>the</strong> ItaipuReservoir (Agostinho et al., 1994a). Our model indicatedthat this strategy resulted in growth over®shing.Greater yield <strong>and</strong> commercial value could be obtainedfrom this species if a larger mesh-size was used (e.g.,9±10 cm scenario), or if <strong>the</strong> range <strong>of</strong> meshes currentlyused was exp<strong>and</strong>ed to include equal consideration <strong>of</strong>larger mesh-sizes (e.g., 7±10 cm scenario). Suchmesh-size increases can also lead to increased biomassper recruit if M is low (Fig. 3). If M is high, biomassper recruit would be reduced slightly if mesh-sizeswere shifted to 9±10 cm <strong>and</strong> considerably if shifted to7±10 cm. The latter mesh-size scenario could beexercised if <strong>the</strong> management objective is to maintaina low biomass <strong>of</strong> P. squamosissimus, an introducedspecies that could potentially perturb <strong>the</strong> native ®shassemblages (Agostinho <strong>and</strong> Julio, 1996).Meshes 7 <strong>and</strong> 8 cm also account <strong>for</strong> nearly 85% <strong>of</strong><strong>the</strong> <strong>gill</strong> <strong>nets</strong> used to target H. edentatus in ItaipuReservoir (Agostinho et al., 1994a). Our model indicatedthat this strategy resulted in growth over®shingonly if M was low. In this case, greater yield, commercialvalue, <strong>and</strong> biomass per recruit could beobtained from H. edentatus if <strong>the</strong> 9±10 or 7±10 cmmesh-sizes were used. If M was high, <strong>the</strong> 7±10 cmmesh scenario provided <strong>the</strong> highest yield <strong>and</strong> commercialvalue, but at <strong>the</strong> lowest biomass per recruit.The 7±8 cm mesh (current scenario) appeared toprovide a compromise scenario by maintaining <strong>the</strong>highest biomass at a slightly reduced yield from <strong>the</strong> 7±10 cm scenario. Indeed, at <strong>the</strong> estimated Z <strong>of</strong> 1.29 <strong>the</strong>
114 L.E. Mir<strong>and</strong>a et al. / Fisheries Research 45 (2000) 105±1167±8 cm mesh maintained a biomass per recruit <strong>of</strong>nearly 100 kg <strong>and</strong> a yield per recruit <strong>of</strong> over 30 kg;to maintain this biomass with <strong>the</strong> 7±10 cm meshscenario, Z would need to be reduced to about 0.9(F about 0.4) resulting in a lowering <strong>of</strong> yield to lessthan 30 kg.P. squamosissimus <strong>and</strong> H. edentatus are capturedwith <strong>the</strong> same gear. It is apparent that <strong>the</strong> large meshscenario would produce <strong>the</strong> highest commercialvalues if M was low <strong>for</strong> both species, or low <strong>for</strong>one species but not <strong>the</strong> o<strong>the</strong>r. However, if M was high<strong>for</strong> both species, mesh scenarios 7±8, 9±10, <strong>and</strong> 7±10would produce similar commercial values, but <strong>the</strong> 7±8scenario would retain <strong>the</strong> highest biomass per recruit.These two species appear to segregate verticallywithin <strong>the</strong> water column, with H. edentatus occupying<strong>the</strong> upper 5±10 m <strong>and</strong> P. squamosissimus inhabitingdeeper water. Thus, if M were known to deviatesubstantially between <strong>the</strong>se two species, differentmesh-sizes may be used to target each species indifferent habitats <strong>and</strong> fur<strong>the</strong>r optimize yield. Never<strong>the</strong>less,<strong>the</strong> effectiveness <strong>of</strong> this strategy may berestricted by P. squamosissimus which sometimespursue <strong>and</strong> feed on schools <strong>of</strong> H. edentatus (Agostinhoet al., 1994b).Our model also indicated that higher commercialvalues <strong>and</strong> biomass per recruit may be obtained <strong>for</strong> P.lineatus if <strong>the</strong> mesh-sizes used in <strong>the</strong> ®sheries areincreased. This conclusion applied to <strong>the</strong> low or highnatural mortalities modeled. Meshes 10, 11, <strong>and</strong> 12account <strong>for</strong> about 40% <strong>of</strong> <strong>the</strong> <strong>gill</strong> <strong>nets</strong> used to target P.lineatus, mesh-size 14 cm 35%, <strong>and</strong> mesh-sizes 16<strong>and</strong> 18 cm <strong>for</strong> less than 25%.For all three species, a ®shery with a broader range<strong>of</strong> meshes <strong>of</strong>ten produced yield <strong>and</strong> stock biomassintermediate to those obtained by a narrower range(e.g., 7±10 cm mesh versus 7±8 <strong>and</strong> 9±10 cm). Thenarrower range <strong>of</strong> meshes increases mortality in aconstricted portion <strong>of</strong> <strong>the</strong> age structure, whereas <strong>the</strong>broader range spreads mortality over more age groups.Such different effects on age structures may in¯uence<strong>the</strong> recruit-spawner relation, <strong>and</strong> how <strong>the</strong> speciesinteract with <strong>the</strong> ®sh assemblage. Spreading mortalityover a smaller portion <strong>of</strong> <strong>the</strong> population may produceage distributions that seem less natural, <strong>and</strong> gains instock biomass associated with targeting a narrowportion <strong>of</strong> a stock may be nulli®ed by an arti®cialage distribution. However, it is dif®cult to evaluate <strong>the</strong>signi®cance <strong>of</strong> <strong>the</strong> differences in age structures renderedby different harvesting strategies without betterknowledge <strong>of</strong> <strong>the</strong> factors in¯uencing recruitmentvariability <strong>and</strong> community interactions.4.2. Sustainability <strong>of</strong> yield estimatesThe aim <strong>of</strong> commercial ®sheries managementshould be to ensure sustainability while optimizingbene®ts. Yield is not sustainable when ®sh are harvestedbe<strong>for</strong>e <strong>the</strong>y are allowed to spawn at least once,<strong>and</strong> when ®shing greatly reduces population size. Bycomparing <strong>the</strong> length at which 50% <strong>of</strong> <strong>the</strong> ®sh becomemature with <strong>the</strong> length at ®rst capture we may obtain arough idea <strong>of</strong> whe<strong>the</strong>r yield estimates are sustainable.We assumed that <strong>the</strong> stock is more likely to besustained if <strong>the</strong> average length <strong>of</strong> ®sh in <strong>the</strong> harvestis larger than <strong>the</strong> average length at maturity. Thus, <strong>the</strong>average individual harvested has had a chance tospawn at least once. Based on estimates <strong>of</strong> length atmaturity, growth, <strong>and</strong> <strong>gill</strong> net retention (Table 1) weestimate that 50% <strong>of</strong> P. squamosissimus spawn by age1.8 whereas <strong>the</strong> minimum age retained by 5, 7, <strong>and</strong>9 cm mesh are 1.2, 1.7, <strong>and</strong> 2.2 years. For H. edentatus,50% spawn by age 3.3 whereas <strong>the</strong> minimum ageretained by 5, 7, <strong>and</strong> 9 cm mesh are 2.4, 3.3, <strong>and</strong> 4.4years. For P. lineatus, 50% spawn by age 1.9 whereas<strong>the</strong> minimum age retained by 10, 13, <strong>and</strong> 16 cm meshare 2.0, 2.5, <strong>and</strong> 3.1 years. Thus, <strong>for</strong> P. squamosissimus<strong>and</strong> H. edentatus, high F with 5±6 cm mesh is probablyunsustainable, whereas <strong>the</strong> 7±8 cm mesh scenariois marginal <strong>and</strong> risks recruitment over®shing givenuncertainty <strong>and</strong> natural variability in <strong>the</strong> parameters.There appeared to be no such risks with P. lineatus.Wedo not know what constitutes an unsustainable highlevel <strong>of</strong> F, <strong>and</strong> such level would depend on M. However,we suspect that Z values greater than about 1.6(about 80% annual mortality) are likely to limit sustainability(Patterson, 1992). Levels <strong>of</strong> Z <strong>for</strong> <strong>the</strong> study®sheries were lower than 1.6.It is evident that small mesh-sizes <strong>and</strong> high ®shingef<strong>for</strong>t can lead to diminished economic bene®ts,reduced catch per ef<strong>for</strong>t, <strong>and</strong> <strong>the</strong> collapse <strong>of</strong> <strong>the</strong> ®sheries<strong>for</strong> <strong>the</strong> current target species. However, even if<strong>the</strong> ®sheries <strong>for</strong> <strong>the</strong> current species collapse, o<strong>the</strong>rspecies may be able to still sustain a ®shery. In Africanlagoons over®shing led to a reorganization <strong>of</strong> <strong>the</strong>species assemblage, towards a few dominant species
L.E. Mir<strong>and</strong>a et al. / Fisheries Research 45 (2000) 105±116 115that were small in size <strong>and</strong> generally herbivorous(LaeÈ, 1997). Whereas total yield did not decrease,®sh biomass <strong>and</strong> catch per ef<strong>for</strong>t decreased. Thus,®shery yield remained relatively unchanged, but <strong>the</strong>economics <strong>of</strong> <strong>the</strong> ®shery changed drastically (LaeÈ,1997).4.3. Limitations <strong>of</strong> predictionsThere is much uncertainty associated with predictingresponses <strong>of</strong> ®sh populations with models. Firstly,<strong>the</strong>re is uncertainty about <strong>the</strong> ability <strong>of</strong> <strong>the</strong> model todescribe <strong>the</strong> biological <strong>and</strong> ®shery system being modeled.By de®nition, models are abstractions <strong>of</strong> reality,<strong>and</strong> <strong>of</strong>ten fall short <strong>of</strong> accurately simulating reality.Also, <strong>the</strong> model we used provided a deterministicview, although we attempted partially to amelioratethis limitation by modeling various scenarios. Secondly,<strong>the</strong>re is uncertainty about <strong>the</strong> parameters inputinto <strong>the</strong> model. These parameters were obtainedempirically through ®eld surveys af¯icted by variouslimitations. Never<strong>the</strong>less, we believe many <strong>of</strong> <strong>the</strong>parameters were more realistic than <strong>the</strong> model itself.Despite <strong>the</strong>se limitations, several generalizationscould be made to diagnose <strong>the</strong> direction <strong>the</strong> ®sherywill take given major harvest modi®cations.4.4. Are harvesting strategies limiting fishery yield?The ®sheries at <strong>the</strong> Itaipu Reservoir are not unlikethose <strong>of</strong> o<strong>the</strong>r reservoirs in <strong>the</strong> basin. With fewexceptions, <strong>the</strong> species common in <strong>the</strong> Itaipu ®sheriesare also common in o<strong>the</strong>r reservoirs (Agostinho et al.,1995). P. squamosissimus occurred in eight reservoirsexamined in <strong>the</strong> Upper Parana River, <strong>and</strong> its contributionto <strong>the</strong> total yield ranged 11±29% (Itaipu ˆ 17). P.lineatus depends on lotic environments in¯owing into<strong>the</strong> reservoir <strong>and</strong> occurred in seven <strong>of</strong> eight reservoirs,<strong>and</strong> its contribution to <strong>the</strong> total yield ranged 12±37%(Itaipu ˆ 14). H. edentatus is important in <strong>the</strong> ®sheries<strong>of</strong> <strong>the</strong> Itaipu Reservoir but not in any <strong>of</strong> <strong>the</strong> reservoirsupstream. This species is native to <strong>the</strong> middle <strong>and</strong>lower Parana River <strong>and</strong> gained access to <strong>the</strong> UpperParana when Sete Quedas Falls, historically <strong>the</strong> upperboundary <strong>of</strong> <strong>the</strong> distribution <strong>of</strong> ®sh populations thatoccupied <strong>the</strong> Middle Parana River, were ¯ooded by <strong>the</strong>Itaipu Reservoir. When this ¯ooding occurred, H.edentatus exp<strong>and</strong>ed beyond its original range, butaccess to <strong>the</strong> entire Upper Parana Basin was limitedby upstream dams.Empirical estimates <strong>of</strong> Z suggested that over®shing,if it occurs, is not excessive. A similar conclusion wasreached by Okada et al. (1996) who used a Schaeffermodel to conclude that <strong>the</strong> ®sheries (over 60 speciesincluded) in <strong>the</strong> Itaipu Reservoir were slightly overfished.Moreover, our results suggest that one or two <strong>of</strong><strong>the</strong> study species may be experiencing growth over-®shing, <strong>and</strong> increases in mesh-size would lead toincreases in yield. Such increases could enhance yield,but probably could not double it. Thus, althoughharvesting strategies appear to be partially limiting®shery yield, o<strong>the</strong>r factors must also contribute to lowyields in reservoirs <strong>of</strong> <strong>the</strong> Parana River relative tothose identi®ed <strong>for</strong> reservoirs in nor<strong>the</strong>astern Brazil,Africa, Asia, <strong>and</strong> North America.AcknowledgementsWe thank Itaipu Binacional <strong>for</strong> funding much <strong>of</strong> ourwork. E.K. Okada helped summarize data used in ouranalyses. M. Allen provided a helpful review <strong>of</strong> anearlier draft <strong>of</strong> this manuscript.ReferencesAgostinho, A.A., Benedito-Cecilio, E., Gomes, L.C., Sampaio,A.A., 1994b. Spatial <strong>and</strong> temporal distribution <strong>of</strong> sardela,Hypophthalmus edentatus (Pisces, Siluroidei) in <strong>the</strong> area <strong>of</strong>influence <strong>of</strong> <strong>the</strong> Itaipu Reservoir (ParanaÂ, Brazil). Unimar16(3), 27±40.Agostinho, A.A., Julio Jr., H.F., 1996. Ameac,a ecoloÂgica: peixes deoutras aÂguas. CieÃncia Hoje 21(124), 36±44.Agostinho, A.A., Mir<strong>and</strong>a, L.E., Bini, L.M., Gomes, L.C., Thomaz,S.M., Suzuki, H.I., 1999b. Patterns <strong>of</strong> colonization inneotropical reservoirs, <strong>and</strong> prognoses on aging. In: Tundisi,J.G., StrasÏkraba, M. (Eds.), Theoretical Ecology <strong>and</strong> itsApplications. Backhuys Publishers, Leiden, The Ne<strong>the</strong>rl<strong>and</strong>s,pp. 227±265.Agostinho, A.A., Okada, E.K., Gregoris, J., 1994a. CaracterõÂsticaseconoÃmicas e sociais das atividades pesqueiras no reservatoÂriode Itaipu. In: Simposio Regional sobre o Manejo de la Pesca enEmbalses en America Latina, Havana, 1994. FAO, COPESCALPublicaciones TeÂcnicas, Havana, 100 pp.Agostinho, A.A., Okada, E.K., Gregoris, J., 1999a. A pesca noreservatoÂrio de Itaipu: aspectos soÂcio econoÃmicos e impactosdo represamento. In: Henry, R. (Ed.), Ecologia de ReservatoÂrio:Estrutura, Func,aÄo e Aspectos Sociais. Instituto de BiocieÃncias,UNESP, Botucatu.
116 L.E. Mir<strong>and</strong>a et al. / Fisheries Research 45 (2000) 105±116Agostinho, A.A., Vazzoler, A.E.A.M., Thomaz, S.M., 1995. Thehigh River Parana Basin: limnological <strong>and</strong> ichthyologicalaspects. In: Tundisi, J.G., Bicudo, C.E.M., Matsumura-Tundisi,T. (Eds.), Limnology in Brazil. ABC/SBL, Rio de Janeiro, pp.59±103.Agostinho, A.A., Zalewski, M., 1995. The dependence <strong>of</strong> <strong>the</strong> fishcommunity structure <strong>and</strong> dynamics on floodplain <strong>and</strong> riparianecotone zone in Parana River, Brazil. Hydrobiologia 303, 141±148.ArauÂjo-Lima, C.A.R.M., Agostinho, A.A., Fabre, N.N., 1995.Trophic aspects <strong>of</strong> fish communities in Brazilian rivers <strong>and</strong>reservoir. In: Tundisi, J.G., Bicudo, C.E.M., Matsumura-Tundisi, T. (Eds.), Limnology in Brazil. ABC/SBL, Rio deJaneiro, pp.105±136.Calcagno, A., 1994. A review <strong>of</strong> reservoir development inArgentina <strong>and</strong> <strong>the</strong> environmental aspects <strong>of</strong> <strong>the</strong> CorpusChristi Project. In: Environmental <strong>and</strong> social dimensions<strong>of</strong> reservoir development <strong>and</strong> management in <strong>the</strong> La PlataRiver Basin. United Nations Center <strong>for</strong> Regional Development,Research Report Series No. 4, Nagoya, Japan, pp. 97±110.Carlson, R.E., 1977. A trophic state index <strong>for</strong> lakes. Limnol.Oceanogr. 22, 361±369.De Silva, S.S., 1987. The reservoir fishery in Asia. In: De Silva,S.S. (Ed.), Reservoir Fishery Management <strong>and</strong> Development inAsia. International Development Research Centre, Canada, pp.19±28.Fern<strong>and</strong>o, C.H., HolcÂik, J., 1982. Future <strong>of</strong> fish communities: afactor influencing <strong>the</strong> fishery potential <strong>and</strong> yields <strong>of</strong> lakes <strong>and</strong>reservoirs. Hydrobiologia 97, 127±140.Gomes, L.C., Agostinho, A.A., 1997. Influence <strong>of</strong> <strong>the</strong> floodingregime on <strong>the</strong> nutritional state <strong>and</strong> juvenile recruitment <strong>of</strong> <strong>the</strong>curimba Prochilodus scr<strong>of</strong>a Steindachner in Upper ParanaÂRiver, Brazil. Fish. Mgmt. Ecol. 4, 263±274.Gull<strong>and</strong>, J.A., 1988. Fish stock assessment: a manual <strong>of</strong> basicmethods. FAO/Wiley Series in Food <strong>and</strong> Agriculture. Wiley,New York.LaeÈ, R., 1997. Does overfishing lead to a decrease in catches <strong>and</strong>yields? An example <strong>of</strong> two West African coastal lagoons. Fish.Mgmt. Ecol. 4, 149±164.Marshall, B.E., 1984. Predicting ecology <strong>and</strong> fish yields in Africanreservoirs from pre-impoundment physico-chemical data, vol.12. CIFA Technicasl Paper/Doc. Tech. CPCA, 26 pp.Mir<strong>and</strong>a, L.E., 1999. A typology <strong>of</strong> fisheries in large reservoirs <strong>of</strong><strong>the</strong> United States. N. Am. J. Fish. Mgmt. 19, 536±550.Norris, J.G., 1991. Fur<strong>the</strong>r perspectives on yield per recruit analysis<strong>and</strong> biological reference points. Can. J. Fish. Aquat. Sci. 48,2533±2542.Okada, E.K., Agostinho, A.A., Petrere Jr., M., 1996. Catch <strong>and</strong>ef<strong>for</strong>t data <strong>and</strong> <strong>the</strong> management <strong>of</strong> <strong>the</strong> commercial fisheries <strong>of</strong>Itaipu reservoir in <strong>the</strong> upper Parana river, Brazil. In: Cowx, I.G.(Ed.), Stock Assessment in Inl<strong>and</strong> Fisheries. Fishing NewsBooks, Ox<strong>for</strong>d, pp. 154±161.Oldani, N.O., 1994. General considerations on productivity <strong>of</strong> fishin <strong>the</strong> Parana River. In: Environmental <strong>and</strong> social dimensions <strong>of</strong>reservoir development <strong>and</strong> management in <strong>the</strong> La Plata RiverBasin. United Nations Centre <strong>for</strong> Regional DevelopmentResearch Report Series No. 4, Nagoya, Japan, pp. 59±66.Paiva, M.P., Petrere Jr., M., Petenate, A.J., Nepomuceno, F.H.,Vasconcelos, E.A., 1994. Relationship between <strong>the</strong> number <strong>of</strong>predatory fish species <strong>and</strong> fish yield in large nor<strong>the</strong>asternBrazilian reservoirs. In: Cowx, I.G. (Ed.), Rehabilitation <strong>of</strong> FreshwaterFisheries. Fishing News Books, Ox<strong>for</strong>d, pp. 120±130.Patterson, K., 1992. Fisheries <strong>for</strong> small pelagic species: anempirical approach to management targets. Rev. Fish Biol.Fish. 2, 321±338.Petrere Jr., M., 1996. Fisheries in large tropical reservoirs in SouthAmerica. Lake Reservoir Res. Mgmt. 2, 111±113.Ricker, W.E., 1975. Computation <strong>and</strong> interpretation <strong>of</strong> biologicalstatistics <strong>of</strong> fish populations. Bull Fish. Res. Board <strong>of</strong> Canada,191, 382 pp.Sugunan, V.V., 1997. Fisheries management <strong>of</strong> small water bodiesin seven countries in Africa, Asia <strong>and</strong> Latin America. FAOFish. Circualtion No. 933, Rome.