

Bayesian analysis of ordinal survey data using the Dirichlet process ...
Bayesian analysis of ordinal survey data using the Dirichlet process ...
Bayesian analysis of ordinal survey data using the Dirichlet process ...

Create successful ePaper yourself
Turn your PDF publications into a flip-book with our unique Google optimized e-Paper software.
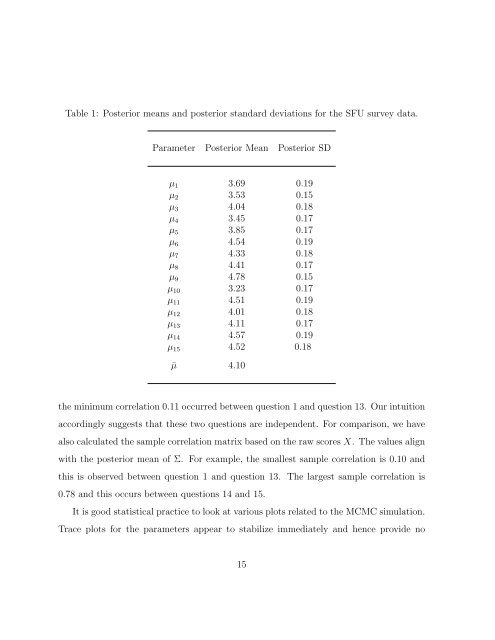
Table 1: Posterior means and posterior standard deviations for <strong>the</strong> SFU <strong>survey</strong> <strong>data</strong>.Parameter Posterior Mean Posterior SDµ 1 3.69 0.19µ 2 3.53 0.15µ 3 4.04 0.18µ 4 3.45 0.17µ 5 3.85 0.17µ 6 4.54 0.19µ 7 4.33 0.18µ 8 4.41 0.17µ 9 4.78 0.15µ 10 3.23 0.17µ 11 4.51 0.19µ 12 4.01 0.18µ 13 4.11 0.17µ 14 4.57 0.19µ 15 4.52 0.18¯µ 4.10<strong>the</strong> minimum correlation 0.11 occurred between question 1 and question 13. Our intuitionaccordingly suggests that <strong>the</strong>se two questions are independent. For comparison, we havealso calculated <strong>the</strong> sample correlation matrix based on <strong>the</strong> raw scores X. The values alignwith <strong>the</strong> posterior mean <strong>of</strong> Σ. For example, <strong>the</strong> smallest sample correlation is 0.10 andthis is observed between question 1 and question 13. The largest sample correlation is0.78 and this occurs between questions 14 and 15.It is good statistical practice to look at various plots related to <strong>the</strong> MCMC simulation.Trace plots for <strong>the</strong> parameters appear to stabilize immediately and hence provide no15


