LIT-088 Irrigation Notes: Scheduling Irrigation - Hunter Industries
LIT-088 Irrigation Notes: Scheduling Irrigation - Hunter Industries
LIT-088 Irrigation Notes: Scheduling Irrigation - Hunter Industries

Create successful ePaper yourself
Turn your PDF publications into a flip-book with our unique Google optimized e-Paper software.
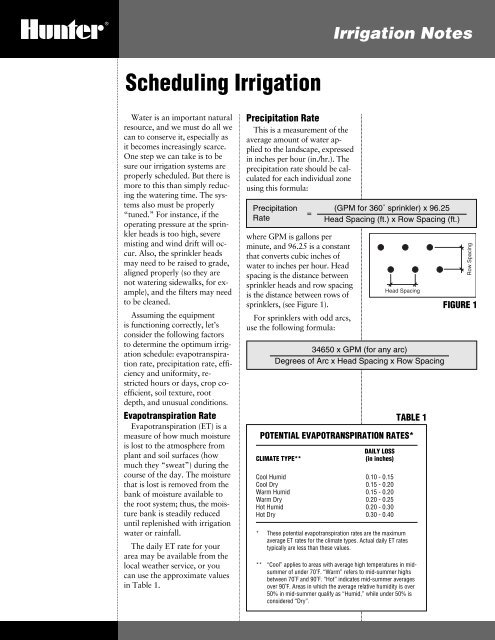
<strong>Irrigation</strong> <strong>Notes</strong><strong>Scheduling</strong> <strong>Irrigation</strong>Water is an important naturalresource, and we must do all wecan to conserve it, especially asit becomes increasingly scarce.One step we can take is to besure our irrigation systems areproperly scheduled. But there ismore to this than simply reducingthe watering time. The systemsalso must be properly“tuned.” For instance, if theoperating pressure at the sprinklerheads is too high, severemisting and wind drift will occur.Also, the sprinkler headsmay need to be raised to grade,aligned properly (so they arenot watering sidewalks, for example),and the filters may needto be cleaned.Assuming the equipmentis functioning correctly, let’sconsider the following factorsto determine the optimum irrigationschedule: evapotranspirationrate, precipitation rate, efficiencyand uniformity, restrictedhours or days, crop coefficient,soil texture, rootdepth, and unusual conditions.Evapotranspiration RateEvapotranspiration (ET) is ameasure of how much moistureis lost to the atmosphere fromplant and soil surfaces (howmuch they “sweat”) during thecourse of the day. The moisturethat is lost is removed from thebank of moisture available tothe root system; thus, the moisturebank is steadily reduceduntil replenished with irrigationwater or rainfall.The daily ET rate for yourarea may be available from thelocal weather service, or youcan use the approximate valuesin Table 1.Precipitation RateThis is a measurement of theaverage amount of water appliedto the landscape, expressedin inches per hour (in./hr.). Theprecipitation rate should be calculatedfor each individual zoneusing this formula:PrecipitationRatewhere GPM is gallons perminute, and 96.25 is a constantthat converts cubic inches ofwater to inches per hour. Headspacing is the distance betweensprinkler heads and row spacingis the distance between rows ofsprinklers, (see Figure 1).For sprinklers with odd arcs,use the following formula:=(GPM for 360˚ sprinkler) x 96.25Head Spacing (ft.) x Row Spacing (ft.)34650 x GPM (for any arc)Degrees of Arc x Head Spacing x Row SpacingTABLE 1POTENTIAL EVAPOTRANSPIRATION RATES*CLIMATE TYPE**DAILY LOSS(in inches)Cool Humid 0.10 - 0.15Cool Dry 0.15 - 0.20Warm Humid 0.15 - 0.20Warm Dry 0.20 - 0.25Hot Humid 0.20 - 0.30Hot Dry 0.30 - 0.40* These potential evapotranspiration rates are the maximumaverage ET rates for the climate types. Actual daily ET ratestypically are less than these values.** “Cool” applies to areas with average high temperatures in midsummerof under 70˚F. “Warm” refers to mid-summer highsbetween 70˚F and 90˚F. “Hot” indicates mid-summer averagesover 90˚F. Areas in which the average relative humidity is over50% in mid-summer qualify as “Humid,” while under 50% isconsidered “Dry”.FIGURE 1
Efficiency and UniformityUniformity, which is a componentof efficiency, is a measureof how evenly water is applied.Efficiency is a measure ofhow well the system is designed,installed and managed.Many factors influence theefficiency and uniformity of asystem. The best equipment forthe situation must be selected,and proper maintenance proceduresmust be followed, or thesystem cannot perform at peakefficiency. A system can havegood uniformity and still beinefficient. However a systemwith poor uniformity can notbe efficient.Properly designed and maintainedturf sprinkler systemscould have efficiency ratings ashigh as 80%. Poorly designedand maintained systems canhave efficiencies of 40% orlower. Most systems fall intothe 50% to 70% range. Forour examples, we will assumean approximate efficiency of65%.Restricted <strong>Irrigation</strong>Hours or DaysMany sites have restrictionson when irrigation can takeplace. For instance, schoolplaygrounds are usually wateredat night, recreational softballfields might be watered af-ter late evening games, and inlocales with watering restrictions,watering may be limitedto a narrow time window. Inaddition, the days of the weekon which irrigation can takeplace may be limited by wateringrestrictions, or by maintenanceschedules. These limitationswill have the effect of eitherincreasing or decreasingstation run times.Crop CoefficientThis factor takes into accountthe various moistureneeds of different vegetationtypes. Table 2 supplies cropcoefficientfigures. For example,if watering warm seasonturf you may use 0.70. If youwere watering small shrubs youmight use 1.00.Soil TextureThe soil texture affects therate at which water can be absorbedwithout runoff (seeTable 3). The texture and soildepth also determine the abilityof the soil to retain moisture(see Table 4). This is becausesoils composed of large particles,such as sand, have lesscombined surface area for thewater to “cling” to, while soilscomposed of smaller particles,such as clays, have more surfacearea and hold waterlonger.Further, if your soil is poorand you add a soil amendmentto it, this treatment is effectiveonly to the depth the amendmentis mixed into the soil. Forexample, adding peat moss to asandy loam and tilling it to adepth of six inches benefits onlythe top six inches of the soil.Therefore, the moisture-holdingability of the top six inches ofsoil will be different than thenext six inches of soil.VEGETATION TYPECROP COEFFICIENT (K C)TABLE 3TABLE 2COEFFICIENTMature Trees 0.80Vines & Shrubs (taller than 4 ft.) 0.70Small Shrubs (smaller than 4 ft.) 1.00TURF:Warm Season 0.50-0.70Cool Season 0.60-0.80Arid Climate Natives 0.35MOISTURE AVAILABLE(in inches per foot of soil depth)AVERAGE IN./FT.SOIL TYPESOIL DEPTHSand 0.75Sandy Loam 1.25Loam 2.00Silt Loam 2.25Clay Loam 1.85Clay 1.25Adapted from Fundamentals of Soil Science, by Henry D. Foth, 6th ed.TABLE 4MAXIMUM PRECIPITATION RATES (INCHES PER HOUR):SOIL TEXTURE0 to 5% slope 5 to 8% slope 8 to 12% slope 12% + slopeCoverBareCoverBareCoverBareCoverBareCoarse sandy soils2.002.002.001.501.501.001.000.50Coarse sandy soils over compact subsoils1.751.501.251.001.000.750.750.40Uniform light sandy loams1.751.001.250.801.000.600.750.40Light sandy loams over compact subsoils1.250.751.000.500.750.400.500.30Uniform silt loams1.000.500.800.400.600.300.400.20Silt loams over compact subsoil0.600.300.500.250.400.150.300.10Heavy clay or clay loam0.200.150.150.100.120.080.100.06
Root DepthThe approximate root depth,combined with the soil texture,determines the “bank” of availablemoisture from which theplants can draw. With moremoisture held in the soil, plantscan survive longer without irrigation.For example, a sandyloam, three feet deep, couldstore 3.75 inches of water inreserve for the plants: 3 ft. x1.25 in./ft. (from Table 4) =3.75 in. However, if the rootsystem of the plants is only 18inches deep, then calculation ofthe available moisture must bebased on 18 inches of soil, regardlessof the actual soildepth.Unusual ConditionsThe effects of atypical conditionsalso should be considered.For example, in extremelyshady areas the ET rate is reduced,while in windy areas itis increased. Also, since waterobeys the law of gravity, themoisture content of soil at thetop of a slope is depleted morequickly than at the bottom.Calculating the<strong>Irrigation</strong> TimeNow considering all of thesefactors, the optimum irrigationtime is determined using thefollowing formula:T =60 x ET x KcPR x EAwhere T is the irrigation timein minutes, ET is the evapotranspirationrate, Kc is thecrop coefficient, PR is the precipitationrate, and EA is theapplication efficiency.With this simple calculation,it is possible to determine efficientirrigation schedules thatdo not waste our most preciousnatural resource.Various sources were consultedwhile preparing this document;contact <strong>Hunter</strong> <strong>Industries</strong> if youdesire bibliographic information.EXAMPLE 1A valve in your system is irrigating warm-season turf. The average precipitation rate is 0.49 in./hr. The system islocated in San Diego, CA. The daily moisture loss (ET) to be replenished is 0.20 inches. The system has an applicationefficiency of 65%. The soil is sandy loam. Calculate the daily irrigation time for the zone.The formula is: T=60 x ET x KcT=60 x 0.20 x 0.70PR x EA0.49 x 0.65=8.40.32= 26 minutes run timeThis is the total necessary irrigation time each day; however, the time could be split into cycles to avoid runoff. Tocalculate the run time for a weekly period in which you have only five days to water, assuming no rain has fallen,and using the same ET rate, use the formula:As run times become longer, it becomes more important to split the daily irrigation time into cycles to avoid runoff.T =daily run time (minutes) x 75T = 26 x 75= 36 minutes for 5 days a weekEXAMPLE 2A valve in your system is irrigating cool-season turf. The average precipitation rate is 1.6 in./hr. The system islocated in Norfolk, VA, and the ET rate is 0.15 in. The system has an application efficiency of 65%. The soil isclay loam. Calculate the daily irrigation time for the zone.The formula is: T=60 x ET x KcPR x EASeven minutes is the irrigation time required each day.T=60 x 0.15 x 0.801.6 x 0.65= 7.21.04= 6.9 minutes run time
<strong>Hunter</strong> <strong>Industries</strong> Incorporated • The <strong>Irrigation</strong> Innovators P/N 7002781940 Diamond St. • San Marcos, California 92069 • U.S.A. • TEL: (1) 760-744-5240 • FAX: (1) 760-744-7461 <strong>LIT</strong>-<strong>088</strong>.PDF 5/99