helen mba _2 - Nelson Mandela Metropolitan University
helen mba _2 - Nelson Mandela Metropolitan University
helen mba _2 - Nelson Mandela Metropolitan University

Create successful ePaper yourself
Turn your PDF publications into a flip-book with our unique Google optimized e-Paper software.
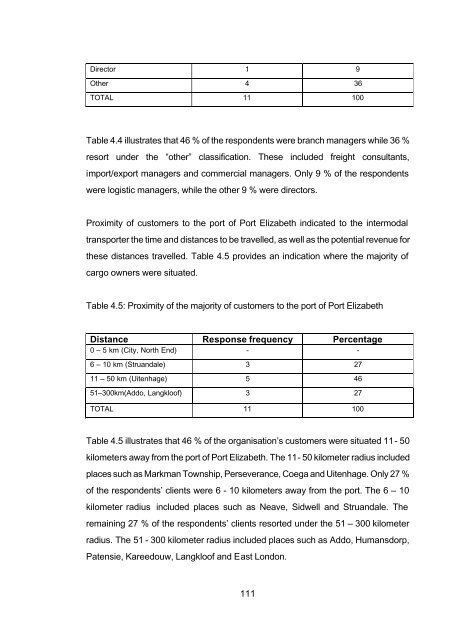
Director 1 9Other 4 36TOTAL 11 100Table 4.4 illustrates that 46 % of the respondents were branch managers while 36 %resort under the “other” classification. These included freight consultants,import/export managers and commercial managers. Only 9 % of the respondentswere logistic managers, while the other 9 % were directors.Proximity of customers to the port of Port Elizabeth indicated to the intermodaltransporter the time and distances to be travelled, as well as the potential revenue forthese distances travelled. Table 4.5 provides an indication where the majority ofcargo owners were situated.Table 4.5: Proximity of the majority of customers to the port of Port ElizabethDistance Response frequency Percentage0 – 5 km (City, North End) - -6 – 10 km (Struandale) 3 2711 – 50 km (Uitenhage) 5 4651–300km(Addo, Langkloof) 3 27TOTAL 11 100Table 4.5 illustrates that 46 % of the organisation’s customers were situated 11 - 50kilometers away from the port of Port Elizabeth. The 11 - 50 kilometer radius includedplaces such as Markman Township, Perseverance, Coega and Uitenhage. Only 27 %of the respondents’ clients were 6 - 10 kilometers away from the port. The 6 – 10kilometer radius included places such as Neave, Sidwell and Struandale. Theremaining 27 % of the respondents’ clients resorted under the 51 – 300 kilometerradius. The 51 - 300 kilometer radius included places such as Addo, Humansdorp,Patensie, Kareedouw, Langkloof and East London.111