air pollution control system upgrade at tubatse ... - Pyro.co.za
air pollution control system upgrade at tubatse ... - Pyro.co.za
air pollution control system upgrade at tubatse ... - Pyro.co.za

You also want an ePaper? Increase the reach of your titles
YUMPU automatically turns print PDFs into web optimized ePapers that Google loves.
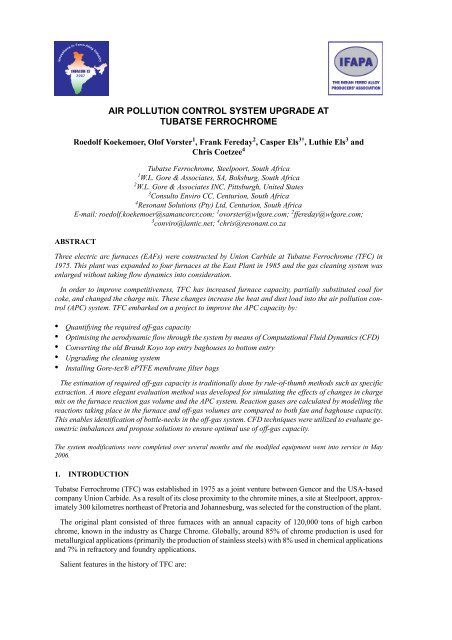
AIR POLLUTION CONTROL SYSTEM UPGRADE ATTUBATSE FERROCHROMERoedolf Koekemoer, Olof Vorster 1 , Frank Fereday 2 , Casper Els 3† , Luthie Els 3 andChris Coetzee 4Tub<strong>at</strong>se Ferrochrome, Steelpoort, South Africa1 W.L. Gore & Associ<strong>at</strong>es, SA, Boksburg, South Africa2 W.L. Gore & Associ<strong>at</strong>es INC, Pittsburgh, United St<strong>at</strong>es3 Consulto Enviro CC, Centurion, South Africa4 Resonant Solutions (Pty) Ltd, Centurion, South AfricaE-mail: roedolf.koekemoer@saman<strong>co</strong>rcr.<strong>co</strong>m; 1 ovorster@wlgore.<strong>co</strong>m; 2 ffereday@wlgore.<strong>co</strong>m;3 <strong>co</strong>nviro@lantic.net; 4 chris@resonant.<strong>co</strong>.<strong>za</strong>ABSTRACTThree electric arc furnaces (EAFs) were <strong>co</strong>nstructed by Union Carbide <strong>at</strong> Tub<strong>at</strong>se Ferrochrome (TFC) in1975. This plant was expanded to four furnaces <strong>at</strong> the East Plant in 1985 and the gas cleaning <strong>system</strong> wasenlarged without taking flow dynamics into <strong>co</strong>nsider<strong>at</strong>ion.In order to improve <strong>co</strong>mpetitiveness, TFC has increased furnace capacity, partially substituted <strong>co</strong>al for<strong>co</strong>ke, and changed the charge mix. These changes increase the he<strong>at</strong> and dust load into the <strong>air</strong> <strong>pollution</strong> <strong><strong>co</strong>ntrol</strong>(APC) <strong>system</strong>. TFC embarked on a project to improve the APC capacity by:• Quantifying the required off-gas capacity• Optimising the aerodynamic flow through the <strong>system</strong> by means of Comput<strong>at</strong>ional Fluid Dynamics (CFD)• Converting the old Brandt Koyo top entry baghouses to bottom entry• Upgrading the cleaning <strong>system</strong>• Installing Gore-tex® ePTFE membrane filter bagsThe estim<strong>at</strong>ion of required off-gas capacity is traditionally done by rule-of-thumb methods such as specificextraction. A more elegant evalu<strong>at</strong>ion method was developed for simul<strong>at</strong>ing the effects of changes in chargemix on the furnace reaction gas volume and the APC <strong>system</strong>. Reaction gases are calcul<strong>at</strong>ed by modelling thereactions taking place in the furnace and off-gas volumes are <strong>co</strong>mpared to both fan and baghouse capacity.This enables identific<strong>at</strong>ion of bottle-necks in the off-gas <strong>system</strong>. CFD techniques were utilized to evalu<strong>at</strong>e geometricimbalances and propose solutions to ensure optimal use of off-gas capacity.The <strong>system</strong> modific<strong>at</strong>ions were <strong>co</strong>mpleted over several months and the modified equipment went into service in May2006.1. INTRODUCTIONTub<strong>at</strong>se Ferrochrome (TFC) was established in 1975 as a joint venture between Gen<strong>co</strong>r and the USA-based<strong>co</strong>mpany Union Carbide. As a result of its close proximity to the chromite mines, a site <strong>at</strong> Steelpoort, approxim<strong>at</strong>ely300 kilometres northeast of Pretoria and Johannesburg, was selected for the <strong>co</strong>nstruction of the plant.The original plant <strong>co</strong>nsisted of three furnaces with an annual capacity of 120,000 tons of high carbonchrome, known in the industry as Charge Chrome. Globally, around 85% of chrome production is used formetallurgical applic<strong>at</strong>ions (primarily the production of stainless steels) with 8% used in chemical applic<strong>at</strong>ionsand 7% in refractory and foundry applic<strong>at</strong>ions.Salient fe<strong>at</strong>ures in the history of TFC are:
436 INFACON XI• 1985: Saman<strong>co</strong>r bought the Union Carbide shareholding in Tub<strong>at</strong>se Ferrochrome.• 1988 to 1990: Expansion of plant capacity to 300,000 tons (5 furnaces).• 1993: Joint venture established with Nippon Denko and addition of 6 th furnace.• 1997: Billiton acquired <strong><strong>co</strong>ntrol</strong>• 2002: Erection of a Pelletising and Sintering plant (520 000 tons per annum) to pelletise and sinter chromitefines. Introducing pellets into the submerged arc furnaces lowers the specific energy <strong>co</strong>nsumptionby improving bed permeability and metallurgical changes achieved through the sintering process.• 2005: TFC sold to the Kermas Group. The Kermas Group is a producer of and trader in ferrochrome andchrome chemicals, with activities in Russia, Germany and Turkey.TFC made the following modific<strong>at</strong>ions to improve furnace ventil<strong>at</strong>ion:• Converting the existing baghouse from top bag gas entry to the more <strong>co</strong>mmon bottom bag entry• Replacing the woven fiberglass bags with ePTFE membrane bags• Significant duct and plenum modific<strong>at</strong>ions based on Comput<strong>at</strong>ional Fluid Dynamic ModellingThe <strong>system</strong> modific<strong>at</strong>ions were <strong>co</strong>mpleted over several months and the modified equipment went into servicein May 2006. The result has been improved furnace evacu<strong>at</strong>ion preventing he<strong>at</strong> and fume from escapinginto the building.The layout of the off-gas handling <strong>system</strong> from Furnaces 1 to 4 is shown below.A brief <strong>system</strong> description after <strong>co</strong>nversion is:• Each of the furnaces extracts to a trombone<strong>co</strong>oler.• 4-off fans are installed after the <strong>co</strong>olers, onefor each furnace.• The fan inlets are interlinked by a headerduct.• A pressure type reverse <strong>air</strong> baghouse filtersoff-gas, with 2-off reverse <strong>air</strong> fans and 32-off<strong>co</strong>mpartments.• After <strong>co</strong>nversion each reverse <strong>air</strong> fan serves16-off <strong>co</strong>mpartments (one each for the Northernand Southern rows of <strong>co</strong>mpartments). Thereverse <strong>air</strong> fans discharge to the risers on thepressure side of the fans (vs current dischargeto the fan inlets).Furnace 1Furnace 2Trombone <strong>co</strong>olerTrombone <strong>co</strong>olerFanR/A fanFanR/A fan2. APC SYSTEM DESIGN REVIEWA design review was done on <strong>upgrade</strong> options forthe East plant (4 furnaces) off-gas <strong>system</strong>. Objectivesof the study included determining the requiredextraction <strong>system</strong> capacity as well as the<strong>system</strong> design and oper<strong>at</strong>ional weaknesses.Furnace 3Furnace 4Trombone <strong>co</strong>olerTrombone <strong>co</strong>olerFanFanBaghouse <strong>co</strong>mpartments2.1 Design Methods Generally UsedFigure 1: APC <strong>system</strong> layoutIn the past, off-gas <strong>system</strong> sizing was done using Specific Extraction (SE) d<strong>at</strong>a, which st<strong>at</strong>es extraction (Nm 3 /h) per furnace energy input (kW), i.e. Nm 3 /h/kW. Specific extraction was benchmarked by visually checkingif a furnace is adequ<strong>at</strong>ely ventil<strong>at</strong>ed and then extrapol<strong>at</strong>ing the SE value to other plants and industries. DesignSE values were for example <strong>co</strong>mpared for various Saman<strong>co</strong>r plants by Wall [1]. Rentz [2] did extensive work
Air Pollution Control System Upgrade <strong>at</strong> Tub<strong>at</strong>se Ferrochrome 437on reducing emissions from Ferroalloy furnaces and i.a. established required SE values for various feed m<strong>at</strong>erialprepar<strong>at</strong>ion regimes.A more sophistic<strong>at</strong>ed method of sizing baghouse equipment is based on furnace he<strong>at</strong> extraction requirements– sometimes referred to as the “X” factor. Ac<strong>co</strong>rding to this method, the he<strong>at</strong> <strong>co</strong>ntent of the submergedarc furnace exhaust gas is directly proportional to the furnace load (influenced by the amount and type of rawm<strong>at</strong>erials and furnace oper<strong>at</strong>ion). The r<strong>at</strong>io of Exhaust Gas He<strong>at</strong> to Furnace Power input yields the “X” factor.Therefore, the rel<strong>at</strong>ionship can be written as follows:Q = X × kW = m × C ×[ T − Th ambWhere Q is the he<strong>at</strong> <strong>co</strong>ntent of the furnace exhaust gas, X is the r<strong>at</strong>io of furnace off gas he<strong>at</strong> to furnace powerinput, m is the mass flow, T h is the hood exhaust gas temper<strong>at</strong>ure and T amb is the ambient temper<strong>at</strong>ure of the<strong>air</strong> drawn into the hood.The X factor is unique for each applic<strong>at</strong>ion and is affected by furnace oper<strong>at</strong>ing <strong>co</strong>nditions and the make upof the charge mix. Factors th<strong>at</strong> can influence the X factor include furnace energy <strong>co</strong>nsumption per alloy ton,fixed carbon in the charge mix, vol<strong>at</strong>ile m<strong>at</strong>ter in the charge mix, w<strong>at</strong>er <strong>co</strong>ntent in the charge mix, reducingagent required per alloy ton and metal re<strong>co</strong>very from the raw ore feed.Typical X values for some <strong>co</strong>mmon ferroalloy processes are 1.3 for Si-Metal, 1.1 for 75% FeSi, 1.0 forSiMn and 0.7 for FeCr.The X factor is normally estim<strong>at</strong>ed from experience, based on field testing and visual observ<strong>at</strong>ions sinceeach applic<strong>at</strong>ion is unique. If he<strong>at</strong> and fume are spilling from the hood during the field testing the furnace he<strong>at</strong>extraction is not adequ<strong>at</strong>e and provisions must be made to increase the furnace draft.2.2 Furnace Reaction Gas Modellingp]In response to problems with above methods in adequ<strong>at</strong>ely estim<strong>at</strong>ing the effect of various process and oper<strong>at</strong>ionalfactors on design of APC <strong>system</strong>s, a more thoroughly process-based method was developed. Furnacereaction gas modelling is done in two steps: furnace reaction gas is estim<strong>at</strong>ed by doing a carbon balance overthe furnace, whereafter the reaction gas is <strong>co</strong>mbusted and diluted with ambient <strong>air</strong>. Varying amounts of dilution<strong>air</strong> are used to calcul<strong>at</strong>e off-gas temper<strong>at</strong>ures <strong>at</strong> the furnace and baghouse inlet.The reaction gas is the gas evolved from the reactions in the b<strong>at</strong>h between ore and reductant as well as vol<strong>at</strong>ilesreleased by the reductant. Details of how the reaction gas is estim<strong>at</strong>ed are given below:• Carbon in the reductant is handled in one of three ways: fixed carbon is assumed to react with ore in theb<strong>at</strong>h, producing carbon monoxide, excess fixed carbon is assumed to be released into the off-gas as purecarbon and is <strong>co</strong>mbusted in the next phase. Part of the carbon <strong>co</strong>ntained in the vol<strong>at</strong>iles is assumed to be<strong>co</strong>mbusted to carbon monoxide by oxygen <strong>co</strong>ntained in the <strong>co</strong>al. The remainder is assumed to <strong>co</strong>me offas carbon for l<strong>at</strong>er <strong>co</strong>mbustion.• Hydrogen in the reductants is assumed to <strong>co</strong>me off as H 2 .• Moisture in the reductants and ore is assumed to report to the gas phase as H 2 O and is not dissoci<strong>at</strong>ed tooxygen and hydrogen.• Wh<strong>at</strong>ever nitrogen there is in the reductants is assumed to report to the gas phase.Carbon, carbon monoxide and hydrogen in the reaction gas (calcul<strong>at</strong>ed above) are <strong>co</strong>mbusted with <strong>air</strong> assumedto be drawn into the furnace hood, providing an off-gas temper<strong>at</strong>ure after <strong>co</strong>mbustion and dilution.He<strong>at</strong> loss <strong>at</strong> the furnace ducting and trombone <strong>co</strong>oler is calcul<strong>at</strong>ed to determine the baghouse inlet gas temper<strong>at</strong>ureand volume flow based on off-gas volumes and temper<strong>at</strong>ures calcul<strong>at</strong>ed with the above carbon massbalance. A standard trombone <strong>co</strong>oler design procedure was used, as proposed in the EPA’s Air Pollution EngineeringManual[3]. The calcul<strong>at</strong>ion model makes use of <strong>co</strong>rrel<strong>at</strong>ions by Sieder and T<strong>at</strong>e[4] for <strong>co</strong>nvection
438 INFACON XIhe<strong>at</strong> transfer on the trombone <strong>co</strong>oler tube inside, McAdams[5] for radi<strong>at</strong>ion he<strong>at</strong> transfer and McAdams[5]for <strong>co</strong>nvection he<strong>at</strong> transfer on the trombone <strong>co</strong>oler tube outside.2.3 Furnace Oper<strong>at</strong>ing Base D<strong>at</strong>aFurnace design power input is 28MW for Furnaces 1 to 3 and 32MW for Furnace 4. Reductants fed to thefurnaces include <strong>co</strong>al, <strong>co</strong>ke and anthracite. The fixed carbon requirement is made up of 60% <strong>co</strong>ke, 20% anthraciteand 20% <strong>co</strong>al. Approxim<strong>at</strong>ely 63% of ferrochrome feed m<strong>at</strong>erial is in the form of pellets, with 32%lumpy ore and 15% <strong>co</strong>ncentr<strong>at</strong>e. Quartz and dolomite are fed as fluxes.2.4 Design criteria and AssumptionsThe criteria used for off-gas <strong>system</strong> design are th<strong>at</strong>, <strong>at</strong> the design off-gas volume, furnace hood temper<strong>at</strong>uremust be below 450°C and baghouse inlet temper<strong>at</strong>ure has to be kept below 240°C. The furnace hood temper<strong>at</strong>urelimit ensures th<strong>at</strong> equipment in the furnace roof is not exposed to high temper<strong>at</strong>ures which result in shortworking life. The criterion is kept rel<strong>at</strong>ively low <strong>at</strong> 450°C, as radi<strong>at</strong>ion he<strong>at</strong> caused by running a furnace withan open b<strong>at</strong>h can boost temper<strong>at</strong>ures significantly. The baghouse inlet temper<strong>at</strong>ure limit ensures th<strong>at</strong> bags arenot exposed to over-temper<strong>at</strong>ure.In reality, one finds th<strong>at</strong> temper<strong>at</strong>ures measured on site differ from modelling calcul<strong>at</strong>ion values in th<strong>at</strong> furnacehood temper<strong>at</strong>ures tend to be a bit higher, caused by radi<strong>at</strong>ion he<strong>at</strong>, while in-leakage of ambient <strong>air</strong> alongthe off-gas <strong>system</strong> causes furnace hood temper<strong>at</strong>ures to be still somewh<strong>at</strong> higher (less gas is actually extractedfrom the furnace) and baghouse inlet temper<strong>at</strong>ure to be lower (further dilution <strong>air</strong> is introduced by in-leakage).2.5 Off-gas Estim<strong>at</strong>ion Results2.5.1 Individual FurnacesThe furnace off-gas <strong>co</strong>nditions <strong>at</strong> furnaces 1 to 3 (28MW) and furnace 4 (32MW) were estim<strong>at</strong>ed for a baghouseinlet temper<strong>at</strong>ure of 220°C. The values are summarised in table 1 below.Table 1: Off-gas estim<strong>at</strong>ion resultsFurnaces 1 to 3 Furnace 4Parameter Unit Value Parameter Unit ValueReaction gas kg/h 7443 Reaction gas kg/h 8090Furnace off-gas temper<strong>at</strong>ure °C 403 Furnace off-gas temper<strong>at</strong>ure °C 379Furnace off-gas volume Am 3 /s 113.5 Furnace off-gas volume Am 3 /s 136Normalised volume Nm 3 /s 42.3 Normalised volume Nm 3 /s 49.9Baghouse inlet temper<strong>at</strong>ure °C 220 Baghouse inlet temper<strong>at</strong>ure °C 220Baghouse volume Am 3 /s 82.8 Baghouse volume Am 3 /s 97.7% CO 2 % (v/v) 3.73 % CO 2 % (v/v) 3.44X-factor 0.80 X-factor 0.77Specific extraction Nm 3 /h/kW 5.44 Specific extraction Nm 3 /h/kW 5.62At furnace 1 to 3, <strong>at</strong> a baghouse normalised flow of 42.3Nm 3 /s, a furnace off-gas temper<strong>at</strong>ure of 403°C anda baghouse inlet temper<strong>at</strong>ure of 220°C is predicted. At furnace 4, <strong>at</strong> a baghouse normalised flow of 49.9Nm 3 /s, a furnace off-gas temper<strong>at</strong>ure of 379°C and a baghouse inlet temper<strong>at</strong>ure of 220°C is predicted.To indic<strong>at</strong>e the effect of varying furnace off-gas volume on off-gas temper<strong>at</strong>ures, the temper<strong>at</strong>ures were calcul<strong>at</strong>edover a range of volumes. Figures 2 and 3 give furnace off-gas and baghouse inlet temper<strong>at</strong>ures forvarying off-gas volumes. The above results form a single point on each of the curves.
Air Pollution Control System Upgrade <strong>at</strong> Tub<strong>at</strong>se Ferrochrome 439The baghouse temper<strong>at</strong>ure line can be seen as the process extraction requirement – i.e. wh<strong>at</strong> baghouse temper<strong>at</strong>uresare produced by the process <strong>at</strong> which extraction volumes. The line does not give any clues as to <strong>at</strong>which temper<strong>at</strong>ure the APC <strong>system</strong> will oper<strong>at</strong>e. To obtain the oper<strong>at</strong>ing point, the fan(s) and baghouse capacitieshave to be <strong>co</strong>mpared with the process extraction requirement. On the graph, two further curves areplotted: fan and baghouse normalised extraction capacity as a function of temper<strong>at</strong>ure. The fan capacity curveis estim<strong>at</strong>ed by using the design fan curve and taking into ac<strong>co</strong>unt the effect of gas density on fan performance.Fan laws are used to adjust the fan performance ac<strong>co</strong>rdingly. The baghouse capacity curve is estim<strong>at</strong>edby taking the design actual filter volume and <strong>at</strong> each temper<strong>at</strong>ure calcul<strong>at</strong>ing the <strong>co</strong>rresponding normalisedvolume for a <strong>co</strong>nstant actual inlet volume (i.e. to ensure th<strong>at</strong> the actual baghouse volume remains <strong>co</strong>nstant).1000950Temper<strong>at</strong>ure, °C90085080075070065060055050045040035030025020015010050BaghousecapacityFan capacityBaghousetemper<strong>at</strong>ureFurnace hood temper<strong>at</strong>ure220°C lineOper<strong>at</strong>ingpoint010 15 20 25 30 35 40 45 50 55 60Volume, Nm 3 /sFigure 2: Extraction volume vs Temper<strong>at</strong>ure – Furnaces 1, 2 or 31000950Temper<strong>at</strong>ure, °C900Furnace hood temper<strong>at</strong>ure850800 Baghousecapacity750700650600 Fan capacity550500450Baghouse400temper<strong>at</strong>ure350300250220°C line200150Oper<strong>at</strong>ing100point50010 15 20 25 30 35 40 45 50 55 60Volume, Nm 3 /sFigure 3: Extraction volume vs Temper<strong>at</strong>ure – Furnaces 4
440 INFACON XIThe range of temper<strong>at</strong>ures for varying off-gas volumes can be appreci<strong>at</strong>ed from the graphs, as can the importanceof maintaining the off-gas <strong>system</strong> in good <strong>co</strong>ndition: decreasing volumes result in rapidly increasingfurnace hood temper<strong>at</strong>ures as well as baghouse inlet temper<strong>at</strong>ures.In order to <strong>co</strong>mpare process requirement with fan and baghouse capacities, the baghouse and fan capacityare viewed vs the baghouse temper<strong>at</strong>ure curve. If the baghouse and fan capacity curves are above the baghousetemper<strong>at</strong>ure curve, then the off-gas <strong>system</strong> (fan and baghouse) have sufficient capacity to adequ<strong>at</strong>elyventil<strong>at</strong>e the <strong>system</strong>. The first point of intersection of the fan or baghouse capacity curve with the baghousetemper<strong>at</strong>ure curve shows the maximum off-gas oper<strong>at</strong>ing capacity. If the above point of intersection is <strong>at</strong> anormalised volume where both the baghouse temper<strong>at</strong>ure and the furnace temper<strong>at</strong>ure are within design criteria,then the off-gas <strong>system</strong> is adequ<strong>at</strong>ely sized for the applic<strong>at</strong>ion.For furnaces 1 to 3, the point of intersection of the baghouse capacity curve with the baghouse temper<strong>at</strong>urecurve is <strong>at</strong> 45Nm 3 /s. At this volume, the furnace temper<strong>at</strong>ure is below 400°C and the baghouse temper<strong>at</strong>urebelow 220°C. The <strong>co</strong>nclusion from the curve is therefore th<strong>at</strong> the off-gas <strong>system</strong> has sufficient capacity forthe applic<strong>at</strong>ion.For furnace 4, the baghouse capacity curve is the first to intersect with the baghouse temper<strong>at</strong>ure curve –i.e. the baghouse capacity is limiting. The point of intersection is <strong>at</strong> a baghouse temper<strong>at</strong>ure of 233°C, whichis above the oper<strong>at</strong>ing guideline of 220°C. The fan capacity intersects the baghouse temper<strong>at</strong>ure curve <strong>at</strong>223°C, which is marginally above the oper<strong>at</strong>ing guideline. The <strong>co</strong>nclusion drawn from the curve is th<strong>at</strong> thebaghouse capacity is limiting and the <strong>system</strong> will not be able to oper<strong>at</strong>e <strong>at</strong> 220°C.However, furnace 4 does not oper<strong>at</strong>e in isol<strong>at</strong>ion and the <strong>co</strong>mbined effect of all 4 furnaces on the fans andthe baghouse was viewed.2.5.2 Combined APC System ModellingThe graph below <strong>co</strong>mbines the process impact of the four furnaces and the capacities of the 4-off fans and 32-off baghouse <strong>co</strong>mpartments. Curves shown are <strong>co</strong>mbined average furnace temper<strong>at</strong>ure (all 4 furnaces), <strong>co</strong>m-1000950900Temper<strong>at</strong>ure, °C85080075070065060055050045040035030025020015010050BaghousecapacityBaghousetemper<strong>at</strong>ureFan capacity220°C lineFurnace hood temper<strong>at</strong>ureOper<strong>at</strong>ingpointOper<strong>at</strong>ing range050 60 70 80 90 100 110 120 130 140 150 160 170 180 190 200Volume, Nm 3 /sFigure 4: Combined Furnaces Extraction volume vs Temper<strong>at</strong>ure
Air Pollution Control System Upgrade <strong>at</strong> Tub<strong>at</strong>se Ferrochrome 441bined average baghouse temper<strong>at</strong>ure (total baghouse), baghouse capacity curve for all 32 <strong>co</strong>mpartments and<strong>co</strong>mbined fan capacity curve for all 4 fans. To indic<strong>at</strong>e the impact of <strong>system</strong> in-leakage, a 5% <strong>air</strong> in-leak wasassumed close to the fans.The <strong>co</strong>mbined graph indic<strong>at</strong>es the following:• At a total extraction volume of 170Nm 3 /s, a baghouse inlet temper<strong>at</strong>ure of 220°C is achieved.• The furnace stack temper<strong>at</strong>ure can be maintained <strong>at</strong> 420°C <strong>at</strong> this extraction volume.• The fan and baghouse capacity is sufficient to oper<strong>at</strong>e <strong>at</strong> 170Nm 3 /s <strong>at</strong> a temper<strong>at</strong>ure of 220°C.• The specific extraction required is 5.5Nm 3 /h / kW with an X-factor of 0.79.• Installed baghouse and fan design capacities (after baghouse <strong>co</strong>nversion) are sufficient to achieve therequired extraction volume.The effect of in-leakage on the <strong>system</strong> was to establish an oper<strong>at</strong>ing range: without in-leakage a volume of177Nm 3 /s is required to main a baghouse inlet temper<strong>at</strong>ure of 220°C. The neg<strong>at</strong>ive effect of in-leakage is th<strong>at</strong>furnace off-gas temper<strong>at</strong>ures rise with increasing in-leakage down the line. The average furnace off-gas temper<strong>at</strong>ureincreased from 400°C <strong>at</strong> 177 Nm 3 /s to 420°C <strong>at</strong> 170 Nm 3 /s.3 AERODYNAMIC OPTIMISATION AND BAGHOUSE CONVERSIONIn the not so distant past <strong>co</strong>mput<strong>at</strong>ional fluid dynamics (CFD) was restricted to very powerful <strong>co</strong>mputers andhighly specialized users. The quantum leap in <strong>co</strong>mputer processing power has made CFD analysis accessibleto the engineering industry in general as opposed to the NASAs of the world.TFC is one of the enlightened <strong>co</strong>mpanies th<strong>at</strong> used this quantum leap in technology to their benefit to optimizethe aerodynamic flow through their gas cleaning <strong>system</strong>. A number of proposed ducting layout modific<strong>at</strong>ionswere simul<strong>at</strong>ed in EFD.Lab 6.0 to find an optimized/balanced resistance through the <strong>system</strong>. An optimized<strong>system</strong> will result in an increase in production capacity and a balanced <strong>system</strong> will ensure uniform wearthrough the <strong>system</strong> and ultim<strong>at</strong>ely longer oper<strong>at</strong>ional life. With the addition of furnace 4 in the 1980s flowdynamics was not taken into <strong>co</strong>nsider<strong>at</strong>ion as can be seen from the increased pressure drop through furnaceFigure 5: Baghouse inlet duct <strong>co</strong>nfigur<strong>at</strong>ion: before
442 INFACON XI4 in Table 1. The difference in pressure drop was due to the addition of bends not present in furnaces 1-3. Theproposed optimized layout <strong>co</strong>nsisted of four new ducts th<strong>at</strong> will result in flow symmetry as indic<strong>at</strong>ed by thepressure drop in Table 1. The unbalance in the <strong>system</strong> was therefore reduced from 417Pa to less than 21Pa.Due to the fact th<strong>at</strong> numerous simul<strong>at</strong>ions can be performed in a rel<strong>at</strong>ively short time, the design can be optimizedbefore <strong>co</strong>nstruction starts. CFD makes up only a fraction of the total project <strong>co</strong>st, yet it <strong>co</strong>uld resultin significant improvement of profits due to higher efficiency and lower maintenance <strong>co</strong>sts to the <strong>system</strong>.Figure 6: Baghouse inlet duct <strong>co</strong>nfigur<strong>at</strong>ion: afterTable 2: Ducting pressure drop before and after modific<strong>at</strong>ionLoc<strong>at</strong>ion Pressure Drop Before (Pa) Pressure Drop After (Pa)Furnace 1 553 452Furnace 2 561 469Furnace 3 451 455Furnace 4 868 449With the new bottom entry <strong>co</strong>nversion the gas was directed into the hopper and through the bags as opposedto through the bags and into the hopper with the original design. A CFD simul<strong>at</strong>ion was done to ensure uniformflow into the hopper and ultim<strong>at</strong>ely entering the bags. This avoids velocity abrasion of the filter bagsand re-entrainment of dust from the hopper. The following two pictures illustr<strong>at</strong>e the velocity profile throughthe new ducting as well as the hopper before entering the bags.4. CLEANING SYSTEM UPGRADEThere are many factors th<strong>at</strong> affect the performance of a baghouse, especially the filter bags. Earlier experiencehas shown the following variables affect the pressure drop across the filter bags.• Dust gener<strong>at</strong>ion r<strong>at</strong>e• Humidity of the gas• Electrost<strong>at</strong>ic <strong>at</strong>traction between the bag and the dust• Bulk density of the dust• Dust particle size
Air Pollution Control System Upgrade <strong>at</strong> Tub<strong>at</strong>se Ferrochrome 443Figure 7: Flow distribution through hopperFigure 8: New bottom entry <strong>co</strong>nversion• Chemical <strong>co</strong>mposition of the dust• Filter velocity (the <strong>air</strong> to cloth r<strong>at</strong>io)• Effectiveness of the cleaning <strong>system</strong>While most of these factors are beyond the <strong><strong>co</strong>ntrol</strong> of the baghouse oper<strong>at</strong>or the effectiveness of the cleaning<strong>system</strong> can be improved by <strong>co</strong>mputerized <strong><strong>co</strong>ntrol</strong> of the cleaning cycle. This <strong>co</strong>mputerized technique is nowoften referred to as “smart cleaning”.There is direct rel<strong>at</strong>ionship between gas flow through the bags and the pressure drop across the bags duringreverse <strong>air</strong> cleaning. This is true up to a threshold point where the additional reverse <strong>air</strong> pressure does no moregood and needlessly increases the baghouse pressure drop since the reverse <strong>air</strong> must re-filtered by the on line<strong>co</strong>mpartments.Since each <strong>co</strong>mpartment is a different distance from the reverse <strong>air</strong> fan inlet and some <strong>co</strong>mpartments capturemore dust due to the inherent flow imbalance within the baghouse it is best to vary the reverse <strong>air</strong> volume tomaintain a <strong>co</strong>nsistent pressure drop across the bags during cleaning. The most practical approach in most casesis to use a variable speed drive (VSD) on the reverse <strong>air</strong> fan motor based on the output of a pressure <strong><strong>co</strong>ntrol</strong>loop. This requires each <strong>co</strong>mpartment to be fitted with a pressure transmitter to measure the tubesheet pressuredrop and for those signals to be logged by the baghouse programmable <strong><strong>co</strong>ntrol</strong>ler (PLC).If the pressure set point is not achieved the PLC signals the VSD to increase or decrease the motor speedthe next time th<strong>at</strong> particular <strong>co</strong>mpartment <strong>co</strong>mes up for cleaning. Attempts to readjust the reverse <strong>air</strong> fan motorspeed while the reverse <strong>air</strong> damper is open have not been successful.5. FILTER BAG REPLACEMENTTub<strong>at</strong>se previously utilized woven fiberglass filter bags. Fiberglass m<strong>at</strong>erial is known to have many advantages[7]:• Non <strong>co</strong>mbustible because it is <strong>co</strong>mpletely inorganic• Zero moisture absorption; therefore, it is not subject to hydrolysis• Dimensional stability (low <strong>co</strong>efficient of linear expansion)• Very high strength but poor resistance to flex and abrasion; however, there are chemical surface tre<strong>at</strong>mentsth<strong>at</strong> improve the flex and abrasion characteristics of fiberglass• Woven fiberglass can oper<strong>at</strong>e <strong>co</strong>ntinuously up to 260°C and depending on the surface tre<strong>at</strong>ment withstandup to 288°C for short periods.
444 INFACON XIPerson [8] has explained the rel<strong>at</strong>ively high filter drag of <strong>co</strong>nventional woven fiberglass m<strong>at</strong>erial when appliedto metallurgical fume. Additionally, one <strong>co</strong>uld reasonably expect higher particul<strong>at</strong>e emissions throughthe <strong>co</strong>nventional fiberglass filter media since the filter cake must be sacrificed to maintain <strong>air</strong>flow. Whilearamid m<strong>at</strong>erial (good to 204°C) in shaker cleaning applic<strong>at</strong>ions shows lower filter drag than woven fiberglassm<strong>at</strong>erial, there is limited experience with aramid in EAF baghouses. Furthermore, in the limited caseswhere aramid had been used in EAF applic<strong>at</strong>ions, the results have not been en<strong>co</strong>uraging.Eriksen [9] and Stordahl [10] reported th<strong>at</strong> GORE-TEX ® membrane/fiberglass filter media has substantiallylower filter drag than <strong>co</strong>nventional media in metallurgical fume applic<strong>at</strong>ions. Previous work by Hall, et al [11]demonstr<strong>at</strong>ed the improved filtr<strong>at</strong>ion efficiency of GORE-TEX ® membrane filter bags in a steel EAF applic<strong>at</strong>ion<strong>at</strong> British Steel when <strong>co</strong>mpared to the results with various woven synthetic filter media <strong>at</strong> the sameinstall<strong>at</strong>ion.Difference Between Conventional and Membrane Fabric Filtr<strong>at</strong>ion TechnologiesWhen fabric filter dust <strong>co</strong>llectors became a viable technology years ago, the available fabric filter media includedwool and <strong>co</strong>ttons, then progressed to polyester, aramid, fiberglass, etc. This method of filtr<strong>at</strong>ion wasand is referred to as <strong>co</strong>nventional depth filtr<strong>at</strong>ion. W. L. Gore & Associ<strong>at</strong>es, Inc. (Gore) introduced expandedpolytetrafluoroethylene (ePTFE) membrane surface filtr<strong>at</strong>ion, offering significant advantages over <strong>co</strong>nventionaldepth filtr<strong>at</strong>ion. The <strong>co</strong>mparison of these two filtr<strong>at</strong>ion methods has been explained a number of timesin the liter<strong>at</strong>ure including the paper by Yerkes [6] <strong>co</strong>mparing the performance of polyester and GORE-TEX ®filter bags <strong>at</strong> Corus Tuscaloosa Steel.200X 600X 200X 600XFigure 9: Scanning Electron Microphotograph: Fiberglass Fabric vs ePTFE MembraneThe lower filter drag typical of GORE-TEX ® membrane filters reduces the <strong>system</strong> resistance and allowsincreased gas flow through the baghouse. With proper inspection and maintenance, GORE-TEX ® membrane/acid resistant fiberglass fabric filter bags oper<strong>at</strong>e effectively for many years. In most cases, even after fiveyears, the GORE-TEX ® membrane filter bags do not show a drop in gas flow capability or filtering efficiency.Elverd, et al [6] documented the improved furnace evacu<strong>at</strong>ion, longer bag life, lower maintenance <strong>co</strong>st, anddecreased particul<strong>at</strong>e emissions <strong>at</strong> Tennessee Alloys Corpor<strong>at</strong>ion after the install<strong>at</strong>ion of GORE-TEX ® expandedPTFE (ePTFE) membrane/fiberglass filter bags in 1993. Substantially all of those filter bags werestill in service after eight years.W<strong>at</strong>er leaks are a <strong>co</strong>mmon problem in EAF fume tre<strong>at</strong>ment <strong>system</strong>s. These w<strong>at</strong>er leaks, if carried over tothe baghouse, will blind <strong>co</strong>nventional filter media in a short time period. Since the <strong>air</strong>flow through <strong>co</strong>nventionalmedia does not re<strong>co</strong>ver after an extended w<strong>at</strong>er leak, new bags are required. Due to the hydrophobic
Air Pollution Control System Upgrade <strong>at</strong> Tub<strong>at</strong>se Ferrochrome 445n<strong>at</strong>ure of the membrane, GORE-TEX ® membrane filter bags have proven their ability to re<strong>co</strong>ver from w<strong>at</strong>erleaks.GORE-TEX ® expanded PTFE (ePTFE) membrane/fiberglass filter bags offered TFC a <strong>co</strong>st-effective wayto deal with the demands of increased furnace productivity, leading to a higher required furnace extractionvolume to the <strong>system</strong>.6. CONCLUSIONSAt the time of writing (July 2006), Tub<strong>at</strong>se had restarted only the No 2 and No 4 furnaces. It was thus difficultto assess the whole <strong>system</strong> effectiveness. Initial indic<strong>at</strong>ions are, however, positive:• Emissions from the baghouse have been significantly reduced.• Pressure drops across the filter bags are as predicted during design.• Inlet temper<strong>at</strong>ures are lower, but this is due to in leakage of ambient <strong>air</strong> from the furnaces th<strong>at</strong> are stillidle.This paper makes a <strong>co</strong>ntribution by presenting Furnace Reaction Gas Modelling as an altern<strong>at</strong>ive to previouslyused design methods.DEDICATIONThis paper is dedic<strong>at</strong>ed to the memory of Casper Els who died on the 7 th of November 2006 after the initialpaper was submitted. His invaluable <strong>co</strong>ntribution to the field of <strong>air</strong> <strong>pollution</strong> <strong><strong>co</strong>ntrol</strong> is hereby acknowledged.REFERENCES[1] Wall, CD, “Interim report on dust plant r<strong>at</strong>ing Tub<strong>at</strong>se Furnaces 1 to 4”, 1998.[2] Rentz, O, “Emissionsverminderung bei Ferrlegierungen”, Karlsruhe, 1971.[3] US EPA, “Air Pollution Engineering Manual”, 2 nd Edition, Research Triangle Park, N.C., 1973.[4] Sieder, E.N. and T<strong>at</strong>e, G.E., “He<strong>at</strong> transfer and pressure drop of liquids in tubes”, Ind. Eng. Chem., 1936.[5] McAdams, W.H., “He<strong>at</strong> Transmission”, 2 nd Edition, McGraw-Hill Book Co Inc, New York, 1942.[6] Yerkes, J. E., Renfroe, J. T., Hosmer, W. M., Fereday, F., Kleine – Moellhoff, P., Sanders, S. M., “Benefits of HighTemper<strong>at</strong>ure Membrane Filter Media in the Tuscaloosa Baghouse”, Sixth European Electric Steelmaking Conference,1999.[7] McKenna, J. D. and Turner, J. H., Fabric Filter – Baghouses I Theory, Design, Selection, Valley Printers, ETS Inc.1998.[8] Person, R.A. “Current St<strong>at</strong>us of Ferroalloy Emission Controls”, Electric Furnace Conference Proceeding, Volume33, 1975.[9] Eriksen, E., “E<strong>co</strong>nomy and Development in Ferroalloy Dust Collection”, Electric Conference Proceedings, Volume43, 1985.[10] Stordahl, S., “Recent Developments in Elkem Pollution Control Technology”, The User and Fabric Filter EquipmentIV Proceedings, 1988, Toronto, Canada.[11] Hall, G.D., Pr<strong>at</strong>er, B.E., Taylor D.,Topham T.,”A Study of Electric Steelplant Baghouse Filtr<strong>at</strong>ion”, British SteelCorpor<strong>at</strong>ion, Swinden Labor<strong>at</strong>ories, Rotherham, S<strong>co</strong>tland, U.K., May 1991.