Fourth Grade Math Standards and Benchmarks
Fourth Grade Math Standards and Benchmarks
Fourth Grade Math Standards and Benchmarks

Create successful ePaper yourself
Turn your PDF publications into a flip-book with our unique Google optimized e-Paper software.
PerformanceObjective 4Use strategies to estimate computations involving fractions <strong>and</strong> decimals.<strong>Fourth</strong> <strong>Grade</strong> <strong>St<strong>and</strong>ards</strong> <strong>and</strong> <strong>Benchmarks</strong> Page 2
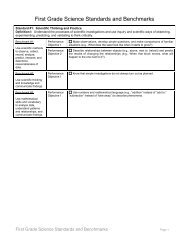
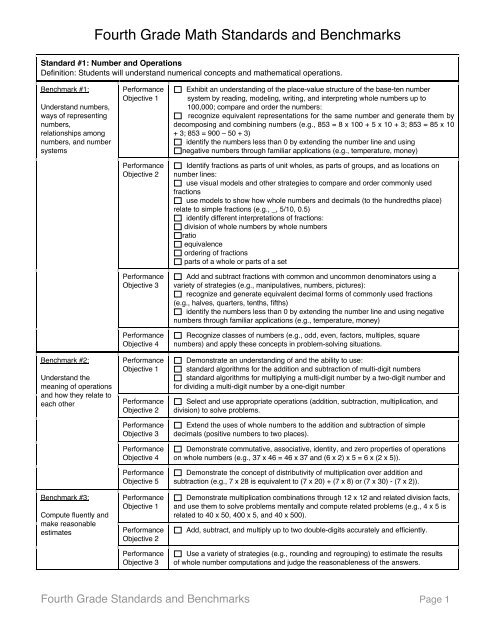
St<strong>and</strong>ard #2: AlgebraDefinition: Students will underst<strong>and</strong> algebraic concepts <strong>and</strong> applications.Benchmark #1:Underst<strong>and</strong> patterns,relations, <strong>and</strong>functionsBenchmark #2:Represent <strong>and</strong>analyze mathematicalsituations <strong>and</strong>structures usingalgebraic symbolsBenchmark #3:Use mathematicalmodels to represent<strong>and</strong> underst<strong>and</strong>quantitativerelationshipsBenchmark #4:Analyze changes invarious contextsPerformanceObjective 1PerformanceObjective 2PerformanceObjective 3PerformanceObjective 4PerformanceObjective 1PerformanceObjective 2PerformanceObjective 3PerformanceObjective 4PerformanceObjective 5PerformanceObjective 1PerformanceObjective 2PerformanceObjective 3PerformanceObjective 1PerformanceObjective 2PerformanceObjective 3PerformanceObjective 4Represent <strong>and</strong> analyze patterns <strong>and</strong> simple functions using words, tables, <strong>and</strong>graphs.Create <strong>and</strong> describe numeric <strong>and</strong> geometric patterns including multiplication <strong>and</strong>division patterns.Express mathematical relationships using equations.Use <strong>and</strong> interpret variables, mathematical symbols, <strong>and</strong> properties to write <strong>and</strong>simplify expressions <strong>and</strong> sentences:use letters, boxes, or other symbols to st<strong>and</strong> for any number in simpleexpressions or equations (e.g., demonstrate an underst<strong>and</strong>ing of the conceptof a variable)interpret <strong>and</strong> evaluate mathematical expressions using parenthesesuse <strong>and</strong> interpret formulas (e.g., Area = Length x Width or A = L x W) toanswer questions about quantities <strong>and</strong> their relationshipsIdentify symbols <strong>and</strong> letters that represent the concept of a variable as an unknownquantity.Explore the uses of properties (commutative, distributive, associative) in thecomputation of whole numbers.Express mathematical relationships using equations.Determine the value of variables in simple equations (e.g., 80 x 15 = 40 x ?).Develop simple formulas in exploring quantities <strong>and</strong> their relationships (e.g., A = Lx W).Solve problems involving proportional relationships (including unit pricing <strong>and</strong> mapinterpretations; e.g., one inch = five miles; therefore, five inches = _ miles).Model problem situations <strong>and</strong> use graphs, tables, pictures, <strong>and</strong> equations to drawconclusions (e.g., different patterns of change).Use <strong>and</strong> interpret formulas (e.g., Area = Length x Width or A = L x W) to answerquestions about quantities <strong>and</strong> their relationships.Identify <strong>and</strong> describe situations with constant or varying rates of change <strong>and</strong>compare them.Determine how a change in one variable relates to a change in a second variable(e.g., data tables, input-output machines).Find <strong>and</strong> analyze patterns using data tables (e.g., T tables).Demonstrate <strong>and</strong> describe varying rates of change in relation to real-worldsituations (e.g., plant growth, students’ heights).<strong>Fourth</strong> <strong>Grade</strong> <strong>St<strong>and</strong>ards</strong> <strong>and</strong> <strong>Benchmarks</strong> Page 3
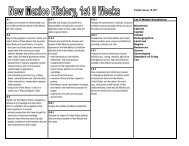
St<strong>and</strong>ard #4: MeasurementDefinition: Students will underst<strong>and</strong> measurement systems <strong>and</strong> applications.Benchmark #1:Underst<strong>and</strong>measurable attributesof objects <strong>and</strong> theunits, systems, <strong>and</strong>process ofmeasurementBenchmark #2:Apply appropriatetechniques, tools, <strong>and</strong>formulas to determinemeasurementsPerformanceObjective 1PerformanceObjective 2PerformanceObjective 3PerformanceObjective 4PerformanceObjective 5PerformanceObjective 6PerformanceObjective 1PerformanceObjective 2PerformanceObjective 3PerformanceObjective 4PerformanceObjective 5PerformanceObjective 6Select the appropriate type of unit for measuring perimeter <strong>and</strong> size of an angle.Underst<strong>and</strong> the need for measuring with st<strong>and</strong>ard units <strong>and</strong> become familiar withthe st<strong>and</strong>ard units in customary <strong>and</strong> metric system.Identify the inverse relationship between the size of the units <strong>and</strong> the number ofunits.Develop formulas to determine the surface areas of rectangular solids.Develop, underst<strong>and</strong>, <strong>and</strong> use formulas to find the area of rectangles <strong>and</strong> relatedtriangles <strong>and</strong> parallelograms.Carry out simple conversions within a system of measurement (e.g., hours tominutes, meters to centimeters).Estimate perimeters, areas of rectangles, triangles, <strong>and</strong> irregular shapes.Find the area of rectangles, related triangles, <strong>and</strong> parallelograms.Estimate, measure, <strong>and</strong> solve problems involving length, area, mass, time, <strong>and</strong>temperature using appropriate st<strong>and</strong>ard units <strong>and</strong> tools.Identify common measurements of turns (e.g., 360 degrees in one turn, 90degrees in a quarter-turn).Compute elapsed time <strong>and</strong> make <strong>and</strong> interpret schedules.Use tools to measure angles (e.g., protractor, compass).<strong>Fourth</strong> <strong>Grade</strong> <strong>St<strong>and</strong>ards</strong> <strong>and</strong> <strong>Benchmarks</strong> Page 5
St<strong>and</strong>ard #5: Data Analysis <strong>and</strong> ProbabilityDefinition: Students will underst<strong>and</strong> how to formulate questions, analyze data, <strong>and</strong> determine probabilities.Benchmark #1:Formulate questionsthat can be addressedwith data <strong>and</strong> collect,organize, <strong>and</strong> displayrelevant data toanswer themBenchmark #2:Select <strong>and</strong> useappropriate statisticalmethods to analyzedataBenchmark #3:Develop <strong>and</strong> evaluateinferences <strong>and</strong>predictions that arebased on dataBenchmark #4:Underst<strong>and</strong> <strong>and</strong> applybasic concepts ofprobabilityPerformanceObjective 1PerformanceObjective 2PerformanceObjective 1PerformanceObjective 2PerformanceObjective 3PerformanceObjective 1PerformanceObjective 2PerformanceObjective 1Organize, represent, <strong>and</strong> interpret numerical <strong>and</strong> categorical data <strong>and</strong> clearlycommunicate findings:choose <strong>and</strong> construct representations that are appropriate for the data setrecognize the differences in representing categorical <strong>and</strong> numerical dataDesign investigations <strong>and</strong> represent data using tables <strong>and</strong> graphs (e.g., line plots,bar graphs, line graphs).Compare <strong>and</strong> describe related data sets.Use the concepts of median, mode, maximum, minimum, <strong>and</strong> range <strong>and</strong> drawconclusions about a data set.Use data analysis to make reasonable inferences/predictions <strong>and</strong> to developconvincing arguments from data described in a variety of formats (e.g. bar graphs,Venn diagrams, charts, tables, line graphs, <strong>and</strong> pictographs).Propose <strong>and</strong> justify conclusions <strong>and</strong> predictions based on data.Develop convincing arguments from data displayed in a variety of formats.Describe events as “likely,” “unlikely,” or “impossible” <strong>and</strong> quantify simpleprobability situations:represent all possible outcomes for a simple probability situation in anorganized way (e.g., tables, grids, tree diagrams)express outcomes of experimental probability situations verbally <strong>and</strong>numerically (e.g., three out of four, _)PerformanceObjective 2List all the possible combinations of objects from three sets (e.g., spinners, numberof outfits from three different shirts, two skirts, <strong>and</strong> two hats).<strong>Fourth</strong> <strong>Grade</strong> <strong>St<strong>and</strong>ards</strong> <strong>and</strong> <strong>Benchmarks</strong> Page 6