Fourth Grade Math Standards and Benchmarks
Fourth Grade Math Standards and Benchmarks
Fourth Grade Math Standards and Benchmarks

You also want an ePaper? Increase the reach of your titles
YUMPU automatically turns print PDFs into web optimized ePapers that Google loves.
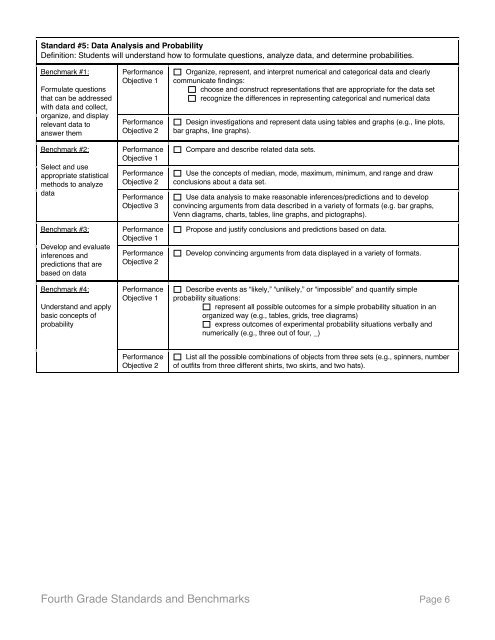
St<strong>and</strong>ard #5: Data Analysis <strong>and</strong> ProbabilityDefinition: Students will underst<strong>and</strong> how to formulate questions, analyze data, <strong>and</strong> determine probabilities.Benchmark #1:Formulate questionsthat can be addressedwith data <strong>and</strong> collect,organize, <strong>and</strong> displayrelevant data toanswer themBenchmark #2:Select <strong>and</strong> useappropriate statisticalmethods to analyzedataBenchmark #3:Develop <strong>and</strong> evaluateinferences <strong>and</strong>predictions that arebased on dataBenchmark #4:Underst<strong>and</strong> <strong>and</strong> applybasic concepts ofprobabilityPerformanceObjective 1PerformanceObjective 2PerformanceObjective 1PerformanceObjective 2PerformanceObjective 3PerformanceObjective 1PerformanceObjective 2PerformanceObjective 1Organize, represent, <strong>and</strong> interpret numerical <strong>and</strong> categorical data <strong>and</strong> clearlycommunicate findings:choose <strong>and</strong> construct representations that are appropriate for the data setrecognize the differences in representing categorical <strong>and</strong> numerical dataDesign investigations <strong>and</strong> represent data using tables <strong>and</strong> graphs (e.g., line plots,bar graphs, line graphs).Compare <strong>and</strong> describe related data sets.Use the concepts of median, mode, maximum, minimum, <strong>and</strong> range <strong>and</strong> drawconclusions about a data set.Use data analysis to make reasonable inferences/predictions <strong>and</strong> to developconvincing arguments from data described in a variety of formats (e.g. bar graphs,Venn diagrams, charts, tables, line graphs, <strong>and</strong> pictographs).Propose <strong>and</strong> justify conclusions <strong>and</strong> predictions based on data.Develop convincing arguments from data displayed in a variety of formats.Describe events as “likely,” “unlikely,” or “impossible” <strong>and</strong> quantify simpleprobability situations:represent all possible outcomes for a simple probability situation in anorganized way (e.g., tables, grids, tree diagrams)express outcomes of experimental probability situations verbally <strong>and</strong>numerically (e.g., three out of four, _)PerformanceObjective 2List all the possible combinations of objects from three sets (e.g., spinners, numberof outfits from three different shirts, two skirts, <strong>and</strong> two hats).<strong>Fourth</strong> <strong>Grade</strong> <strong>St<strong>and</strong>ards</strong> <strong>and</strong> <strong>Benchmarks</strong> Page 6