Liberalisation of electricity market: the case of Slovenia
Liberalisation of electricity market: the case of Slovenia
Liberalisation of electricity market: the case of Slovenia

Create successful ePaper yourself
Turn your PDF publications into a flip-book with our unique Google optimized e-Paper software.
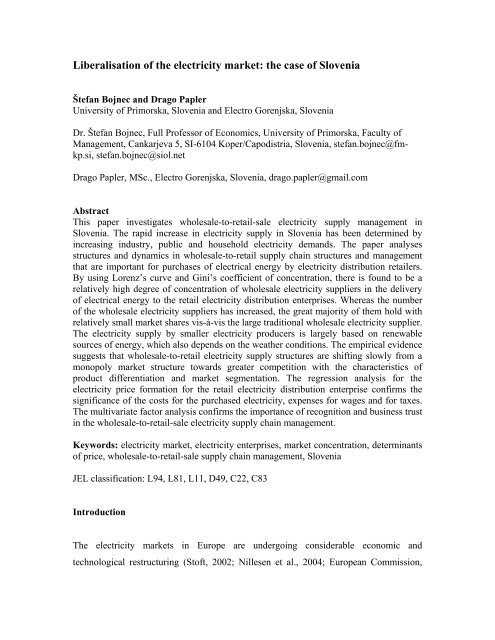
<strong>Liberalisation</strong> <strong>of</strong> <strong>the</strong> <strong>electricity</strong> <strong>market</strong>: <strong>the</strong> <strong>case</strong> <strong>of</strong> <strong>Slovenia</strong>Štefan Bojnec and Drago PaplerUniversity <strong>of</strong> Primorska, <strong>Slovenia</strong> and Electro Gorenjska, <strong>Slovenia</strong>Dr. Štefan Bojnec, Full Pr<strong>of</strong>essor <strong>of</strong> Economics, University <strong>of</strong> Primorska, Faculty <strong>of</strong>Management, Cankarjeva 5, SI-6104 Koper/Capodistria, <strong>Slovenia</strong>, stefan.bojnec@fmkp.si,stefan.bojnec@siol.netDrago Papler, MSc., Electro Gorenjska, <strong>Slovenia</strong>, drago.papler@gmail.comAbstractThis paper investigates wholesale-to-retail-sale <strong>electricity</strong> supply management in<strong>Slovenia</strong>. The rapid increase in <strong>electricity</strong> supply in <strong>Slovenia</strong> has been determined byincreasing industry, public and household <strong>electricity</strong> demands. The paper analysesstructures and dynamics in wholesale-to-retail supply chain structures and managementthat are important for purchases <strong>of</strong> electrical energy by <strong>electricity</strong> distribution retailers.By using Lorenz’s curve and Gini’s coefficient <strong>of</strong> concentration, <strong>the</strong>re is found to be arelatively high degree <strong>of</strong> concentration <strong>of</strong> wholesale <strong>electricity</strong> suppliers in <strong>the</strong> delivery<strong>of</strong> electrical energy to <strong>the</strong> retail <strong>electricity</strong> distribution enterprises. Whereas <strong>the</strong> number<strong>of</strong> <strong>the</strong> wholesale <strong>electricity</strong> suppliers has increased, <strong>the</strong> great majority <strong>of</strong> <strong>the</strong>m hold withrelatively small <strong>market</strong> shares vis-à-vis <strong>the</strong> large traditional wholesale <strong>electricity</strong> supplier.The <strong>electricity</strong> supply by smaller <strong>electricity</strong> producers is largely based on renewablesources <strong>of</strong> energy, which also depends on <strong>the</strong> wea<strong>the</strong>r conditions. The empirical evidencesuggests that wholesale-to-retail <strong>electricity</strong> supply structures are shifting slowly from amonopoly <strong>market</strong> structure towards greater competition with <strong>the</strong> characteristics <strong>of</strong>product differentiation and <strong>market</strong> segmentation. The regression analysis for <strong>the</strong><strong>electricity</strong> price formation for <strong>the</strong> retail <strong>electricity</strong> distribution enterprise confirms <strong>the</strong>significance <strong>of</strong> <strong>the</strong> costs for <strong>the</strong> purchased <strong>electricity</strong>, expenses for wages and for taxes.The multivariate factor analysis confirms <strong>the</strong> importance <strong>of</strong> recognition and business trustin <strong>the</strong> wholesale-to-retail-sale <strong>electricity</strong> supply chain management.Keywords: <strong>electricity</strong> <strong>market</strong>, <strong>electricity</strong> enterprises, <strong>market</strong> concentration, determinants<strong>of</strong> price, wholesale-to-retail-sale supply chain management, <strong>Slovenia</strong>JEL classification: L94, L81, L11, D49, C22, C83IntroductionThe <strong>electricity</strong> <strong>market</strong>s in Europe are undergoing considerable economic andtechnological restructuring (St<strong>of</strong>t, 2002; Nillesen et al., 2004; European Commission,
lighting and households). As a part <strong>of</strong> <strong>the</strong> systemic provider <strong>of</strong> <strong>electricity</strong> networks, <strong>the</strong>reis also <strong>the</strong> nuclear <strong>electricity</strong> power station in Krško as a producer <strong>of</strong> electrical energy.The systemic provider <strong>of</strong> <strong>electricity</strong> networks is a main provider <strong>of</strong> electrical energy toretailer <strong>electricity</strong> distribution enterprises, which <strong>the</strong>n sell <strong>electricity</strong> fur<strong>the</strong>r to finalconsumers (industry, public lighting and households). The wholesale-to-retail-sale<strong>electricity</strong> <strong>market</strong>ing and <strong>electricity</strong> supply chain management have also been to a lesserextent developed through <strong>the</strong> stock exchange <strong>of</strong> electrical energy called “Borzen”, whichhas been introduced since <strong>the</strong> <strong>electricity</strong> <strong>market</strong> deregulation in 2001. The retail<strong>electricity</strong> distribution enterprises are also purchasing electrical energy from small<strong>electricity</strong> producers/suppliers, which have a relatively small <strong>market</strong> share in <strong>the</strong>wholesale <strong>electricity</strong> supply in <strong>Slovenia</strong>.At <strong>the</strong> retail <strong>electricity</strong> <strong>market</strong>ing level, <strong>the</strong> <strong>Slovenia</strong>n public retail <strong>electricity</strong> distributionenterprises, which are organized on a regional basis, have maintained <strong>the</strong> greatest <strong>market</strong>share. They are organized as a share holding company: four enterprises within <strong>the</strong>Holding <strong>of</strong> <strong>the</strong> <strong>Slovenia</strong>n <strong>electricity</strong> suppliers (HES), which is balancing <strong>electricity</strong>supply within <strong>the</strong> HES, while <strong>the</strong> fifth one is organized as a spin-<strong>of</strong>f enterprise, with <strong>the</strong>majority state ownership. Their role has been in mitigating transmission <strong>of</strong> electricalenergy from wholesale distribution network enterprises to final consumers as well asdevelopment <strong>of</strong> <strong>electricity</strong> distribution systems. The <strong>market</strong> share <strong>of</strong> <strong>the</strong>se five retail<strong>electricity</strong> distribution enterprises in <strong>the</strong> <strong>Slovenia</strong>n <strong>electricity</strong> consumer <strong>market</strong>s is around80 percent.We specifically focus on <strong>the</strong> <strong>electricity</strong> supply chain management in <strong>the</strong> relation between<strong>the</strong> <strong>electricity</strong> producers/wholesalers and <strong>the</strong> retail <strong>electricity</strong> distribution enterprises.More specifically, we are using Electro Gorenjska, which is one <strong>of</strong> <strong>the</strong> retail <strong>electricity</strong>distribution enterprises in <strong>Slovenia</strong>, as a <strong>case</strong> study. This retail <strong>electricity</strong> distributionenterprise is compared with o<strong>the</strong>r retail <strong>electricity</strong> distribution enterprises in <strong>Slovenia</strong> toillustrate that Electro Gorenjska is not an exception in <strong>the</strong> <strong>Slovenia</strong>n retail <strong>electricity</strong>distribution <strong>market</strong>. The retail <strong>electricity</strong> distribution enterprises are purchasing electricalenergy from different <strong>electricity</strong> producers and wholesale <strong>electricity</strong> suppliers, but it is3
identified clearly that <strong>the</strong> HES has increased its share to around 90 percent, whereas <strong>the</strong>remaining <strong>electricity</strong> purchases by <strong>the</strong> retail <strong>electricity</strong> distribution enterprises haveshifted towards small private <strong>electricity</strong> suppliers, that particularly are producingelectrical energy from local renewable sources <strong>of</strong> electrical energy.The rest <strong>of</strong> <strong>the</strong> paper is structured in <strong>the</strong> following way. We first present some empiricalfacts on <strong>the</strong> structure <strong>of</strong> <strong>electricity</strong> purchases by <strong>the</strong> retail <strong>electricity</strong> distributionenterprises from producers/wholesalers <strong>of</strong> electrical energy to provide a basis forunderstanding <strong>the</strong> wholesale-to-retail-sale <strong>electricity</strong> supply chain management. Then wepresent briefly <strong>the</strong> <strong>Slovenia</strong>n stock exchange “Borzen” <strong>of</strong> electrical energy as an issue <strong>of</strong><strong>electricity</strong> <strong>market</strong> liberalisation and as a <strong>market</strong> outlet for regional <strong>electricity</strong> <strong>market</strong>cooperation. The next section presents <strong>the</strong> methodology and empirical results. The <strong>case</strong>study <strong>of</strong> <strong>the</strong> retail distribution enterprise <strong>of</strong> <strong>the</strong> Electro Gorenjska is used to provide indepthanalysis and comparisons <strong>of</strong> structures <strong>of</strong> <strong>electricity</strong> purchases and <strong>electricity</strong>supply management from producers/wholesalers-to-retailers. The final section derives <strong>the</strong>main conclusions and policy implications.Some empirical evidence on <strong>the</strong> <strong>Slovenia</strong>n wholesale-to-retail-sale <strong>electricity</strong><strong>market</strong>sSince 2001, <strong>the</strong> <strong>Slovenia</strong>n electrical energy <strong>market</strong>s have been gradually deregulated(Papler and Bojnec, 2006, 2007). The purchases <strong>of</strong> electrical energy at <strong>the</strong> organizedstock exchange “Borzen” have also started since 2001, and <strong>the</strong> peak in its size was in2003. The most important wholesale supplier <strong>of</strong> electrical energy for <strong>the</strong> retail <strong>electricity</strong>distribution enterprises is <strong>the</strong> HES, through <strong>the</strong> long-run closed contracts on <strong>the</strong>purchases <strong>of</strong> electrical energy. As a starting point into <strong>the</strong> analysis <strong>of</strong> <strong>the</strong> <strong>Slovenia</strong>n<strong>electricity</strong> wholesale-to-retail-sale <strong>market</strong>s, we present four items <strong>of</strong> empirical evidencethat have occurred as a result <strong>of</strong> <strong>the</strong> <strong>electricity</strong> <strong>market</strong> deregulation and <strong>electricity</strong> priceliberalisation.4
First, to examine <strong>electricity</strong> wholesale-to-retail-sale supply chain management in<strong>Slovenia</strong>, we start our analysis with <strong>the</strong> size <strong>of</strong> <strong>the</strong> <strong>electricity</strong> distribution <strong>market</strong>s to <strong>the</strong>final consumers in <strong>Slovenia</strong>, which are covered by <strong>the</strong> five largest <strong>Slovenia</strong>n retail<strong>electricity</strong> distribution enterprises (Figure 1). Due to <strong>the</strong> increasing <strong>electricity</strong> demands,<strong>the</strong> <strong>electricity</strong> supply has increased. The increases in <strong>the</strong> <strong>market</strong> size as measured by <strong>the</strong>size <strong>of</strong> <strong>electricity</strong> sales are recorded for each <strong>of</strong> <strong>the</strong> retail <strong>electricity</strong> distributionenterprises. However, <strong>the</strong> sizes <strong>of</strong> <strong>electricity</strong> sales and <strong>the</strong>ir dynamics between <strong>the</strong>individual retail <strong>electricity</strong> distribution enterprises vary. Electro Ljubljana is <strong>the</strong> largestsingle retail <strong>electricity</strong> distribution enterprise with its fur<strong>the</strong>r sale increases. On <strong>the</strong> o<strong>the</strong>rhand, Electro Gorenjska is – by <strong>the</strong> size <strong>of</strong> sales – <strong>the</strong> smallest one.4.0003.5003.0002.5002.0001.5001.0005000Electro Celje Electro Gorenjska Electro Ljubljana Electro Maribor Electro Primorska1980 1985 1990 1995 2000 2005Figure 1: Supply <strong>of</strong> <strong>electricity</strong> by <strong>the</strong> retail distribution enterprises in <strong>Slovenia</strong> byselected years (in GWh)Source: Own calculations.Second, we present <strong>the</strong> changing patterns and structures in <strong>the</strong> density <strong>of</strong> <strong>the</strong> purchases <strong>of</strong>electrical energy per km 2 by <strong>the</strong> main retail <strong>electricity</strong> distribution enterprises. Thisindicator is <strong>the</strong> highest, and with an increasing tendency for Electro Ljubljana, and <strong>the</strong>lowest with yearly variations for Electro Celje (Table 1).5
Table 1: Purchases <strong>of</strong> electrical energy per km 2 in <strong>Slovenia</strong> by <strong>the</strong> electro-distributionenterprises, 1990-2005 (MWh/ km 2 )Electro Electro Electro Electro ElectroCelje Gorenjska Ljubljana Maribor Primorska <strong>Slovenia</strong>1990 321.5 351.1 507.2 377.5 245.4 367.81991 315.0 356.6 503.0 379.9 237.5 364.61992 305.7 341.6 486.6 367.5 228.7 352.41993 311.8 350.8 496.1 382.2 235.7 361.51994 324.2 364.7 506.5 386.2 249.2 372.21995 339.4 381.5 522.8 398.7 264.9 387.41996 339.6 391.4 541.6 405.2 265.9 394.91997 354.1 400.0 557.0 414.5 265.7 404.81998 363.4 413.6 582.5 428.4 286.3 422.21999 360.0 415.0 587.9 439.3 288.1 425.52000 371.7 430.6 598.0 437.7 294.1 433.42001 387.3 438.6 619.9 451.4 303.0 448.02002 369.7 448.5 667.0 465.7 315.5 463.12003 425.5 463.5 670.2 486.2 327.6 484.42004 399.3 475.3 695.9 495.3 354.2 494.22005 351.9 483.4 726.2 510.9 376.4 500.6Source: Own calculations.Third, we present <strong>the</strong> density in <strong>the</strong> purchases <strong>of</strong> electrical energy per capita by mainretail <strong>electricity</strong> distribution enterprises. We expect that <strong>electricity</strong> consumption percapita is associated with <strong>the</strong> level <strong>of</strong> technological development <strong>of</strong> industry and <strong>the</strong> level<strong>of</strong> overall economic development, which cause demands for electrical energy by <strong>the</strong>different economy sectors, public lighting, and households. The consumption <strong>of</strong> electricalenergy per purchase place and per capita has increased over time (Figure 2 and Table 2).The electrical energy consumption per capita is <strong>the</strong> highest for Electro Primorska and <strong>the</strong>lowest for Electro Maribor, while Electro Celje, Electro Gorenjska, and Electro Ljubljanahave a consumption <strong>of</strong> electrical energy per capita which is close to <strong>the</strong> <strong>Slovenia</strong>naverage.6
1210MWh864201990 1991 1992 1993 1994 1995 1996 1997 1998 1999 2000 2001 2002 2003 2004 2005MWh per purchase placeMWh per capitaFigure 2: Purchases <strong>of</strong> electrical energy in MWh per purchase place and MWh per capitaSource: Own calculations.Table 2: Purchases <strong>of</strong> electrical energy per capita in <strong>Slovenia</strong> by <strong>the</strong> retail electrodistribution enterprises, 1990-2005 (MWh per capita)Electro Electro Electro Electro ElectroCelje Gorenjska Ljubljana Maribor Primorska <strong>Slovenia</strong>1990 4.1 3.7 3.6 3.0 4.4 3.71991 5.0 3.8 3.4 3.1 3.9 3.61992 5.1 3.6 3.3 3.0 3.7 3.51993 4.2 3.7 3.6 3.1 3.8 3.61994 4.5 3.8 3.6 3.1 4.1 3.71995 4.6 4.1 3.7 3.2 4.4 3.91996 4.7 4.2 3.9 3.3 4.4 4.01997 5.0 4.2 4.0 3.4 4.3 4.11998 5.2 4.4 4.2 3.5 4.7 4.31999 5.1 4.4 4.2 3.6 4.7 4.32000 5.2 4.5 4.3 3.6 4.8 4.42001 5.4 4.7 4.4 3.7 5.0 4.52002 5.1 4.8 4.7 3.9 5.2 4.62003 5.8 4.9 4.8 4.0 5.4 4.92004 5.5 5.0 4.9 4.1 5.9 5.02005 5.0 5.1 5.1 4.2 5.9 5.0Source: Own calculations.Fourth, <strong>the</strong> increases in purchases <strong>of</strong> electrical energy by <strong>the</strong> retail <strong>electricity</strong> distributionenterprises and <strong>the</strong>ir sales for different consumption <strong>of</strong> electrical energy tend to move in7
<strong>the</strong> same direction with <strong>the</strong> increases in gross domestic product (GDP) per capita (Figure3). This implies that <strong>the</strong> increases in GDP per capita, which is one <strong>of</strong> <strong>the</strong> main aggregatesfor measuring <strong>the</strong> level <strong>of</strong> economic development, are positively associated with <strong>the</strong>greater use <strong>of</strong> electrical energy for intermediary consumption and greater demands forelectrical energy for final consumption by households.MWh, GDP per capita (€)16.00014.00012.00010.0008.0006.0004.0002.00001990 1991 1992 1993 1994 1995 1996 1997 1998 1999 2000 2001 2002 2003 2004 2005Purchases by distribution enterprises GDP per capita (€)Figure 3: Purchases <strong>of</strong> electrical energy by <strong>the</strong> retail electro distribution enterprises andgross domestic product per capitaSource: Own calculations.Stock exchange “Borzen” <strong>of</strong> electrical energyThe purchases <strong>of</strong> electrical energy at <strong>the</strong> stock exchange “Borzen” <strong>of</strong> electrical energyare introduced as a measure to increase <strong>market</strong> competition and to improve efficiency in<strong>the</strong> <strong>market</strong>ing and functioning <strong>of</strong> <strong>the</strong> wholesale <strong>electricity</strong> supply as well as to serve as a<strong>market</strong> outlet for entering foreign competitors on <strong>the</strong> <strong>Slovenia</strong>n <strong>electricity</strong> <strong>market</strong>s, andfor broader regional integration <strong>of</strong> <strong>electricity</strong> <strong>market</strong>s in South-Eastern Europe.Up to 2001, before <strong>the</strong> <strong>electricity</strong> <strong>market</strong> deregulation in <strong>Slovenia</strong> was introduced, <strong>the</strong>retail <strong>electricity</strong> distribution enterprises in <strong>Slovenia</strong> were purchasing electrical energy on<strong>the</strong> basis <strong>of</strong> <strong>the</strong> evaluated electro energy balances and programs <strong>of</strong> <strong>the</strong> electro energy8
system by <strong>the</strong> Electro <strong>Slovenia</strong> enterprise (Eles). Since 2001 <strong>the</strong>re has been an aimtowards streng<strong>the</strong>ned liberalisation in an emerging <strong>market</strong> <strong>of</strong> electrical energy, but with aprevailing role <strong>of</strong> <strong>the</strong> HES. That has been <strong>the</strong> main reason for <strong>the</strong> less promising role <strong>of</strong><strong>the</strong> stock exchange “Borzen” <strong>of</strong> electrical energy on <strong>the</strong> <strong>Slovenia</strong>n <strong>electricity</strong> <strong>market</strong>s.Since 2004, four retail <strong>electricity</strong> distribution enterprises (Electro Celje, ElectroGorenjska, Electro Ljubljana and Electro Primorska) have purchased electrical energyfrom <strong>the</strong> HES in order to <strong>the</strong>n fur<strong>the</strong>r supply electrical energy to <strong>electricity</strong> consumers(industry, public lighting and final consumption by households).Figure 4: The role <strong>of</strong> <strong>the</strong> stock exchange “Borzen” <strong>of</strong> electrical energy in <strong>the</strong> purchases <strong>of</strong>electrical energy by <strong>the</strong> retail <strong>electricity</strong> distribution enterprises in <strong>Slovenia</strong> (in % <strong>of</strong> totalpurchases <strong>of</strong> electrical energy)12,0010,008,00%6,004,002,000,002001 2002 2003 2004 2005Electro CeljeElectro LjubljanaElectro PrimorskaElectro GorenjskaElectro MariborTotal retailing enterprises in <strong>Slovenia</strong>Source: Own calculations.In 2001, at <strong>the</strong> weekly meetings <strong>of</strong> <strong>the</strong> stock exchange “Borzen” <strong>of</strong> electrical energy <strong>the</strong>ystarted with <strong>the</strong> sale <strong>of</strong> electrical energy to <strong>the</strong> retail <strong>electricity</strong> distribution enterprises in<strong>Slovenia</strong> (Figure 4). An increase in <strong>electricity</strong> transactions is seen by 2003. In 2005, <strong>the</strong>rewas a considerable decline in purchases on <strong>the</strong> stock exchange <strong>of</strong> electrical energy“Borzen” by <strong>the</strong> retail <strong>electricity</strong> distribution enterprises. Since <strong>the</strong>n, <strong>the</strong> importance <strong>of</strong><strong>the</strong> stock exchange <strong>of</strong> electrical “Borzen” in <strong>the</strong> purchases <strong>of</strong> electrical energy by <strong>the</strong>retail <strong>electricity</strong> distribution enterprises, as well as in general, has been given ra<strong>the</strong>r lowimportance.9
MethodologyAs <strong>the</strong> methods <strong>of</strong> analysis we apply <strong>the</strong> Lorenz curve, Gini coefficient <strong>of</strong> concentration,regression analysis, and multivariate factor analysis (e.g. Kachigan, 1991; Gujarati andDamodar, 2003). The analysis <strong>of</strong> <strong>market</strong> structures and <strong>market</strong> concentrations is one <strong>of</strong><strong>the</strong> bases <strong>of</strong> <strong>the</strong> economic business analysis and economics <strong>of</strong> industrial organization(e.g. Chrystal and Lipsey, 1997; Cabral, 2000; McAleese, 2004). We analyse <strong>market</strong>structures, and specifically <strong>the</strong> structures <strong>of</strong> <strong>electricity</strong> purchases by <strong>the</strong> retail <strong>electricity</strong>distribution enterprises, in order to illustrate <strong>the</strong> structures in <strong>the</strong> wholesale-to-retail-sale<strong>electricity</strong> supply chain management. The most commonly used measures <strong>of</strong>distributional inequalities in <strong>the</strong> literature are Lorenz curves and Gini coefficients <strong>of</strong>concentration. By using statistical methods we analyse frequency in <strong>the</strong> distribution <strong>of</strong><strong>electricity</strong> supply or purchases by <strong>the</strong> retail <strong>electricity</strong> distribution enterprises in quantityand value terms. The frequency distribution is calculated in <strong>the</strong> following way:K = 1 + 3.3log N(1)Fk= fk1 + fk 2+ ...(2)Fk(3)Fk % = = 100N(max−min)(4)xk = min +⋅ F k2xk% = 1(5)Xk⋅100∑ xSymbols:φk% = xk1%+ xk2%(6)N – number <strong>of</strong> observations <strong>of</strong> variablesK – number <strong>of</strong> distribution or quintile groupsfk– frequencyFk– cumulative frequencyF k%– share <strong>of</strong> cumulative frequency (%)xk– mean value for distribution or quintile groupxk% – share <strong>of</strong> <strong>the</strong> mean value <strong>of</strong> distribution or quintilegroup (%)φ – cumulative <strong>of</strong> relative totals%k10
For graphical presentation <strong>of</strong> relative frequency distribution by quintile groups and itscumulative relative frequency concentration we use <strong>the</strong> Lorenz curve. The graphicalpresentation <strong>of</strong> <strong>the</strong> Lorenz curve has a quadratic form. On <strong>the</strong> horizontal axis is a scalefor cumulative relative frequency expressed in percent (% ). On <strong>the</strong> vertical axis is ascale for cumulative <strong>of</strong> relative quintile group totals expressed in percent ( φ % ). In sucha quadratic chart <strong>the</strong>re are included pairs <strong>of</strong> both variables. The obtained pair points in <strong>the</strong>chart are <strong>the</strong>n connected from <strong>the</strong> bottom left corner. The obtained curve is <strong>the</strong> Lorenzcurve, which expresses <strong>the</strong> concentration <strong>of</strong> <strong>the</strong> wholesale suppliers in <strong>the</strong> purchases <strong>of</strong>electrical energy by <strong>the</strong> retail <strong>electricity</strong> distribution enterprises. The more <strong>the</strong> shape <strong>of</strong><strong>the</strong> Lorenz curve moves to <strong>the</strong> right bottom corner, <strong>the</strong> greater is <strong>the</strong> concentration, andvice versa when <strong>the</strong> Lorenz curve is situated closer to <strong>the</strong> diagonal <strong>of</strong> <strong>the</strong> chart.Therefore, <strong>the</strong> Lorenz curve is derived from <strong>the</strong> calculated frequency distribution. In ouranalyzed <strong>case</strong>s, <strong>the</strong> Lorenz curve shows <strong>the</strong> concentration <strong>of</strong> <strong>electricity</strong> purchases, whichis expressed by <strong>the</strong> share <strong>of</strong> different wholesale <strong>electricity</strong> suppliers in total <strong>electricity</strong>purchases by <strong>the</strong> <strong>electricity</strong> distribution enterprises. It indicates <strong>the</strong> importance <strong>of</strong>strategic suppliers with <strong>the</strong> greatest share in total <strong>electricity</strong> purchases by <strong>the</strong> retail<strong>electricity</strong> distribution enterprise. This equality can be shown by <strong>the</strong> straight line <strong>of</strong>perfect equality, which captures <strong>the</strong> cumulative share <strong>of</strong> <strong>electricity</strong> supply (vertical axis)by each quintile group and particularly <strong>the</strong> ones below it (horizontal axis). The firstquintile group receives a 0.2 share or 20 percent <strong>of</strong> total <strong>electricity</strong> supply, <strong>the</strong> first andsecond quintiles receive 40 percent <strong>of</strong> total <strong>electricity</strong> supply, and so forth. If <strong>the</strong>distribution <strong>of</strong> <strong>electricity</strong> supply is not equal for <strong>the</strong> each quintile group, <strong>the</strong>n <strong>the</strong> Lorenzcurve connecting <strong>the</strong> cumulative percentages <strong>of</strong> <strong>electricity</strong> supply by <strong>the</strong> cumulatedquintiles lies below <strong>the</strong> line <strong>of</strong> perfect equality, as it is in our <strong>case</strong> <strong>of</strong> <strong>the</strong> wholesale<strong>electricity</strong> supply to <strong>the</strong> retail <strong>electricity</strong> distribution enterprises.F kkThe second measure <strong>of</strong> concentration is <strong>the</strong> Gini coefficient <strong>of</strong> concentration, whichexpresses <strong>the</strong> degree <strong>of</strong> <strong>market</strong> concentration. Therefore, in our <strong>case</strong>, concentrations <strong>of</strong><strong>electricity</strong> suppliers in <strong>the</strong> <strong>electricity</strong> purchasing structures by <strong>the</strong> <strong>electricity</strong> distributionenterprises is also analysed using <strong>the</strong> Gini coefficient <strong>of</strong> concentration. The Ginicoefficient is defined as <strong>the</strong> ratio <strong>of</strong> <strong>the</strong> area between <strong>the</strong> Lorenz curve and <strong>the</strong> line <strong>of</strong>11
perfect equality to <strong>the</strong> total area under <strong>the</strong> line <strong>of</strong> perfect equality. When <strong>the</strong>re is perfectequality, <strong>the</strong>n <strong>the</strong> Gini coefficient would equal zero. More specifically, <strong>the</strong> Ginicoefficient <strong>of</strong> <strong>the</strong> degree <strong>of</strong> <strong>market</strong> concentration is calculated in <strong>the</strong> following way:Symbols:K∑f k%( φk% + φk−1%)k=1G = 1−10000G – Gini coefficient <strong>of</strong> concentrationF k%– share <strong>of</strong> cumulative frequency (%)φk% – cumulative <strong>of</strong> relative flowsF k%– share <strong>of</strong> cumulative frequency (%)(7)When <strong>the</strong> Gini coefficient is equal to 0, <strong>the</strong>n <strong>the</strong>re is no <strong>market</strong> concentration, and whenit is equal to 1, <strong>the</strong>n <strong>the</strong>re is full <strong>market</strong> concentration.We estimate <strong>the</strong> demand function for purchases <strong>of</strong> electrical energy by <strong>the</strong> retail<strong>electricity</strong> distribution enterprise, which is explained by <strong>the</strong> real purchase <strong>electricity</strong> priceand GDP:Dw =f ( P , GDP)wwhereD wis <strong>the</strong> demand for electrical energy defined as <strong>the</strong> purchased quantity <strong>of</strong>electrical energy by <strong>the</strong> retail electro distribution enterprise,P wis <strong>the</strong> real purchase price<strong>of</strong> electrical energy, and GDP is gross domestic product. Moreover, <strong>the</strong> dummy variableequal to 1 for <strong>the</strong> liberalisation years with <strong>the</strong> start in 2001 is included, and zeroo<strong>the</strong>rwise.We also estimate <strong>the</strong> total real revenue function for <strong>electricity</strong> sales by <strong>the</strong> retail<strong>electricity</strong> distribution enterprise, which is explained by <strong>the</strong> real purchase wholesale<strong>electricity</strong> price, expenses for paid taxes and expenses for paid wages:Re venue =wf ( Pw, Ctax, Cwages)whereRevenue wis total real revenue from <strong>the</strong> sale <strong>of</strong> electrical energy by <strong>the</strong> electrodistributionenterprise,P wis <strong>the</strong> real wholesale purchase price <strong>of</strong> electrical energy by <strong>the</strong>12
<strong>electricity</strong> distribution enterprise,C taxare <strong>the</strong> real expenses paid by <strong>the</strong> <strong>electricity</strong>distribution enterprise for taxes, andC wagesare <strong>the</strong> real expenses paid by <strong>the</strong> <strong>electricity</strong>distribution enterprise for wages.The regressions are estimated using <strong>the</strong> ordinary least square (OLS) method.The multivariate factor analysis (Norušis, 2002) is applied in <strong>the</strong> analysis <strong>of</strong> <strong>the</strong> uniquesurvey evidence to identify common factors important in wholesale-to-retail-sale<strong>electricity</strong> supply chain management, which is important for wholesale suppliers and for<strong>the</strong> retail <strong>electricity</strong> distribution enterprise.Empirical resultsLorenz curveThe Lorenz curve presents <strong>the</strong> concentration <strong>of</strong> <strong>the</strong> wholesale <strong>electricity</strong> suppliers in totalpurchases <strong>of</strong> electrical energy by <strong>the</strong> retail electrical distribution enterprise. Thewholesale suppliers <strong>of</strong> electrical energy are segmented by <strong>the</strong> quantity <strong>of</strong> <strong>the</strong> suppliedelectrical energy. Figure 5 indicates that 3% <strong>of</strong> <strong>the</strong> largest wholesale <strong>electricity</strong> suppliersout <strong>of</strong> 91 wholesale <strong>electricity</strong> suppliers have a 95% share in total purchases <strong>of</strong> electricalenergy by <strong>the</strong> retail <strong>electricity</strong> distribution enterprise. The Lorenz curve in <strong>the</strong> right handbottom corner clearly confirms <strong>the</strong> very high concentration <strong>of</strong> <strong>the</strong> wholesale <strong>electricity</strong>suppliers (108) in <strong>Slovenia</strong>: 6% <strong>of</strong> <strong>the</strong> largest wholesale <strong>electricity</strong> suppliers supply 98%<strong>of</strong> total electrical energy to <strong>the</strong> retail <strong>electricity</strong> distribution enterprises, and 1% <strong>of</strong> <strong>the</strong>largest ones supply 72% <strong>of</strong> electrical energy. The HSE is <strong>the</strong> largest single wholesale<strong>electricity</strong> supplier. The Gorenjska <strong>electricity</strong> plant is also one wholesale <strong>electricity</strong>supplier with its 17 <strong>electricity</strong> plants. A slightly lower concentration <strong>of</strong> <strong>electricity</strong> supplyis seen for private and industrial small hydro-<strong>electricity</strong> plants.13
?k% - number <strong>of</strong> suppliers10090807060504030201000 10 20 30 40 50 60 70 80 90 100Fk% - purchase <strong>of</strong> electrical energyTotal purchasePrivate and industrialhydro<strong>electricity</strong> plantsGorenjske <strong>electricity</strong> plantsHolding <strong>of</strong> <strong>Slovenia</strong>n <strong>electricity</strong> plantsFigure 5: Lorenz curve <strong>of</strong> concentration <strong>of</strong> suppliers <strong>of</strong> electrical energy, 2006Source: Own calculations.Gini coefficient <strong>of</strong> concentrationThe Gini coefficient for <strong>the</strong> concentration <strong>of</strong> <strong>the</strong> purchases <strong>of</strong> electrical energy by <strong>the</strong>retail electro distribution enterprise is 0.97028, which implies a very high concentration<strong>of</strong> wholesale <strong>electricity</strong> suppliers to <strong>the</strong> retail electro distribution enterprise. The HSE is<strong>the</strong> largest wholesale supplier <strong>of</strong> electrical energy to <strong>the</strong> retail electro distributionenterprise on <strong>the</strong> basis <strong>of</strong> long-run agreements and contracts.Among <strong>the</strong> number <strong>of</strong> <strong>the</strong> wholesale <strong>electricity</strong> suppliers, those prevailing are <strong>the</strong>smallest wholesale <strong>electricity</strong> suppliers (Figure 6). The greatest number <strong>of</strong> <strong>the</strong> wholesale<strong>electricity</strong> suppliers comprises <strong>the</strong> smallest suppliers, with an annual <strong>electricity</strong> supplyfrom 160 to 600 GWh (36.3%). In second place is ranked <strong>the</strong> group <strong>of</strong> <strong>the</strong> wholesale<strong>electricity</strong> suppliers from 50 to 160 GWh (26.4%), and in third place are ranked from1,200 to 2,000 GWh (9.9%). The smallest number <strong>of</strong> <strong>the</strong> wholesale <strong>electricity</strong> suppliers14
epresents <strong>the</strong> largest wholesale <strong>electricity</strong> suppliers <strong>of</strong> sizes greater than 2,000 GWhannually.4036.33026.4%20108.89.95.57.71.1 1.11.11.11.101 - 30GWh30 - 50GWh50 - 160GWh160 - 600GWh600 -1.200GWh1.200 -2.000GWh2.000 -4.000GWh4.000 -10.000GWh10.000 -20.000GWh20.000 -50.000GWhMore than50.000GWhSize <strong>of</strong> wholesale suppliersFigure 6: The share <strong>of</strong> <strong>the</strong> frequency distribution <strong>of</strong> <strong>the</strong> number <strong>of</strong> wholesale <strong>electricity</strong>suppliers <strong>of</strong> electrical energy by <strong>the</strong> annual size <strong>of</strong> supply, 2006Source: Own calculations.Demand functionsDemand functions for <strong>the</strong> purchases <strong>of</strong> electrical energy by <strong>the</strong> retail electro distributionenterprise from <strong>the</strong> wholesale <strong>electricity</strong> suppliers are estimated in <strong>the</strong> logarithm forms by<strong>the</strong> OLS method (Table 3). The increase in <strong>the</strong> real wholesale purchase price <strong>of</strong> electricalenergy causes a reduction in demands for purchases <strong>of</strong> electrical energy. The coefficient<strong>of</strong> elasticity pertaining to <strong>the</strong> real wholesale purchase price is estimated at -0.59. On <strong>the</strong>o<strong>the</strong>r hand, <strong>the</strong> increase in real GDP increases purchases <strong>of</strong> electrical energy by <strong>the</strong> retail<strong>electricity</strong> distribution enterprise. The coefficient <strong>of</strong> elasticity is estimated at 0.18. Theimpact <strong>of</strong> <strong>market</strong> deregulation and liberalisation on demands for electrical energy by <strong>the</strong>retail <strong>electricity</strong> distribution enterprise is not found to be statistically significant.15
Table 3: Estimated demand functions, 1998-2008.Real Gross dummypurchase domesticprice productAdjR 2 Fln(Constant) ln(Pw) ln(GDP) ln(dummy)1 ln(D w)9.745 -0.590 0.181 0.974 63.697(8.840) (-10.786) (2.410)2 ln(D w)9.804 -0.598 0.181 -0.020 0.948 36.448(7.188) (-5.376) (2.234) (-0.088)ln – natural logarithm. In <strong>the</strong> brackets are t-statistics.Source: Own calculations.During <strong>the</strong> analysed period <strong>the</strong> real GDP increased, and also purchases <strong>of</strong> electricalenergy by <strong>the</strong> retail <strong>electricity</strong> distribution enterprise tended to increase, while <strong>the</strong> realwholesale purchase price <strong>of</strong> electrical energy cyclically oscillated: first, it declined with<strong>the</strong> <strong>electricity</strong> <strong>market</strong> deregulation, and since 2006 it has increased (Figure 7). Thisclearly illustrates only <strong>the</strong> temporary decline in <strong>the</strong> real wholesale price <strong>of</strong> electricalenergy, following <strong>the</strong> <strong>market</strong> deregulation and price liberalisation.Index 2001=100160140120100806040128.05121.56 123.36118.50118.24113.77110.12103.21113.8598.97100.00 95.76 97.51105.8798.2598.51 101.1688.3997.8190.0490.6088.2671.31 80.5575.85 77.82 76.67 74.6168.1046.80143.251993 1994 1995 1996 1997 1998 1999 2000 2001 2002 2003 2004 2005 2006 2007 2008Nominal priceReal priceFigure 7: Index <strong>of</strong> nominal and real purchase It prices <strong>of</strong> electrical energy (2001=100)Source: Own calculations.Revenue function16
The increase in <strong>the</strong> real wholesale purchase price <strong>of</strong> electrical energy by 1% increases <strong>the</strong>electro distribution enterprise’s total revenues for its fur<strong>the</strong>r sale <strong>of</strong> electrical energy by0.685% (Table 4). This suggests that <strong>the</strong> retail <strong>electricity</strong> distribution enterprise is notable to fully transmit <strong>the</strong> increased costs for <strong>the</strong> purchased electrical energy to <strong>the</strong> finalconsumers <strong>of</strong> electrical energy, i.e., industry, public lighting and households. At <strong>the</strong> sametime, <strong>the</strong> retail sale <strong>of</strong> electrical energy is associated with some o<strong>the</strong>r costs that are a part<strong>of</strong> <strong>the</strong> retail <strong>electricity</strong> price or total revenues from <strong>the</strong> sale <strong>of</strong> electrical energy toconsumers such as costs <strong>of</strong> wages and expenses for taxes.Table 4: Estimated total real revenue function, 1993-2005Purchasereal price Tax costsCosts forwages AdjR 2 Fln(Constant) ln(Pw) ln(Ctax) ln(Cwages)1 Ln(Revenue)4.702 0.685 0.062 0.264 0.564 6.596(1.457) (2.758) (1.140) (1.301)ln – natural logarithm. In <strong>the</strong> brackets are t-statistics.Source: Own calculations.Opinions on quality management <strong>of</strong> wholesale <strong>electricity</strong> supplyThe increasing competitive pressures in <strong>the</strong> <strong>electricity</strong> <strong>market</strong>s are forcing <strong>the</strong> <strong>electricity</strong>distribution enterprises to compete in both price and quality <strong>of</strong> supply. We investigate <strong>the</strong>important elements on wholesale-to-retail-sale chain supply management as seen by <strong>the</strong>participants and customers in <strong>the</strong>se relations. We have conducted surveys with <strong>the</strong>respondents by using <strong>the</strong> written questionnaire to gain insights into opinions on factors <strong>of</strong>quality management in wholesale-to-retail-sale <strong>electricity</strong> supply chain management. Theanswers to nine questions were obtained in a form <strong>of</strong> <strong>the</strong> Likert scale, where 1 means notimportant at all, and 5 means very important. In addition, we include control questions togain additional insights into important determinants for competitive <strong>electricity</strong> supplychain management. Among <strong>the</strong> respondents in <strong>the</strong> surveys, several are experts in energysupply chain management. We obtained 72 completed surveys out <strong>of</strong> 150. By education,<strong>the</strong>re are 5.6% with a Master’s degree or higher, 41.7% with a graduate degree, 22.2%with a higher education degree, 23.6% with secondary education, and 6.9% withvocational education. By gender, 83.3% are male and 16.7% female.17
The correlation analysis <strong>of</strong> variables for <strong>the</strong> set questions confirms a positive associationbetween development recognition and business trust in <strong>the</strong> wholesale-to-retail-sale<strong>electricity</strong> supply chain management (Pearson correlation coefficient 0.622),development products and those still to be known (0.599), references and long-termcooperation (0,554), references and relations with suppliers (0.537), references and localpatriotism (0.514), but less for o<strong>the</strong>r pairs <strong>of</strong> variables.Table 5: Matrix <strong>of</strong> different estimation methods (2 common factors)Maximumlikelihood methodFactor Matrix aMaximumlikelihood methodwith KaisernormalizationPattern MatrixFactor bMaximumlikelihood methodwith KaisernormalizationStructure MatrixFactorMaximumlikelihood methodwith VarimaxKaisernormalizationRotated FactorMatrix c1 2 1 2 1 2 1 2Developmentalproducts.370 .617 .139 .645 .439 .709 .660 .286Price supply .202 -.004 .214 -.031 .200 .069 .023 .200Commercialconditions.316 .668 .061 .709 .391 .737 .704 .226Reference .999 -.002 1.054 -.133 .993 .358 .129 .991Long-termcooperation.555 .232 .491 .188 .578 .416 .302 .520Local-patriotism .515 .150 .481 .102 .529 .326 .216 .491Relations withsuppliers.537 .226 .474 .184 .560 .405 .294 .503To be known .334 .596 .109 .625 .400 .676 .634 .253E-communication .146 .732 -.145 .803 .229 .735 .745 .049a 6 iterations, b 2 iterations, c 3 iterations.Source: Own calculations.The multivariate factor analysis was conducted in order to identify common factors onopinions about wholesale-to-retail-sale <strong>electricity</strong> supply chain management. The Screeplot suggests two common factors. The first common factor explains 40.0% <strong>of</strong> variance,while <strong>the</strong> second common factor additionally explains 14.5% <strong>of</strong> variance. The method <strong>of</strong>principal axis factoring does not provide estimates <strong>of</strong> factor weights nor <strong>of</strong>communalities. The maximum likelihood method without factor rotation estimates twocommon factors (Table 5). The first common factor is related to trust, with higher18
weights for variables in <strong>the</strong> <strong>electricity</strong> enterprise references, long-term cooperation,relations with suppliers, and local patriotism. The second common factor is identified asrecognition, with higher weights for <strong>the</strong> variables <strong>of</strong> e-communications, commercialconditions, and development <strong>of</strong> new products and services, and those still to be known.The maximum likelihood method with Oblimin with Kaiser normalisation streng<strong>the</strong>nedtwo common factors. For <strong>the</strong> first one, <strong>the</strong> important weights for variables has notchanged. The second one has <strong>the</strong> highest weights for <strong>the</strong> variables <strong>of</strong> commercialconditions, e-communications, development <strong>of</strong> new products and services, andrecognition. The maximum likelihood method with Varimax with Kaiser normalisationhas given similar results. Development recognition and business trust are found as <strong>the</strong>two common factor components, which are important for improving wholesale-to-retailsalesupply chain management within <strong>the</strong> existing <strong>Slovenia</strong>n wholesale-to-retail-sale<strong>electricity</strong> distribution <strong>market</strong>.Conclusion and policy implicationsThe demand for electrical energy has increased and has largely been driven by economicgrowth in <strong>the</strong> economy and real income increases <strong>of</strong> households. Due to this, during <strong>the</strong>most recent recession period, <strong>the</strong>re has been a slight decline in demand and consumption<strong>of</strong> electrical energy.As electrical energy is a crucial input into intermediary and final consumption, its realprice and quality <strong>of</strong> supply are also crucial for production costs, competitiveness <strong>of</strong> <strong>the</strong>economy, and living standard <strong>of</strong> <strong>the</strong> population. As <strong>the</strong> <strong>electricity</strong> energy <strong>market</strong>s in <strong>the</strong>past were traditionally monopolized by <strong>the</strong> local suppliers, <strong>the</strong> objective <strong>of</strong> <strong>the</strong>deregulation and liberalization <strong>of</strong> <strong>the</strong> <strong>electricity</strong> energy <strong>market</strong>s in Europe and in<strong>Slovenia</strong> is to induce and to encourage <strong>market</strong> forces and restructuring towards moredynamic <strong>market</strong> transactions with <strong>the</strong> abolishment <strong>of</strong> critical inefficiencies, and toestablish competitive supply <strong>of</strong> electrical energy to industrial users and to o<strong>the</strong>r final<strong>electricity</strong> consumers such as for public lighting and for final household consumption.19
The deregulation and liberalization <strong>of</strong> <strong>the</strong> electro energy system in <strong>Slovenia</strong> has aimedtowards <strong>market</strong> restructuring with more dynamic <strong>market</strong> transactions in <strong>the</strong> wholesale-toretail-sale<strong>electricity</strong> <strong>market</strong>s, abolishment <strong>of</strong> critical inefficiencies and competitivesupply to final <strong>electricity</strong> consumers. We have focused on <strong>the</strong> analysis <strong>of</strong> <strong>the</strong> <strong>market</strong>structures and competition in <strong>the</strong> wholesale-to-retail-sale <strong>electricity</strong> <strong>market</strong>s in <strong>Slovenia</strong>.The empirical evidence confirms <strong>the</strong> entry <strong>of</strong> new suppliers into <strong>the</strong> wholesale <strong>market</strong>s,but <strong>the</strong>ir role is less significant vis-à-vis <strong>the</strong> prevaling wholesale <strong>electricity</strong> supplier. Theobjective <strong>of</strong> <strong>the</strong> electro energy sector is restructuring in order to improve efficiency andto adjust to a greater role <strong>of</strong> <strong>market</strong> forces in <strong>the</strong> wholesale <strong>electricity</strong> <strong>market</strong>. The crucialfactor is <strong>the</strong> abolishment <strong>of</strong> critical inefficiencies in order to achieve a more competitivewholesale supply <strong>of</strong> electrical energy to <strong>the</strong> retail <strong>electricity</strong> distribution enterprises as anintermediary in more efficient and competitive <strong>electricity</strong> supply chain management for<strong>the</strong> final <strong>electricity</strong> consumers. However, <strong>the</strong> empirical evidence suggests that <strong>the</strong>institutional and organisational changes in <strong>the</strong> <strong>Slovenia</strong>n wholesale <strong>electricity</strong> <strong>market</strong> s<strong>of</strong>ar have not resulted in substantial changes in <strong>the</strong> number <strong>of</strong> suppliers, and particularlynot in <strong>the</strong>ir <strong>market</strong> structures. While <strong>the</strong> competition in <strong>the</strong> wholesale <strong>electricity</strong> <strong>market</strong> isencouraged by <strong>the</strong> entry <strong>of</strong> new suppliers, <strong>the</strong> state role in <strong>the</strong> wholesale <strong>electricity</strong>enterprises and in <strong>the</strong> wholesale-to-retail-sale <strong>electricity</strong> management is still important.The Lorenz curve and Gini coefficient <strong>of</strong> concentration clearly reveal a relatively highconcentration <strong>of</strong> <strong>the</strong> wholesale suppliers in <strong>the</strong> <strong>electricity</strong> <strong>market</strong>. As expected, <strong>the</strong> retail<strong>electricity</strong> distribution enterprises and final consumers <strong>of</strong> electrical energy are rational in<strong>the</strong>ir responses and economic decisions to <strong>the</strong> increasing role <strong>of</strong> <strong>market</strong> forces, assuggested by <strong>the</strong> statistically significant negative association between <strong>electricity</strong> demandsand real <strong>electricity</strong> price. The regression analysis for <strong>the</strong> price or revenue function for <strong>the</strong>retail <strong>electricity</strong> distribution enterprise also confirms <strong>the</strong> crucial role <strong>of</strong> direct priceelasticity, which is measured by <strong>the</strong> real wholesale purchase price for <strong>the</strong> purchasedelectrical energy at <strong>the</strong> wholesale <strong>market</strong>. The multivariate factor analysis, which is basedon <strong>the</strong> unique survey data, shows <strong>the</strong> increasing importance for long-term businessdevelopment recognition and business trust between participants on <strong>the</strong> wholesale andretail sale <strong>electricity</strong> distribution <strong>market</strong>. All <strong>the</strong>se, in a spite <strong>of</strong> <strong>the</strong> slow path, indicate <strong>the</strong>emerging and increasing role <strong>of</strong> <strong>market</strong> forces into <strong>the</strong> previously monopolised and20
government regulated wholesale-to-retail-sale <strong>electricity</strong> supply chain management and<strong>electricity</strong> <strong>market</strong>s.ReferencesBlok, K. (2005), »Enhanced policies for <strong>the</strong> improvement <strong>of</strong> <strong>electricity</strong> efficiencies«,Energy Policy, 33, 1635-1641.Cabral, L.M.B. (2000), Introduction to Industrial Organization, MIT Press, Cambridge.Chrystal, K.A. and Lipsey, R.G. (1997), Economics for Business in Management, OxfordUniversity Press, Oxford.European Commission (2008), Energy policy for a competitive Europe, EuropeanCommission <strong>of</strong> <strong>the</strong> European Communities, Brussels.Gujarati N. and Damodar (2003), Basic Econometrics, McGraw-Hill, New York.Kachigan, S.K. (1991), Multivariate Statistical Analysis: A Conceptual Introduction,Second Edition, Radius Press, New York.McAleese, D. (2004), Economics for Business: Competition, Macro-stability andGlobalisation, Prentice Hall, Harlow.Nillesen, P., Pollitt, H.L. and Michael, G. (2004), The Consequences for ConsumerWelfare <strong>of</strong> <strong>the</strong> 2001–2003, Electricity Distribution Price Review in <strong>the</strong> Ne<strong>the</strong>rlands,CIRED Conference, Torino.Nordhaus, W.D. (1994), Managing <strong>the</strong> Global Commons: The Economics <strong>of</strong> ClimateChange, The MIT Press, Cambridge, MA.Norušis, M.J. (2002), SPSS 12.0, Guide to Data Analysis, Prentice Hall, Upper SaddleRiver (N.J.).Papler, D. and Bojnec, Š. (2006), »Pomen managementa na dereguliranemmaloprodajnem trgu električne energije v Sloveniji«, Management, 2(2), 115-129.Papler, D. and Bojnec, Š. (2007), »Electricity Supply Management for Enterprises in<strong>Slovenia</strong>«, International Journal <strong>of</strong> Management and Enterprise Development, 4(4),403-414.Pearce, D.W. and Warford, J.J. (Eds.) (1993), World without End: Economics,Environment and Sustainable Development, Oxford University Press, New York.21
Stern, N. (2007), The Economics <strong>of</strong> Climate Change, Cambridge University Press,Cambridge.St<strong>of</strong>t, S. (2002), Power System Economics, Designing Markets for Electricity, IEEEPress.Wagner, W.R., Beal, C.N. and White, J.C. (2007), Global Climate Change: LinkingEnergy, Environment, Economy and Equity, Springer, London.22