Chapter 6: The State of Revenue Generation in Cities - LGRC DILG 10
Chapter 6: The State of Revenue Generation in Cities - LGRC DILG 10
Chapter 6: The State of Revenue Generation in Cities - LGRC DILG 10

Create successful ePaper yourself
Turn your PDF publications into a flip-book with our unique Google optimized e-Paper software.
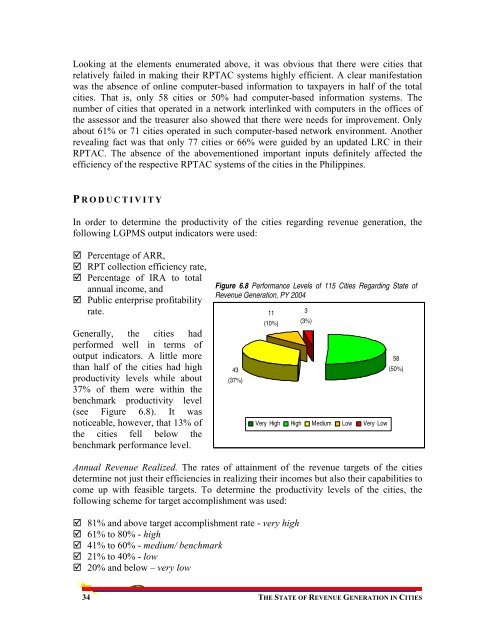
Look<strong>in</strong>g at the elements enumerated above, it was obvious that there were cities thatrelatively failed <strong>in</strong> mak<strong>in</strong>g their RPTAC systems highly efficient. A clear manifestationwas the absence <strong>of</strong> onl<strong>in</strong>e computer-based <strong>in</strong>formation to taxpayers <strong>in</strong> half <strong>of</strong> the totalcities. That is, only 58 cities or 50% had computer-based <strong>in</strong>formation systems. <strong>The</strong>number <strong>of</strong> cities that operated <strong>in</strong> a network <strong>in</strong>terl<strong>in</strong>ked with computers <strong>in</strong> the <strong>of</strong>fices <strong>of</strong>the assessor and the treasurer also showed that there were needs for improvement. Onlyabout 61% or 71 cities operated <strong>in</strong> such computer-based network environment. Anotherreveal<strong>in</strong>g fact was that only 77 cities or 66% were guided by an updated LRC <strong>in</strong> theirRPTAC. <strong>The</strong> absence <strong>of</strong> the abovementioned important <strong>in</strong>puts def<strong>in</strong>itely affected theefficiency <strong>of</strong> the respective RPTAC systems <strong>of</strong> the cities <strong>in</strong> the Philipp<strong>in</strong>es.P RODUCTIVITYIn order to determ<strong>in</strong>e the productivity <strong>of</strong> the cities regard<strong>in</strong>g revenue generation, thefollow<strong>in</strong>g LGPMS output <strong>in</strong>dicators were used: Percentage <strong>of</strong> ARR, RPT collection efficiency rate, Percentage <strong>of</strong> IRA to totalannual <strong>in</strong>come, and Public enterprise pr<strong>of</strong>itabilityrate.Generally, the cities hadperformed well <strong>in</strong> terms <strong>of</strong>output <strong>in</strong>dicators. A little morethan half <strong>of</strong> the cities had highproductivity levels while about37% <strong>of</strong> them were with<strong>in</strong> thebenchmark productivity level(see Figure 6.8). It wasnoticeable, however, that 13% <strong>of</strong>the cities fell below thebenchmark performance level.Figure 6.8 Performance Levels <strong>of</strong> 115 <strong>Cities</strong> Regard<strong>in</strong>g <strong>State</strong> <strong>of</strong><strong>Revenue</strong> <strong>Generation</strong>, PY 200443(37%)11(<strong>10</strong>%)3(3%)Very High High Medium Low Very Low58(50%)Annual <strong>Revenue</strong> Realized. <strong>The</strong> rates <strong>of</strong> atta<strong>in</strong>ment <strong>of</strong> the revenue targets <strong>of</strong> the citiesdeterm<strong>in</strong>e not just their efficiencies <strong>in</strong> realiz<strong>in</strong>g their <strong>in</strong>comes but also their capabilities tocome up with feasible targets. To determ<strong>in</strong>e the productivity levels <strong>of</strong> the cities, thefollow<strong>in</strong>g scheme for target accomplishment was used: 81% and above target accomplishment rate - very high 61% to 80% - high 41% to 60% - medium/ benchmark 21% to 40% - low 20% and below – very low34 THE STATE OF REVENUE GENERATION IN CITIES