Chapter 6: The State of Revenue Generation in Cities - LGRC DILG 10
Chapter 6: The State of Revenue Generation in Cities - LGRC DILG 10
Chapter 6: The State of Revenue Generation in Cities - LGRC DILG 10

You also want an ePaper? Increase the reach of your titles
YUMPU automatically turns print PDFs into web optimized ePapers that Google loves.
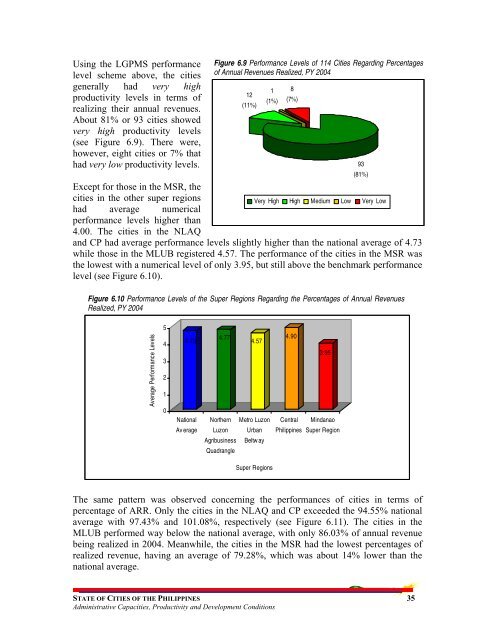
Us<strong>in</strong>g the LGPMS performancelevel scheme above, the citiesgenerally had very highproductivity levels <strong>in</strong> terms <strong>of</strong>realiz<strong>in</strong>g their annual revenues.About 81% or 93 cities showedvery high productivity levels(see Figure 6.9). <strong>The</strong>re were,however, eight cities or 7% thathad very low productivity levels.Figure 6.9 Performance Levels <strong>of</strong> 114 <strong>Cities</strong> Regard<strong>in</strong>g Percentages<strong>of</strong> Annual <strong>Revenue</strong>s Realized, PY 200412(11%)Except for those <strong>in</strong> the MSR, thecities <strong>in</strong> the other super regionshad average numericalperformance levels higher than4.00. <strong>The</strong> cities <strong>in</strong> the NLAQVery High High Medium Low Very Lowand CP had average performance levels slightly higher than the national average <strong>of</strong> 4.73while those <strong>in</strong> the MLUB registered 4.57. <strong>The</strong> performance <strong>of</strong> the cities <strong>in</strong> the MSR wasthe lowest with a numerical level <strong>of</strong> only 3.95, but still above the benchmark performancelevel (see Figure 6.<strong>10</strong>).1(1%)8(7%)93(81%)Figure 6.<strong>10</strong> Performance Levels <strong>of</strong> the Super Regions Regard<strong>in</strong>g the Percentages <strong>of</strong> Annual <strong>Revenue</strong>sRealized, PY 2004Average Performance Levels5432<strong>10</strong>4.73NationalAv erage4.774.57Northern Metro LuzonLuzon UrbanAgribus<strong>in</strong>ess Beltw ayQuadrangle4.90CentralPhilipp<strong>in</strong>es3.95M<strong>in</strong>danaoSuper RegionSuper Regions<strong>The</strong> same pattern was observed concern<strong>in</strong>g the performances <strong>of</strong> cities <strong>in</strong> terms <strong>of</strong>percentage <strong>of</strong> ARR. Only the cities <strong>in</strong> the NLAQ and CP exceeded the 94.55% nationalaverage with 97.43% and <strong>10</strong>1.08%, respectively (see Figure 6.11). <strong>The</strong> cities <strong>in</strong> theMLUB performed way below the national average, with only 86.03% <strong>of</strong> annual revenuebe<strong>in</strong>g realized <strong>in</strong> 2004. Meanwhile, the cities <strong>in</strong> the MSR had the lowest percentages <strong>of</strong>realized revenue, hav<strong>in</strong>g an average <strong>of</strong> 79.28%, which was about 14% lower than thenational average.STATE OF CITIES OF THE PHILIPPINES 35Adm<strong>in</strong>istrative Capacities, Productivity and Development Conditions